This is a repository copy of
Comparison of shot peening and nitriding surface treatments
under complex fretting loadings
.
White Rose Research Online URL for this paper:
http://eprints.whiterose.ac.uk/7695/
Article:
Kubiak, K., Fouvry, S. and Wendler, B.G. (2006) Comparison of shot peening and nitriding
surface treatments under complex fretting loadings. Materials Science Forum, 513. 105 -
118. ISSN 0255-5476
DOI: 10.4028/0-87849-400-6.105
eprints@whiterose.ac.uk https://eprints.whiterose.ac.uk/ Reuse
See Attached
Takedown
If you consider content in White Rose Research Online to be in breach of UK law, please notify us by
Comparison of Shot Peening and Nitriding Surface
Treatments Under Complex Fretting Loadings
K.J. Kubiak
1-2, b, S. Fouvry
1,a, B.G. Wendler
2,c 1Laboratoire de Tribologie et Dynamique des Systèmes, CNRS UMR 5513, Ecole
Centrale de Lyon, 36 Avenue Guy de Collongue, 69131 Ecully, France
2
Technical University of Lodz, Institute of Materials Engineering, Stefanowskiego 1,
90924 Lodz, Poland
krzysztof@kubiak.co.uk
Keywords:fretting, shot peening, nitriding, friction, cracking, wear.
Abstract. Considered as a plague for numerous industrial assemblies, fretting associated with small
oscillatory displacements is encountered in all quasi-static contacts submitted to vibrations.
According to the sliding conditions, fretting cracks and/or fretting wear can be observed in the
contact area. On the other hand an important development has been achieved in the domain of
surface engineering during the past three decades and numerous new surface treatments and
coatings are now available. Therefore there is a critical challenge to evaluate the usefulness of these
new treatments and/or coatings against fretting damage. To achieve this objective, a fast fretting
methodology has been developed. It consists in quantifying the palliative friction, cracking and
wear responses through a very small number of fretting tests. With use of defined quantitative
variables, a normalized polar fretting damage chart approach is introduced. Finally, to evaluate the
performance of the assemblies after these protective surface treatments under complex fretting
loadings, an original sequence of partial slip and gross slip sliding procedure has been applied. It
has been demonstrated that performing of a very short sequence of gross slip fretting cycles can
critically decrease the resistance of the treated surfaces against cracking failures activated under
subsequent partial slip loadings.
Introduction
Fretting is a small oscillatory movement, which may occur between contacting surfaces
micro displacements
[<100 µm]
contact pressure
blade / disk contacts in turbine engine
prosthesis
electrical connectors
d
is
p
la
c
e
m
e
n
t
a
m
p
lit
u
d
e partial slip
structure of the interface
stick zone sliding
zone
damages
cracking
gross
slip full
sliding wear
sliding transition :t
(a) (b)
Figure 1: (a) Illustration of the fretting damages in different assemblies; (b) Different forms of
fretting damage as a function of the imposed displacement amplitude.
fretting is encountered in all quasi-static assemblies submitted to vibrations. Therefore numerous
advanced technological products of modern industry, like helicopters, aircrafts, trains, ships, trucks,
suspension cables of bridges, electrical connections etc. are potentially endanger by fretting
damage (see Fig. 1a) [1].
Partial slip observed at small displacement amplitudes corresponds to a combined contact area
between fretting bodies displaying sliding and sticking zones. Gross slip displacements are greater
and related to full sliding conditions. Whaterhouse et al. [2] first indicated a correlation between the
sliding regime and the damage evolution (Fig. 1b). It has been shown that for a given normal load
and at stabilized sliding conditions fretting cracking is being encountered mainly in the partial slip
regime, whereas fretting wear is being observed most of all for larger gross slip amplitudes. The
transition from one damage mechanism to the other one, linked to the transition displacement
amplitude ( t), is not clearly marked. However, competitive wear and cracking phenomena are
usually observed near this transition. It is worth to note that first idea of this transition has been
supplemented to the fretting map concept first introduced by Vingsbo [3] and completed
subsequently by Vincent and co-authors [4].Quantitative approaches have been developed since
then to formalize either the cracking phenomena from multiaxial fatigue approaches [5-7] or wear
kinetics based on a dissipated energy concept [8, 9].
However it is extremely rare that a researcher assumes a task of a global analysis covering both
cracking and wear aspects and very little has been done to provide such a global description of
fretting damage. Even less has been made for a comparison of palliatives like surface treatments. It
is the purpose of this research to appease such a fundamental need by focusing it on the following
[image:3.481.63.440.80.221.2]- development of a fretting wear test in order to analyse both wear and cracking damage
induced by fretting with use of a single contact geometry.
- development of a simplified test methodology to identify the constitutive fretting damage (i.e.
friction, wear and/or cracking) in a series of less than 10 fretting tests.
- the impact of a combined gross and partial slip slidings on cracking behaviour in the contact
area.
Applied to the fretting couple with a reference steel, this methodology has been used to
compare two different treatments of the steel surface: the shot peening and plasma nitriding.
Experimental procedure
Fretting test
As previously mentioned the applied normal loadings must satisfy the stress conditions
allowing cracking to take place. The displacement control needs also a sufficient resolution to
cover both partial and gross slip conditions. These two requirements have been achieved by
adapting an original fretting wear test apparatus on a classical tension-compression (25 kN)
hydraulic machine described elsewhere [10]. The contact configuration is presented in Fig. 2a. The
normal force (P) is maintained at a constant value, while the tangential force (Q) and displacement
( ) are recorded continuously. It allows for the plotting of Q– fretting loops (Fig. 2b). Closed
(narrow) Q– fretting loops correspond to a partial slip condition, whereas opened (quadratic) ones
are associated to a gross slip condition. Quantitative variables including the displacement ( *) and
tangential force (Q*) amplitudes, the dissipated energy (Ed) and the sliding amplitudes ( g) can be
extracted from these loops. In order to obtain a dynamic overview of the whole fretting test, the
consecutive fretting cycles are being assembled in a three-dimensional form of a fretting log (Fig.
2c). The global loading parameters like:
the average tangential force amplitude
Error! Objects cannot be created from editing field codes.
and Archard’s product of the normal force by the sliding distance:
N1 i
gi i
4
can then be calculated.
Prior to testing, all the specimens have been submitted to cleaning in ultrasonic bath first in
acetone and next the sliding surfaces have been cleaned with ethyl alcohol just before bringing
them into contact. All the tests have been carried out in an ambient laboratory environment (in air,
at room temperature), in unlubricated conditions and at the relative humidity of the air 40-50%.
fixed
mobile
20m m
Q(t)
cylinder 52100 steel measured
tangential displacement
(t)
measured tangential force plane (studied materials)
(a) (b)
dissipated energy
Ed
displacement,(µm) ( Q*,* )
ta
n
g
e
n
ti
a
l
fo
rc
e
Q
,
(N
)
sliding amplitudeg
(c)
ta
n
g
e
n
ti
a
l
fo
rc
e
lo
a
d
in
g
Q
fre tting
cyc les(lo
g sca
le)
displacement * µm applied
normal force
[image:5.481.65.436.182.285.2]P
Figure 2 : Test procedure : (a) Fretting setup; (b) Extraction of the contact loading parameters from the
fretting loop (gross slip condition); (c) Illustration of the fretting log chart under partial slip conditions.
2.2 Studied materials and surface treatments
Substrate and counterbody
Inspired by an industrial application, the studied tribo-couple consists of a low alloyed
30NiCrMo8 steel (used as the substrate for different surface treatments) and a counterbody made of
52100 AISI steel. The 30NiCrMo8 steel was machined in the form of 10x10x15 mm rectangular
prisms with one polished face of the roughness value Ra < 0.05 µm. A similar value of the
roughness parameter Ra has been measured on the counterbody surface of the 80 mm diameter
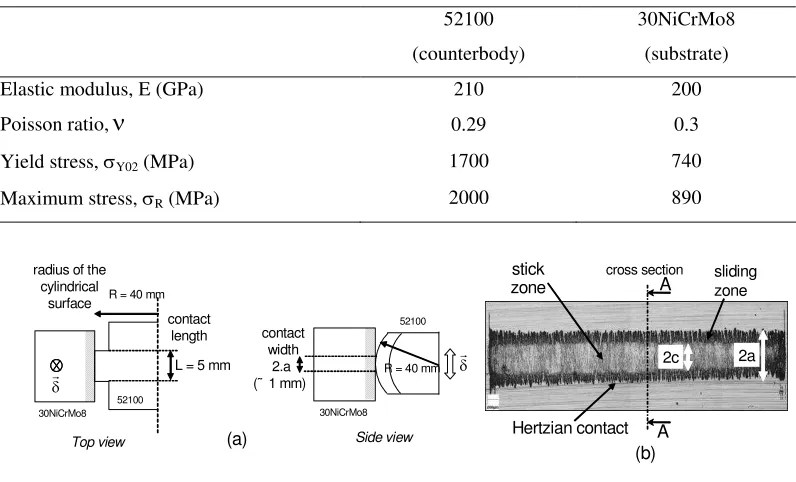
cylinder made of the hardened 52100 AISI steel (Fig. 3a). In order to establish properly plane strain
conditions, the contact length (L) was fixed at 5 mm inducing a/L ratio below 0.1 (a - half width of
the Hertzian contact area).
The steel substrate 30NiCrMo8 under investigation was heat treated at 820°C, oil quenched at
20°C and tempered at 520±5ºC for 2 hours. The mechanical properties of the steel as well as of the
Table 1 : Mechanical properties of the steels forming the fretting couple.
52100
(counterbody)
30NiCrMo8
(substrate)
Elastic modulus, E (GPa) 210 200
Poisson ratio,
0.29 0.3Yield stress,Y02(MPa) 1700 740
Maximum stress,R(MPa) 2000 890
R = 40 mm
L = 5 mm R = 40 mm
radius of the cylindrical
surface
contact
length contact width
2.a (˜1 mm)
Top view Side view
(a)
(b) 52100
52100
30NiCrMo8 30NiCrMo8
2c 2a
Hertzian contact stick
zone A slidingzone
A
cross section
Figure 3 : Contact configuration during the fretting test: (a) Cylinder/plane configuration; (b) Image of a
fretting scar on the substrate surface tested in the partial slip regime.
Treatments of the substrate surface
Shot peening
Shot peening of a part of the rectangular prisms has been conducted following the conventional
procedure 0.0063A (200% recovering and balls of 0.6 mm diameter). Carried out with use of an air
blast machine it satisfies the MIL-S-13165 standard, equivalent to an ALMEN intensity of
0.2-0.3 mm (from AFNOR NFL 06832 standard). The value of the average roughness parameter Ra of
the substrate surface after shot peening was equal to 2 µm.
Nitriding
Another part of the rectangular prisms has been plasma-nitrided in the conventional commercial
process NIVOX 130. After the process the average microhardness of the treated surface was equal
thickness of the nitrided layer was about 424 µm. The structure of the nitrided layer is shown in
Fig. 4.
nitriding
layer
nitriding
layer
424 µm
21.5 µm
'
'
'
'
nitriding
layer
nitriding
layer
424 µm
21.5 µm
'
'
'
'
Figure 4 : Optical micrographs of the cross section with the nitrided layer.
2.3 Procedure of damage quantification
Crack length quantification
Due to a particular stress field distribution in the contact area the cracks nucleating during
fretting wear are growing rather slowly and do not provoke a rupture of the flat specimen.
Therefore, the given cracking analysis consists in measuring and comparing the crack length below
the surface as a function of the loading conditions. The following expert procedure has been
applied: the plane specimen on which the fretting test has been performed is being cut in two parts
along a plane perpendicular to the specimen surface submitted to wear at the middle of the fretting
scar. After careful polishing the surface of the cross-section is submitted to optical microscopy
sliding direction
polishing of cross section
polymer
cutting (middle of the fretting scars)
Polishing Aligned Fretting Tests
determine the maximum crack length (lmax)
lmax lmax
fretting scar
[image:8.481.46.436.72.187.2]Optical observation
Figure 5 : Fretting crack expertise.
Wear volume measurement
One advantage of the 2D cylinder/plane configuration is that the wear volume can be directly
and precisely estimated from a limited number of low cost 2D surface profiles, as the fretting scars
are linear. The following procedure was applied. First, the specimens were ultrasonically cleaned to
eliminate as much debris as possible. In the next step a number of equidistant surface profiles was
made in the direction perpendicular to the length of the fretting scar (i.e. along the sliding
direction). An average fretting wear surface is then computed which, multiplied by the contact
length (L), allows the plane wear volume (VP) to be estimated. It is worth to note that in a previous
comparison with complete 3D surface profiles the difference between the both estimations was less
than 7 %.
The wear volume of the counter-body (VC) was defined in the same way by extracting the
cylinder shape from the surface profiles. Finally, the total wear volume in the contact area was
estimated:
VT=VP+VC
3. Development of experimental methodology
3.1 Definition of the contact conditions
It is well known from different assessments in the field of Tribology and Fatigue that the closer
prediction of the endurance of the palliative solution. Precise FEM modelling must first be
undertaken to reckon the real distribution of the pressure field in the vicinity of the contact area.
Due to the extreme loading range and the complexity of the contact configuration, usually the
contact geometry in the industrial assemblies can not be reproduced in the available laboratory test.
Nevertheless, in order to examine the severity of the contact stress, the cylinder/plane configuration
used in the experiments was adjusted to reproduce as closely as possible the external peak pressure.
It has been achieved by applying a constant normal force 2000 N which provided a representative
po=600 MPa maximum peak pressure and an equivalent a = 430 µm half width of the contact area
(Fig. 6a). Even though the current FEM computations can provide a reasonable estimation of the
pressure distribution in this area, the prediction of the pertinent displacements is more difficult. A
simple solution is to cover a sufficient range of displacements in order to identify first the transition
from partial slip to gross one, next quantify the cracking phenomena under partial slip conditions
and finally to reckon the part of the wear due to fretting under gross slip conditions (Fig. 6b) [9].
radial position (r)
surface pressure profile computed with use of
FEM method c o n ta c t p re s s u re
FEM computation of the real application
r
pmax= 600 MPa
2a=860 µm
Hertzian approximation of the pic pressure
displacement amplitude (+/- µm)
n o rm a l fo rc e (N ) sliding transition (I) cracking under partial slip (II) wear under gross slip (III) fixed representative pressure loading
displacement amplitude (+/- µm)
n o rm a l fo rc e (N ) sliding transition (I) cracking under partial slip (II) wear under gross slip (III) fixed representative pressure loading (a) (b)
radial position (r)
surface pressure profile computed with use of
FEM method c o n ta c t p re s s u re
FEM computation of the real application
r
pmax= 600 MPa
2a=860 µm
Hertzian approximation of the pic pressure
displacement amplitude (+/- µm)
n o rm a l fo rc e (N ) sliding transition (I) cracking under partial slip (II) wear under gross slip (III) fixed representative pressure loading
displacement amplitude (+/- µm)
[image:9.481.50.436.316.455.2]n o rm a l fo rc e (N ) sliding transition (I) cracking under partial slip (II) wear under gross slip (III) fixed representative pressure loading (a) (b)
Figure 6 : Definition of the loading parameters: (a) Illustration of the methodology to identify a
representative Hertzian loading conditions, (b) Illustration of the three steps fretting damage methodology
applied for the Hertzian contact configuration defined in (a).
3.2 Fretting sliding analysis and identification of pertinent friction parameters
To identify the displacement amplitude marking the transition from partial to gross slip regime,
an incremental displacement methodology has been adapted [11]. It consists in imposing a very
single fretting test, a complete overview of the sliding response is provided. It should be noted that
the coherence of this methodology is fully dependent on the value of the increment of the
displacement amplitude and on the numberN of fretting cycles imposed to stabilize the sliding
contact after consecutive increments of the amplitude (Fig. 7a).
fretting cycles d is p la c e m e n t a m p lit u d e µm 2 . 0 * (a) recorded values of the sliding conditions
cycles 1000
N
(stabilized period)
(increment of displacement amplitude)
displacement amplitude* (µm)
0 0.2 0.4 0.6 0.8 1
0 5 10 15 20
(energy ratio) energy discontinuity gross slip partial slip t
sliding transition P Qt t GS
P * Q P * Q (tangential force ratio) * Q . . 4 E A g d (b) fretting cycles d is p la c e m e n t a m p lit u d e µm 2 . 0 * (a) recorded values of the sliding conditions
cycles 1000
N
(stabilized period)
(increment of displacement amplitude)
displacement amplitude* (µm)
0 0.2 0.4 0.6 0.8 1
0 5 10 15 20
(energy ratio) energy discontinuity gross slip partial slip t
sliding transition P Qt t GS
P * Q P * Q (tangential force ratio) * Q . . 4 E A g d 0 0.2 0.4 0.6 0.8 1
0 5 10 15 20
(energy ratio) energy discontinuity gross slip partial slip t
sliding transition P Qt t GS
[image:10.481.49.442.161.318.2]P * Q P * Q (tangential force ratio) * Q . . 4 E A g d (b)
Figure 7 : Illustration of the incremental sliding method applied to a single fretting test, where the fretting
sliding response can be quantified. (a) definition of the procedure; (b) results of the procedure applied to the
30NiCrMo8/52100 fretting couple: identification of the sliding transition (t), of the friction coefficient at the
sliding transition (t) (representative of the friction law under partial slip) as well as of the friction coefficient
under stabilized gross slip conditions (GS).
It has been shown in previous investigations that a perfect coherence with classical constant
sliding test conditions has been achieved for the case in which the increment of the sliding
amplitude remained smaller than=0.2 µm and the number of stabilizing cycles was greater than
1000 cycles. The response of the reference fretting couple 30NiCrMo8/52100 is illustrated in
Figure 7b. The normalized tangential force ratio (Q/P) as well as the dissipated energy criterion
A=Ed/(4·Q
*
·*) are plotted versus the applied displacement amplitude.
In agreement with the Mindlin’s formalism, the sliding transition ( t) from partial to gross slip
is related to an energy discontinuity. This discontinuity is associated also to a maximum value of
the tangential force amplitude and related to the friction coefficient at the sliding transition (µt). It
has been confirmed in previous studies that this value is quite representative of the local friction
displacement amplitudes greater than the transition one, the full sliding takes place , which favours
the wear processes. In result, a compliant interfacial third body is being produced which decreases
the friction coefficient. A stabilized friction value, representative of the friction law under gross
slip conditions is then identified (µGS).
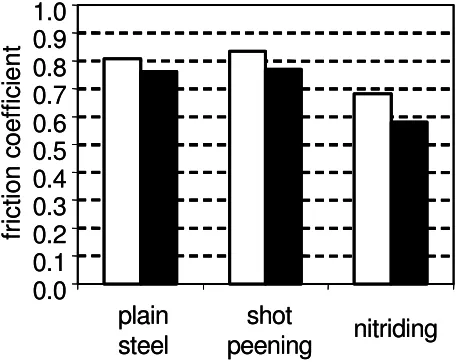
The quantitative variables ( t, µt, µGSQt) defining the tribological behaviour of the tribosystem
under investigation are compiled in Table 2 and the mean values of different friction coefficients
for the different fretting couples are given in Figure 8. It can be note that these values calculated
from the fretting tests are rather greater than those encountered in numerous conventional tests (see
e.g. a value 0.8 of the friction coefficient for the plain steel fretting contact in Figure 8). Smaller
friction coefficients have been observed under gross slip condition due to the third body
accommodation mechanisms. However, this decrease of friction is rather moderate (between 0.05
and 0.1). It follows also from this comparison that the shot peening has a very little impact on the
friction coefficient. A more significant decrease of the coefficient has been observed after the
nitriding of the steel surface. Indeed, it is well known that the’ phase has a significantly lower
friction coefficient against the plain steel counterbody. This fact corresponds well with our results
from Figure 8. Nevertheless, even in that case the decrease of friction coefficient is not greater than
0.2 and suggests that fretting sliding promotes rather greater friction coefficients in comparison
with those in numerous conventional tribotests.
0.0
0.1
0.2
0.3
0.4
0.5
0.6
0.7
0.8
0.9
1.0
plain
steel
shot
peening
nitriding
fr
ic
ti
o
n
c
o
e
ff
ic
ie
n
t
0.0
0.1
0.2
0.3
0.4
0.5
0.6
0.7
0.8
0.9
1.0
plain
steel
shot
peening
nitriding
fr
ic
ti
o
n
c
o
e
ff
ic
ie
n
[image:11.481.138.366.402.583.2]t
Figure 8 : Mean friction coefficients reckoned with use of incremental sliding analysis : friction
coefficienttdefined at the displacement amplitudet; friction coefficient under stabilized gross slip
Hence the studied treatments do not decrease effectively the friction coefficients and can not be
compared with those which provoke a drastic decrease due to application of low friction lubricant
coatings [13, 14]. However the present application, imposing a fixed assembly, can not tolerate any
relative sliding, and a low friction coefficient is not specifically required. This tendency can be
generalized in numerous mechanical components where a similar friction coefficient rather than the
reference system are often preferred to limit heavy and tiresome re-designing of the assembly.
3.3 Analysis of the fretting cracking under partial slip conditions
Figure 9a illustrates the methodology of quantifying the cracking response under partial slip.
The maximum crack length is achieved at the maximum tangential loading next to the sliding
transition. Above this transition the lower value of the friction coefficient and a competitive effect
of wear tend to decrease the crack extent [2, 9]. To investigate crack development, constant
tangential force amplitudes have been applied by properly adjusting the partial slip displacement
amplitude. It has been shown in the previous analysis that for a test duration of around 250 000
cycles the cracks are no longer developing. To maintain stable partial slip conditions, the first
fretting test is adjusted to a tangential force amplitude slightly below the transition value (0.9 Qt). A
second test is conducted around 75% of the transition amplitude. By comparing the corresponding
maximum crack lengths, the successive test conditions are adjusted to fully describe the crack
length evolution versus the tangential force amplitude and to assess the threshold crack nucleation
(Qth) as precisely as possible.
Therefore in 4 to 6 fretting tests, two quantitative variables defining crack nucleation in the
contact area as well as its length can be quantify:
- The tangential force amplitude (Qth) correspond to the threshold crack nucleation.
- The maximum crack length defined at 90% of the maximum tangential force amplitude and
related to the maximum crack length of the fretting contact for the studied pressure condition:
lMAX=lmax(90% Qt). The different tribo-systems have been investigated and the corresponding
lMAX m a x c ra c k le n g th
lma
x
(µ
m
)
tangential force amplitude Q (N)
gross slip partial slip
Qt
unstable sliding condition
Qt-10%
stable partial slip conditions optimization of the
successive loading conditions (Q*) lmax(75%Qt) lmax(90%Qt) Qth crack nucleation threshold 0 50 100 150 200
800 1000 1200 1400 1600 1800 tangential force amplitude Q* (N)
m a x im u m c ra c k le n g th
lma
x ( m ) plain steel shot peening nitriding 0 50 100 150 200
800 1000 1200 1400 1600 1800 tangential force amplitude Q* (N)
m a x im u m c ra c k le n g th
lma
x ( m ) plain steel shot peening nitriding (a) (b) lMAX m a x c ra c k le n g th
lma
x
(µ
m
)
tangential force amplitude Q (N)
gross slip partial slip
Qt
unstable sliding condition
Qt-10%
stable partial slip conditions optimization of the
successive loading conditions (Q*) lmax(75%Qt) lmax(90%Qt) Qth crack nucleation threshold 0 50 100 150 200
800 1000 1200 1400 1600 1800 tangential force amplitude Q* (N)
m a x im u m c ra c k le n g th
lma
x ( m ) plain steel shot peening nitriding 0 50 100 150 200
800 1000 1200 1400 1600 1800 tangential force amplitude Q* (N)
m a x im u m c ra c k le n g th
lma
[image:13.481.48.437.73.236.2]x ( m ) plain steel shot peening nitriding (a) (b)
Figure 9 : Illustration of the simplified fretting cracking methodology: (a) identification of the basic
cracking parameters (crack nucleation threshold Qth; fretting crack propagation parameter lMAX=lmax(90% Qt)); (b)
application of the methodology to the three tribosystems investigated in the work.
The evolution of crack length versus the applied tangential force amplitudes for the three
tribosystems investigated in the work is given in Figure 9b. Taking into account a limited number
of the fretting tests, linear approximations have been used to describe the evolution of the crack
length. In case of the reference plain 30NiCrMo8 steel the crack nucleation threshold Qthis near to
1100 N and cracks propagate up to their maximum length lMAXof approximately 110 µm. It looks
also like the shot peening treatment does not improve significantly the resistance to crack
nucleation but displays a significant benefit regarding the propagation. To explain such a behaviour
it is essential to consider the very sharp stress gradient in the vicinity of the fretting contact. The
cumulated cyclic plastic strain with a maximum on the top surface, tends to relax rapidly the
primary compressive stresses provoked by the treatment. Hence the potential beneficial impact of
the shot peening on the surface crack nucleation is rapidly declined. It should be noted that this
phenomenon depends to a great extent on the elastoplastic behaviour of the material. During the
ensuing propagation stage, the crack extends below the surface, crossing domains less affected by
the contact loading. Free of cyclic plastic strain, the initial peening compressive stresses are
maintained. A higher compressive stress state is imposed at the crack tip which consequently
decreases its propagation rate.
The analysis of the effect of nitriding on the cracking response of the reference steel shows that
Therefore such a treatment appears to be the best fretting cracking palliative among those
investigated in the work. However, wider analyses, including the successively developed variable
fretting test conditions as well as fretting fatigue loadings, are required for complete evaluation of
the impact of any surface treatment on crack propagation.
3.4 Quantification of wear under gross slip
To compare the wear behaviour under gross slip, four displacement amplitudes from ±25 to
±100 µm were applied. Unlike the cracking phenomena, the wear steady state in this regime is
reached after a few thousand cycles, so the test duration can be reduced to 25000 cycles. For the
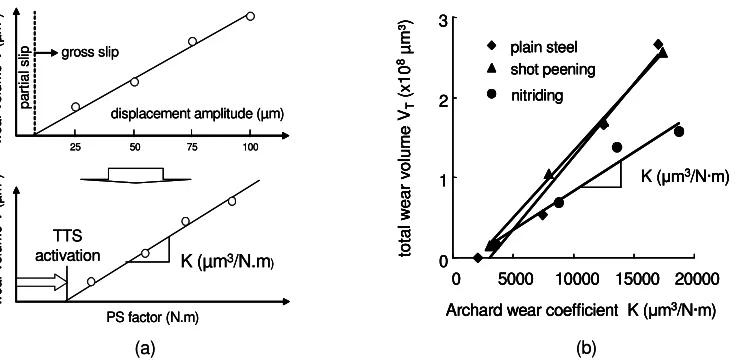
first approximation the Archard model [15] can be applied, (i.e wear volume versus the P·S
product). A linear plot has been used for approximation of the wear kinetics and its slope defined as
Archard’s wear coefficient has been reckoned:
PS
V
K
In order to infer the various wear mechanisms and in particular the mass transfer phenomena
from one to the other counterface, the wear of the plain specimen, that of the cylinder as well as the
total volume wear of the system will be analysed. One can see from Figure 10a that the plot of the
wear volume versus the Archard’s product is well approximated by a linear function. However, the
plot does not cross the origin of the coordinate system, there is a small shift along the P·S axis
associated to wear incubation threshold energy. It has been shown in the previous work [16] that
this energy can be related to the cumulated plastic transformation first required to modify the initial
displacement amplitude (µm)
25 50 75 100
p a rt ia l s
lip gross slip
w e a r v o lu m e V (µ m 3)
PS factor (N.m)
K (µm3/N.m)
w e a r v o lu m e V (µ m 3) TTS activation 0 1 2 3
0 5000 10000 15000 20000 Archard wear coefficient K ( m3/N·m)
to ta l w e a r v o lu m e VT (x 1 0 8µ m ³)
K ( m3/N·m)
plain steel shot peening nitriding 0 1 2 3
0 5000 10000 15000 20000 Archard wear coefficient K ( m3/N·m)
to ta l w e a r v o lu m e VT (x 1 0 8µ m ³)
K ( m3/N·m)
plain steel shot peening
nitriding
(a) (b)
displacement amplitude (µm)
25 50 75 100
p a rt ia l s
lip gross slip
w e a r v o lu m e V (µ m 3)
PS factor (N.m)
K (µm3/N.m)
w e a r v o lu m e V (µ m 3) TTS activation
displacement amplitude (µm)
25 50 75 100
p a rt ia l s
lip gross slip
w e a r v o lu m e V (µ m 3)
PS factor (N.m)
K (µm3/N.m)
w e a r v o lu m e V (µ m 3) TTS activation 0 1 2 3
0 5000 10000 15000 20000 Archard wear coefficient K ( m3/N·m)
to ta l w e a r v o lu m e VT (x 1 0 8µ m ³)
K ( m3/N·m)
plain steel shot peening nitriding 0 1 2 3
0 5000 10000 15000 20000 Archard wear coefficient K ( m3/N·m)
to ta l w e a r v o lu m e VT (x 1 0 8µ m ³)
K ( m3/N·m)
plain steel shot peening
nitriding
[image:15.481.60.429.68.248.2](a) (b)
Figure 10 : (a) Illustration of the methodology applied to quantify wear under gross slip conditions; (b)
application to the total wear quantification of the tribosystems under investigation.
This very brittle structure is being successively fractured and generates the incipient wear
debris. All the tribosystems investigated in the work involve metallic materials which promotes
similar threshold energies. Therefore, the pertinent wear palliatives can be analysed directly with
use of the Archard’s wear coefficients (Fig. 10b, Table 2).
This comparison in terms of total wear resistance indicates that the shot peening treatment has
no impact on wear resistance. Unlike the shot peening the nitriding treatment increases effectively
the resistance of fretting wear - the relevant Archard’s coefficient is approximately twice less than
that for the reference plain steel.
Compiling the different Archard’s coefficients allows the comparison of flat and cylinder
counterbodies (Fig. 11). In case of the reference fretting couple 30NiCrMo8/52100 contact, there is
a homogeneous wear in the contact area between the two first bodies. More interesting is the wear
response of the same fretting couple with the 30NiCrMo8 steel after shot peening. The plastic
deformation induced by peening treatment must have increased the surface hardness and one could
expect that its resistance to wear would be greater. In fact the opposite effect is being observed. To
explain this behaviour one must take into account the brittleness of the plastically transformed
surface and numerous microcracks generated during the peening treatment. Nevertheless more
A
rc
h
a
rd
w
e
a
r
c
o
e
ff
ic
ie
n
t
K
(x
1
0
3
m
3
/N
·m
)
0
2
4
6
8
10
12
14
16
18
20
plain
steel
shot
peening
nitriding
A
rc
h
a
rd
w
e
a
r
c
o
e
ff
ic
ie
n
t
K
(x
1
0
3
m
3
/N
·m
)
0
2
4
6
8
10
12
14
16
18
20
plain
steel
shot
[image:16.481.129.373.70.271.2]peening
nitriding
Figure 11 : Wear kinetics of the tribosystems under investigation: : K52100cylinder counterbody;
KTREAT.rectangular prism made of the reference steel after different surface treatments; + : KTOTALtotal
volume wear of the fretting couple.
On the other hand the wear rate of the reference steel after nitriding treatment is nearly the same
as that of the plain steel. This result can be related to the brittleness of the ' phase. In fact the major
gain in terms of the resistance to fretting wear is observed for the 52100 counterbody. This result
can be explained if one takes into account that the debris of the brittle ' phase form a compliant
third body between the first bodies of the fretting couple which renders difficult the direct
metal-metal interaction and, in consequence, decreases the adhesive wear identified for the previous
tribosystem.
To sum up this fast fretting analysis one can say that nitriding treatment is potentially a
promising treatment against wear induced by debris formation. However, in the present study, the
durability of its benefit action could not be evaluated. More complete investigations are required to
quantify the endurance of treated surfaces [18]. One should consider this fast procedure a first and
limited approach which can be completed by more exhaustive but also more expensive
investigations.
It has been shown in the previous investigation that nitriding treatment displays a rather good
performance against fretting wear in gross slip regime and excellent resistance against cracking
activated by stabilized partial slip loadings. However in numerous industrial applications, due to
unstable or irregular dynamic behaviour, both partial and gross slip sliding are being encountered.
It is therefore fundamental to find out the performance of the surface treatment under combined
partial and gross slip sliding conditions. In a first attempt to achieve this objective, an original
methodology has been developed which consists in applying consecutively gross and partial slip
sliding in the same fretting scars. The purpose of the research was to check if the primary gross slip
slidings can suppress or prevent crack nucleation in the contact zone of the reference material after
different treatments under stabilized partial slip loadings. The following procedure has been
defined. First a fixed number 25000 cycles at a fixed amplitude from the gross slip regime
(±100 µm) has been applied. During this initial sequence a significant wear of the contact surface is
being observed, which critically modifies the stress distribution. In order to set out the Hertzian
partial slip conditions, the new intact cylinder surface has been placed exactly at the same position
of the gross slip fretting scar. Then 250 000 partial slip fretting cycles have been applied. Finally,
after completion of each the fretting test, the worn surfaces have been submitted to microscope
inspection in order to quantify the crack extension.
fretting cycles d is p la c e m e n t a m p lit u d e
initial gross slip sequence (± 100µm, 25000 cycles)
replacement of the worn cylinder counterface
partial slip sequence (* <t, 250000 cycles)
(a)
ta n g e n ti a l fo rc e displa cement fre tting cyc les ta n g e n ti a l fo rc e displa cement fre tting cyc les(b)
fretting cycles d is p la c e m e n t a m p lit u d einitial gross slip sequence (± 100µm, 25000 cycles)
replacement of the worn cylinder counterface
partial slip sequence (* <t, 250000 cycles)
[image:17.481.53.443.397.581.2](a)
ta n g e n ti a l fo rc e displa cement fre tting cyc les ta n g e n ti a l fo rc e displa cement fre tting cyc les(b)
Figure 12 : Illustration of the combined gross/partial slip loading sequence: (a) a scheme and basic
A scheme of the whole fretting test and of the relevant fretting log of the sequence of the
applied loadings are given in Figure 12. Surface profiles of fretting scars have been conduced at the
end of gross slip sequence (Fig. 13a). The greater resistance to wear of the nitrided surface is
clearly visible. One can see also that the wear depth extension is significantly lower than thickness
of the treated surface (the latter is approximately equal to 200 µm and 400 µm for the shot peening
or nitriding treatment, respectively).
Figure 13b clearly present that the application of a rather small number of the gross slip
sequence critically decreases the resistance to cracking immanent for both the treatments under
investigation. Indeed, the results after the treatments overlap these obtained for the untreated
reference steel. A likely explanation of this result is that the primary gross slip slidings, due to a
lower friction at the interface, decrease the transition sliding amplitude and, in consequence, the
interval of the tangential force amplitude of the partial slip. Another important finding from Figure
13b is that both the shot peening and nitriding treatments have similar crack nucleation threshold
and crack propagation rate as the reference steel. Considering the previous remark concerning the
limited wear depth extension, the loss of the resistance to cracking can only be explained by an
overall relaxation of the initial compressive residual stress generated by the treatments under
investigation.
-50 -40 -30 -20 -10
-2000 -1000 0 1000 2000
shot peening nitriding
(a)
wear depth (µm)
lateral position (µm)
tangential force amplitude Q* (N)
m
a
x
im
u
m
c
ra
c
k
le
n
g
th
lma
x
(µ
m
)
0 50 100 150 200
800 1000 1200 1400 1600 1800
plain steel (PS loading)
shot peening
nitriding
(b)
[image:18.481.52.438.385.534.2](combined GS/PS loading)
Figure 13 : (a) comparison of the wear scar profiles after fretting test under gross slip regime; (b) evolution
of the maximum crack length of the different surface treatments submitted to the combined GS/PS fretting
Contrary to the partial slip conditions, severe gross slip ones promote extended plastic strain
upon and below the contact interface. Such plastic deformation seems to fully remove the
compressive residual stresses produced by the surface treatment. This is the reason, that during
subsequent fretting in the partial slip regime, the cracking response is the same as that for the
untreated plain steel. This combined partial/gross slip analysis proves that an incipient short period
of gross slip sliding critically declines the resistance of the reference steel against fretting cracking
achieved due to palliative surface treatments. It also demonstrates the fundamental interest of
combined gross/partial slip sequence approaches to validate a fretting cracking palliative strategy.
4. Synthesis and conclusions
Different parameters defined from this simplified fretting damage methodology set forth in the
foregoing sections have been compiled in Table 2. It permits a quantitative comparison of different
aspects associated with fretting damage such as friction behaviour under partial and gross slip
conditions, the wear under gross slip regime, crack nucleation and propagation at stabilized partial
slip conditions and finally the cracking response for combined gross and partial slip conditions.
To provide a synthetic illustration of the performance of different palliative treatments, an
optimized fretting damage chart is introduced. The pertinent performances are normalized versus
the reference system in such a way that the calculated ratio is below one if the treatment is
beneficial or above 1 if it is detrimental.
The following variables are considered:
Fretting tribological properties:
Error! Objects cannot be created from editing field codes., Error! Objects cannot be
created from editing field codes., Error! Objects cannot be created from editing field
codes.,Error! Objects cannot be created from editing field codes.
Error! Objects cannot be created from editing field codes., Error! Objects cannot be
created from editing field codes., Error! Objects cannot be created from editing field
codes.
Fretting cracking properties under stabilized partial slip conditions (250000 cycles):
Nucleation : ) ref ( Q Q Q th th
th , Propagation :
) ref ( l l l MAX MAX MAX
Fretting cracking properties under combined gross slip sequence (±100µm during 25000 cycles)
followed by partial slip conditions (250000 fretting cycles):
Nucleation :
)
ref
(
Q
Q
Q
th * th * th *
, Propagation :
[image:20.481.52.440.242.465.2])
ref
(
l
l
l
MAX * MAX * MAX *
GS t Q t t th Q MAX l TOTAL K Wear properties (stabilized GS loading) Friction properties Q(N) (µm) Q(N) Q(N) (µm) Cracking properties (stabilized PS loading) lmax Cracking properties (stabilized PS loading) lmax 52100 K TREAT. K 0 1 2 0 1 2 lmax lmax MAX * l th * Q Combined GS/PS fretting loading (a) GS t Q t t th Q MAX l TOTAL K 52100 K TREAT. K 0 1 2 0 1 2 MAX * l th * Q (b) Wear properties (stabilized GS loading) Friction properties Q(N) (µm) Q(N) Q(N) (µm) Cracking properties (stabilized PS loading) lmax Cracking properties (stabilized PS loading) lmax lmax lmax Combined GS/PS fretting loadingFigure 14 : Normalized polar charts for two different fretting palliative treatments (reference fretting
system : 30NiCrMo8/52100 contact) (a) shot peening treatment, (b) nitriding.
Different plots are at the disposal, however the polar charts, first adapted for fretting analysis by
Carton and co-authors [19] appear the user-friendly. It is here extended and normalised to compare
the responses of the surface treatments under investigation (Fig.14). A rapid overview shows that
the peening treatment does not modify the friction behaviour, does not change the crack nucleation
response but increases the resistance to crack propagation under stabilized partial slip conditions. It
untreated (cylinder) surfaces. Finally the nitriding treatment characterized by lower friction
behaviour, displays a very good resistance to crack nucleation and their propagation under
stabilized partial slip conditions and brings about presents lower wear kinetics (in fact, the decrease
of wear of the pertinent fretting couple is in the most part attributed to the 52100 counterbody).
Concerning the resistance to crack nucleation under combined Gross Slip/Partial Slip (i.e.
GS/PS) conditions the analysis clearly shows the decline of the benefit effect of the treatments
under investigation. The compressive residual stresses appear to be fully erased and the cracking
behaviour after the both surface treatments becomes to that of the untreated reference steel.
It has been shown in the work that having an optimized palliative strategy most of the fretting
damage responses can be quantified through a limited number of tests. It has been indicated also
that synergic damage phenomena can operate during combined partial and gross slip slidings. This
research has been conducted for plain contact loading without introducing external stressing. In
fact, numerous industrial assemblies are subjected to combined fretting fatigue loading. Therefore
the present results can not be directly extrapolated to such situations. It should be pointed out that
these results must be carefully interpreted and specific precautions must be taken before extending
[image:21.481.51.442.408.634.2]them to any different loading mode.
Table 2 : Compilation of fretting wear coefficients reckoned from the fast fretting methodology under
partial, gross and combined gross/partial slip conditions.
Surface treatments plain steel shot peening nitriding
Friction behaviour
t(GS/PS) - 0.81 0.83 0.68
(GS) - 0.76 0.77 0.58
Qt N 1615 1669 1362
t m 16.4 15.6 15.9
Archard wear coefficient K under gross slip conditions
Kplan m³/Nm 8482 11689 7722
Kcylinder m³/Nm 9650 4943 2042
Ktotal m³/Nm 18132 16632 9764
Fretting cracking under partial slip loading sequence
~0.9*Qt N 1480 1490 1220
lMAX m 102.83 46.49 no crack
Fretting cracking under combined gross/partial slip loading sequence
Q*th N - 1090 1090
~0.9*Qt N - 1490 1220
lMAX m - 121.59 42.64
To sum up this fretting palliative selection method appears to be a convenient way to compare
various surface treatments. It offers a well based selection strategy when a wide range of surface
treatments is potentially interesting. However it cannot replace a complete investigation required
for a definite validation of an industrial implementation. These two different approaches are not
competitive but fully complementary: the fast methodology can be conducted as a first means for
choice among a wide range of possible palliative surface treatments, whereas classical fretting map
analysis must be performed to validate a choice through a restricted number of solutions.
References
[1] Hoeppner D. "Mechanisms of fretting fatigue and their impact on test methods
development", ASTM STP 1159, 1992, 23-32.
[2] Waterhouse R.B., "Fretting Fatigue", R.B. Waterhouse (Ed.), Applied Science, London,
1981.
[3] Vingsbo O., Soderberg. S. "On Fretting Maps" Wear 126, 1988, 131-147.
[4] Vincent L. "Materials and Fretting", Fretting Fatigue, ESIS 18, 1994, 323-337.
[5] Araujo J. A., Nowell D., “The effect of rapidly varying contact stress fields on fretting
fatigue”, International Journal of Fatigue, 24, 2002, 763-775.
[6] Vallellano C., Dominguez J., Navarro A., “On the estimation of fatigue failure under fretting
conditions using notch methodologies”, Fatigue Fract. Eng., M26 (5), 2003, 469-478.
[7] S. Fouvry, K. Elleuch, G. Simeon, “ Prediction of crack initiation under partial slip fretting
[8] Mohrbacher H., Blanpain B., Celis J.P., Roos J.R., “ Oxidational wear of TiN coating on
tool steel and nitrided tool steel in unlubricated fretting”, Wear, 180, 1995, 43-52.
[9] Fouvry S., Kapsa Ph., Vincent L., “Quantification of fretting damage“, Wear 200, 1996,
186-205.
[10] Fouvry S., Duo P., Perruchaut Ph. “A quantitative approach of Ti-6Al-4V fretting damage:
Friction, Wear and crack nucleation “, Wear, 2004, in press.
[11] Voisin J. M., Vannes A. B., Vincent L., Daviot J., Giraud B., "Analysis of a tube-grid
oscillatory contact: methodology for the selection of superficial treatments", Wear, 181-183,
1995, 826-832.
[12] Proudhon H., Fouvry S., Buffière J.Y., “A fretting crack initiation analysis taking into
account the surface roughness and the crack nucleation process volume”, International
Journal of Fatigue, in press.
[13] Fridrici V., Fouvry S., Kapsa Ph., Perruchaut Ph. "Impact of contact size and geometry on
the lifetime of a solid lubricant ", Wear 255, 2003, 875-882.
[14] Zhou Z R, Vincent L. "Lubrification in Fretting a review", Wear 225-229, 1999, 962-967.
[15] Archard J., "Contact and rubbing of flat surfaces", Appl. Phys., 24, 1953, 981-988.
[16] Fouvry S., Liskiewicz T., Kapsa Ph., Hannel S., Sauger S., " An energy description of wear
mechanisms and its applications to oscillating sliding contacts", Wear 255, 2003, 287-298.
[17] Sauger E., Fouvry S., Ponsonnet L., Martin J.M., Kapsa Ph., Vincent L., “Tribologically
Transformed Structure in Fretting”, Wear 245, 2000, 39-52.
[18] Liskiewicz T., Fouvry S., "Development of a friction energy capacity approach to predict the
surface coating endurance under complex oscillating sliding conditions", Tribology
International 38, 2005, 69–79.
[19] Carton J.F., Vannes A. B., Vincent L., "Basis of a coating choice methodology in fretting",