Techniques: Methodology and Summary..
White Rose Research Online URL for this paper: http://eprints.whiterose.ac.uk/2126/
Monograph:
Clark, S.D., May, A.D. and Montgomery, F.O. (1995) Priority Management for Urban Arterials. Transferability of Techniques: Methodology and Summary. Working Paper. Institute of Transport Studies, University of Leeds , Leeds, UK.
Working Paper 460
Reuse
See Attached
Takedown
If you consider content in White Rose Research Online to be in breach of UK law, please notify us by
White Rose Research Online
http://eprints.whiterose.ac.uk/Institute of Transport Studies
University of Leeds
This is an ITS Working Paper produced and published by the University of Leeds. ITS Working Papers are intended to provide information and encourage discussion on a topic in advance of formal publication. They represent only the views of the authors, and do not necessarily reflect the views or approval of the sponsors.
White Rose Repository URL for this paper: http://eprints.whiterose.ac.uk/2126
Published paper
S.D. Clark, A.D. May, F.O. Montgomery (1995) Priority Management for Urban Arterials. Transferability of Techniques: Methodology and Summary. Institute of Transport Studies, University of Leeds, Working Paper 460
Institute for Transport Studies
ITS Working Paper 460
ISSN 0142-8942December 1995
PRIORITY MANAGEMENT FOR URBAN ARTERIALS
TRANSFERABILITY OF TECHNIQUES
METHODOLOGY AND SUMMARY
S.D. Clark
A.D. May
F.O. Montgomery
This work was undertaken on a project sponsored by the Engineering and Physical Sciences esearch Council (Grant Ref: GR/J09390)
R
CONTENTS
ABSTRACT... 1
1 INTRODUCTION ... 1
2 CHARACTERISTICS OF URBAN ARTERIALS... 2
2.1 PHYSICAL ... 2
2.2 TRAFFIC ... 2
2.3 ENVIRONMENTAL ... 3
3 MEASURES... 3
3.1 CONGESTION MANAGEMENT ... 3
3.2 PUBLIC TRANSPORT PRIORITY... 4
3.3 TRAFFIC CALMING... 5
3.4 CIRCUMSTANCES APPROPRIATE TO EACH MEASURE ... 5
4 EVALUATION TOOLS ... 6
5 EVALUATION METHODOLOGY ... 8
5.1 COST BENEFIT ANALYSIS ... 8
5.2 MULTI-CRITERIA ANALYSIS... 9
6 NEED FOR HYPOTHETICAL NETWORKS ... 11
7 SUMMARY OF RESULTS ACROSS REAL ARTERIALS ... 11
8 CONCLUSIONS ... 16
REFERENCES... 17
APPENDIX 1: EXAMPLE OF OUTPUT EVALUATION DATA ... 19
ABSTRACT
This paper describes the background and methodology employed in research funded by EPSRC to assess the effect of individual traffic control measures on urban arterials, both in isolation and in combination. The aim of the project was to test the transferability of the techniques developed in a DRIVE II project, PRIMAVERA, to a range of different types of urban corridor. Measures have been classed into three broad categories: Congestion Management, Public Transport Priority and Traffic Calming. The scope of these measures is wide, some operating at a junction level whilst others have an impact over a whole corridor.
Measures from these categories are applied in a sophisticated microsimulation model of a series of hypothetical networks and four urban arterial corridors: three in Leeds and one in Leicester. The effects of the application of individual and integrated measures are assessed in terms of their efficiency, environmental and safety impacts using a form of Multi-Criteria Analysis. Travel time and other monetary costs are also taken into consideration.
Whilst these results are of interest to local planners in the operation of each of the arterial corridors studied, a wider insight into the operation of urban arterials can be drawn from this study leading to more efficient control of the available road space.
1 INTRODUCTION
The efficient and equitable control of traffic is an increasingly complex problem as traffic volumes continue to rise. All user groups (car drivers, bus passengers, cyclists, pedestrians, residents) are in competition for the use of the limited available road space. Individual measures to control or enhance one aspect of this use can be disadvantageous to one or other of the remaining groups. The adoption of a package of measures may ensure a fairer distribution of these road priorities. Given the large number of potentially useful measures available, the combined use of individual measures needs to be carefully assessed.
This paper describes the background and methodology employed in research funded by EPSRC to assess the effect of individual traffic control measures, both in isolation and in combination upon urban arterials. The aim of the project was to test the transferability of the techniques developed in a similar project to a range of different types of urban corridor. Measures have been classed into three broad categories: Congestion Management, Public Transport Priority and Traffic Calming. The scope of these measures is wide, some operating at a junction level whilst others have an impact over a whole corridor.
PRIMAVERA to other UK urban arterial corridors. The scope of this study was to be somewhat different from that of PRIMAVERA. One important difference was the relaxation of the EU's emphasis on Transport Telematics, providing the study with a greater degree of flexibility in the range of measures to consider, in particular civil engineering measures. Another consideration was that this study did not possess the resources to implement on-street field trials of the optimum combination of measures. This did not, however, remove the requirement that each measure should be capable of on-street application.
2
CHARACTERISTICS OF URBAN ARTERIALS
Each of the following sections describes some of the more common characteristics that may be associated with an urban arterial. It should, however, be borne in mind that not all arterials will possess all these characteristics; indeed it is the variety of such characteristics which arterials possess which raises the need for this study. The following characteristics are perhaps closest to the UK situation and the characteristics in other countries may be somewhat different.
2.1 PHYSICAL
As mentioned in the case for support for this project (Montgomery and May, 1993), the single best definition for an arterial road is one that links the interurban road network to a city centre. In most cases the use of urban arterials has evolved over time rather than being planned as such from the start. This can be seen where, due to constraints on land use, such roads may for part of their length be reduced in width from two or three lanes in any one direction, to one or two. This narrowing may produce a bottleneck during periods of high traffic flow with the knock-on effect of upstream congestion. Measures are usually taken to maintain the capacity of such roads, with on street car parking being discouraged (urban clearways) or accommodated in parking laybys near shops. Arterials can also have a large number of side streets with relatively low flows although there may occasionally be a large cross flow or dog-leg flow at some junctions along the arterial.
2.2 TRAFFIC
Urban arterials are characterised by high volume traffic flows, with particularly strong peaks in the inbound morning peak and outbound evening peak. The existence of these traffic volumes means that arterials tend to be highly controlled, using either traffic signals or roundabouts. Whilst the majority of traffic is radial, strong orbital and turning movements can add to the difficulties of managing the corridor, particularly where the orbital routes are not continuous.
The existence of side streets can cause a number of problems. Firstly drivers may be tempted to use the side street network to avoid known regular or occasional problems on the arterial, so-called rat-running. This can be a particular source of accidents. Another problem is that the high flow on the arterial may mean that side street traffic has little opportunity to join the arterial, thereby causing delay on these side streets.
2.3 ENVIRONMENTAL
Arterials tend to pass through a mixture of different land uses. Towards the outer edge this may be low density residential areas or light industry. As the arterial gets closer to the city centre then the housing tends to become denser with an increase in shop frontage. Various institutions, such as schools and hospitals, also tend to be located in these areas. These, along with shops, may generate significant volumes of pedestrian traffic. Closest to the centre such roads may revert back to light industry or retailing units but may still retain some residential component.
3
MEASURES
This section gives a short description of each of the candidate measures considered for each of the study urban arterials. The measures fall into the three established categories of Congestion Management, Public Transport Priority and Traffic Calming. The majority of these measures are taken from Deliverable 9 of the PRIMAVERA project (Clark et al, 1995). A more detailed description with some accompanying information on how these measures were implemented in the microsimulation tool can be found in Clark et al (1996).
3.1 CONGESTION MANAGEMENT
CM1 Maximise Signalised Junction Capacity. Such measures are clearly appropriate at all significant and, especially, critical junctions, these being defined as those having the highest degree of saturation. The following measures may be considered:
Extra lanes;
Dedicated lane markings; Ban unimportant turns;
Restrictions on pedestrian phases1;
Movement of bus stops from upstream to downstream of the junction (although passenger re-assignment can not be directly measured in the microsimulation).
CM2 Restrict Turning into Congested Arterial. This restriction can be applied by regulation (turn bans) or by reducing the green time to such turns at signalised junctions. This measure may reduce (or relocate) rat-running.
CM3 Separate Stage for Turning Traffic. If dedicated turning lanes are provided as part of measure CM1 then consideration should also be given to providing a separate stage for this turning traffic. This will clearly be appropriate in those cases where there is both a heavy turning volume and a heavy volume of traffic conflicting with this movement.
1 The capacity of a junction can be increased whilst still maintaining pedestrian provision. For example in a junction which has an all-around pedestrian stage the construction of a central pedestrian refuge may enable the elimination of this stage, thereby freeing seconds of cycle time for vehicle green.
capacity on a link to reduce the extent of the queue.
CM5 Starting and Stopping Wave Coordination. By coordinating the offsets between junctions a starting wave may be timed to enable the upstream main feed traffic to flow into the back of a moving queue.
CM6 Double Cycle Times. Where a regional cycle time approach has been adopted provision exists for non-critical junctions to be operated on half the cycle time of a critical junction. Thus capacity can be maintained at the critical junction whilst minimising pedestrian delay at other junctions and maintaining offset coordination.
CM7 Flared Green Times in Network. This measure would be appropriate where progression on an arterial was not the only consideration. Flaring involves the gradual increase or decrease in the duration of the green stages at signalised intersections along a route. The green time on cross streets would be flared in the direction of greatest flow. Some appropriate control of the offsets on the arterials and cross streets may be necessary. (see Rathi, 1988)
CM8 Auto-Metering (or Auto-Gating). These measures attempt to control the distribution of traffic along the arterial by making adjustments to the green time allocated to the main stage at a junction. This may simply involve external metering where traffic is held at the approach to the arterial and released in a controlled manner. Variants include using an internal link for queue storage or distributing a queue amongst a number of links. (see Papageorgiou, 1989)
CM9 Shorter Cycle Times for Congestion Recovery. Shorter cycle times should begin to be used when the demand on the arterial begins to fall.
3.2 PUBLIC TRANSPORT PRIORITY
PP1 Bus Stop Relocation. The siting of bus stops close to a junction can have detrimental effects on the efficiency of the junction. This issue can be addressed in conjunction with CM1.
PP2 Increase Bus Stop Spacing. A reduced number of bus stops can reduce the travel time for buses (reduced decelerating and stopping time) and other vehicles (fewer potential bottlenecks caused by buses at stops).
PP3 Create Laybys. Laybys reduce the disruption caused to other road vehicles by buses waiting at a bus stop for passengers to board or alight.
PP4 Bus Lanes. These lanes can be with the flow of other traffic, counter to this flow or tidal.
PP5 Bus Lane Setback. The use of a bus lane setback from a junction enables the capacity of the junction to be maintained whilst still providing priority to buses.
PP7 Co-ordinate Signals for Buses. This involves the calculation of offsets between junctions which are more likely to provide a green wave for buses. This usually requires a longer offset between adjacent junctions to reflect the longer travel times for buses.
PP8 Reduce Time Spent at Bus Stops. A reduction in the amount of time spent at bus stops can decrease the journey time for both buses and other road traffic. The reduction in time may come from a move towards greater use of pre-paid ticket types.
PP9 Form Bus Convoys. Where it is possible to build a convoy of buses that serve different locations, the convoys can be moved along the corridor in a coordinated manner.
3.3 TRAFFIC CALMING
TC1 Cushions at Pedestrian Crossing Points. A raised, central portion of the carriageway would have the combined effect of slowing road traffic, emphasising the rights of pedestrians and allowing buses easy passage.
TC2 Signalised Pedestrian Crossings. The use of such crossings allows for the better coordination of vehicle and pedestrian traffic.
TC3 Medians. Medians are already a common feature on urban arterial roads. Their main aim is to separate the opposing traffic flows for safety reasons, but side effects are the prevention of both U-turns and right turns into some side streets and assistance to pedestrians crossing.
TC4 Linked Traffic Signals. Here the offsets between signalised junctions are set to try to enforce a lower progression speed along a link. Research has suggested that a reduction in the degree of injury to pedestrians can be gained from reduced impact speeds.
TC5 Preventing Rat-runs off the Arterial. Measures are needed to discourage this type of behaviour. Measures can be taken to discourage turning off from the arterial (by the use of entry ramps) or the attractiveness of such routes can be reduced (by road humps or chicanes).
TC6 Platoon Formation. This involves the use of traffic signals to create platoons of traffic with sufficient gaps between them so as to allow pedestrians to cross the road safely in these gaps.
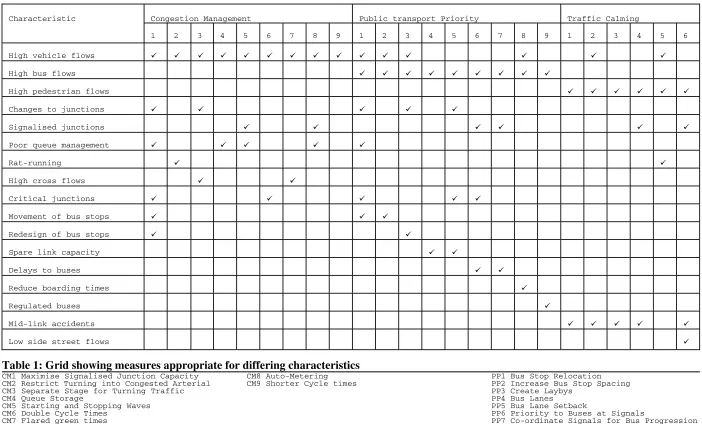
3.4 CIRCUMSTANCES APPROPRIATE TO EACH MEASURE
In order to apply the measures discussed above, certain circumstances should exist on the arterial. Table 1 suggests those characteristics appropriate for each measure.
4
EVALUATION TOOLS
individually and in combination, in a computer model of the arterial.
When arranging the selection meeting, due consideration was given to whom to invite. Individuals from the highways authority, urban traffic control team and those responsible for public transport provision were essential. Other possible participants could be local politicians, community representatives and academics. Due regard was paid to the fact that these are usually busy people who may not be able to spare much time for the meeting or its preparation. This selection stage was a complex operation, due to the large number of candidate measures, so in order to reduce the effort each measure was considered in isolation. As the discussion progressed however, frequent reference back to other measures discussed previously was often made, which indicates how measures could complement or conflict with each other.
The simulation stage involved the construction and calibration of a microsimulation model using NEMIS (Mauro and Di Tarranto, 1989) of the appropriate arterial. The most expensive item of data in these microsimulation models is the origin-destination (OD) matrix. For the purposes of this study no directly observed OD matrices were used. Instead a historically observed sample OD matrix was updated by an appropriate computer package (either SATURN (W S Atkins), or TRIPS (MVA)) using link flow information. The base data was calibrated against existing flow and travel time data.
The measures for evaluation are coded into the program code of the microsimulation model. Each candidate measure was simulated individually and then in combination with other measures. The procedure adopted was to run the simulation, from empty, for ½ hour to allow traffic to accumulate in the network. The simulation was then restarted and run for a 1 hour period during which data was collected for evaluation purposes. This evaluation data comprised the following impacts:
̈ Mean network speed (m/s); ̈ Total network travel time (s);
̈ Total link standard deviation of travel time (s); ̈ Total network delay (s);
̈ Total network stops (vehicles); ̈ Total link outflows (vehicles); ̈ Total bus travel time (s); ̈ Total bus link outflows (buses);
̈ Total standard deviation of bus link travel time (s); ̈ Total duration of junction spill-back (s);
̈ Link occupancy (sum of proportions); ̈ Total network fuel consumption (l); ̈ Total network NOx emissions (g); ̈ Total network HC emissions (g); ̈ Total network CO emissions (g);
To capture some of the variability in which these measures would need to function, each simulation run was replicated four times, with differing random number seeds. These seeds controlled such behaviour as generation headway at the inputs to the network, individual vehicle turning movements and characteristics of bus journeys (eg time spent at stops).
5
EVALUATION METHODOLOGY
The information produced by the microsimulation package enabled two evaluations to be carried out, namely a form of cost benefit analysis and a form of multi-criteria analysis.
5.1 COST BENEFIT ANALYSIS
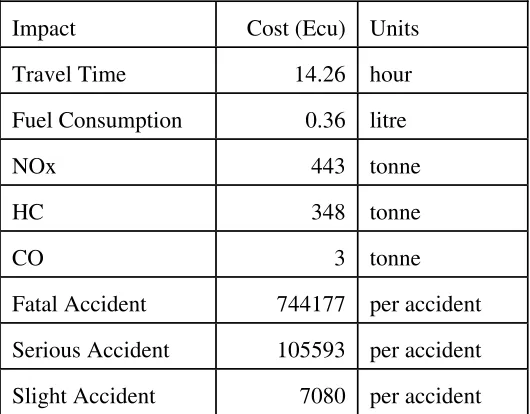
Although the term cost benefit is used here it is not strictly appropriate in the context of this study. In the study only the user costs of the measure are considered; the infrastructure and implementation costs are ignored. Examples of user costs are cost of in-vehicle time and cost of fuel consumed. Infrastructure costs include the cost of loop cutting and installation of specialist on-street systems which a measure may require. The justification for the use of this term is that the costable impacts have been converted into monetary units, thereby enabling a total figure for the cost of the measure's operation to be ascertained. A comparison of costs can then be used to rank the performance of each measure assuming, implicitly, that the infrastructure costs are similar. The costs associated with each impact are given in table 2.
Impact Cost (Ecu) Units
Travel Time 14.26 hour
Fuel Consumption 0.36 litre
NOx 443 tonne
HC 348 tonne
CO 3 tonne
Fatal Accident 744177 per accident
Serious Accident 105593 per accident
[image:11.595.72.337.339.546.2]Slight Accident 7080 per accident
Table 2: Impact costs (Ecus)
These cost are equivalent to those used in PRIMAVERA, which were in turn taken from a number of sources. The primary sources are the DRIVE I EVA manual (fuel consumption and pollutant costs) and COBA9 recommendations (travel time and accidents). The exchange rate used is 1 Ecu = £0.70.
In addition, information on average car and bus occupancies is required in order to convert from vehicle travel time to person travel time. The car occupancy was fixed at 1.4 persons and the bus occupancy varied from site to site but was typically between 20 and 45 persons.
network, corresponding to the situation where every vehicle in the network makes its journey with zero delay. There will also be a corresponding maximum operation cost which corresponds to the situation where the network is in complete grid-lock at the start of the simulation hour and no vehicles can move. It is likely that the microsimulation will be operating nearer the lower bound cost, making a decrease in costs harder to achieve than an increase. This feature also suggests that the distribution of costs, will be near the lower bound and may give rise to a negatively skewed distribution of costs. Notwithstanding this, the assumption of near normality is approximate.
The costs from individual simulations for a measure can be ranked across measures to establish whether the relative performance of a measure is consistent or affected by the choice of random number seeds.
Another technique to extract information from the simulation results is to regress the average cost figure for each simulation against a series of indicator variables. These variables are set to either one or zero, depending on whether the measure was involved in the simulation. Thus the cost increase or decrease implications of each individual measure can be obtained from the parameter estimate associated with the measure. A significant parameter estimate suggests that the effect of the measure is consistent, both in isolation and in combination with other measures. If more than one of the parameter estimates are negative then this suggests that a maximum reduction in costs can be obtained from applying, if possible, all those measures in one simulation.
5.2 MULTI-CRITERIA ANALYSIS
Many subtly different types of multi-criteria analysis exist. The approach adopted for this project allows comparison not only between the effect of measures within the same time period but also across time periods. Firstly a target percent reduction over a base situation (existing on-street implementation or use of a TRANSYT signal plan (Vincent, 1980)) is specified. This becomes the target. Next the actual recorded reduction is calculated and expressed as a proportion of the target. Weights are then applied to ensure that the sum of the achievements over all impacts within each of Efficiency, Environment and Safety groups is one. Algebraically this is expressed as:
⎥ ⎦ ⎤ ⎢ ⎣ ⎡
∑
T A W = Score Group
i i i n
=1 i
Where Wi is the Weight associated with impact I;
Ai is the Actual reduction in impact I;
Ti is the Target reduction in impact I.
The interpretation which can be placed on this figure is:
A score of less than 0 is failing to improve the situation; A score of 0 is no overall change in the situation; A score of +1 is meeting the overall target;
A score of more than +1 is exceeding the overall target.
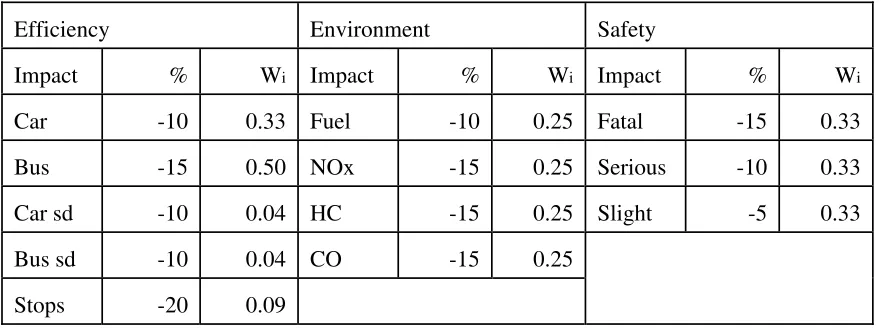
The values for the target percentage reduction and the weights are given in table 3.
Efficiency Environment Safety
Impact % Wi Impact % Wi Impact % Wi
Car -10 0.33 Fuel -10 0.25 Fatal -15 0.33
Bus -15 0.50 NOx -15 0.25 Serious -10 0.33
Car sd -10 0.04 HC -15 0.25 Slight -5 0.33
Bus sd -10 0.04 CO -15 0.25
[image:13.595.71.514.124.288.2]Stops -20 0.09
Table 3: Target % impact reductions and weights
A number of assumptions were made in order to establish this set of consistent weights:
• The ratio of importance between car and bus vehicle journey time reductions is 2:3; • The co-efficient of variation of journey times for cars is 0.25 and 0.5 for buses;
• The ratio between the value of a reduction in journey time and a reduction in journey time variability is 2:1;
• There is, on average, one stop per 60 seconds of travel time; • The environmental targets are equally desirable;
• The magnitudes of the accident reduction targets are equally desirable.
A useful format to display the results of the multi-criteria analysis is in a 3D scatter plot with the quantity's score in each of the impact groups along each of the axes. Using this method, groups of measures with similar effects can be identified, as can outliers. Appendix 1 provides a set of results and appendix 2 a scatter plot of results for illustrative purposes.
In a similar manner to the ranking of cost measures, the efficiency, environment and safety scores can be ranked across measures to identify any inconsistencies due to the choice of random number seeds.
6
NEED FOR HYPOTHETICAL NETWORKS
Four real-world arterials were selected for use within the study. Three came from Leeds, (Otley Road with Kirkstall Road and York / Selby Road) and one from Leicester (Humberstone / Uppingham Road). The three arterials for Leeds were chosen from a potential short list of six arterials after consultation with Leeds City Council. The Humberstone / Uppingham Road arterial was chosen because it had recently been enhanced by Leicestershire County Council with bus priority and traffic calming schemes. The authority was interested in how further traffic management measures could be applied to this corridor.
designed. Each hypothetical network was constructed from one each of the following attributes, each of which has two levels:
Junction spacing : Closer towards the city end of the arterial Closer in the middle of the arterial
Reduced capacity : Reduction towards the city end of the arterial Reduction in the middle of the arterial
Alternate routing : An attractive alternative to the arterial Less attractive alternative to the arterial
Bus flows : High flows on the arterial Medium flows on the arterial
Routing patterns : Strong arterial flows Diffuse arterial flows
A more detailed description of the form of the hypothetical arterials can be found in Clark et al (1995d).
7
SUMMARY OF RESULTS ACROSS REAL ARTERIALS
Detailed results for each of the three real-world arterials used in this study can be found in Clark et al (1995a, 1995b, 1995c). The results from the analysis of the hypothetical corridors are not presented here but can be found in Clark et al (1995d). The following tables summarise the changes in various measures observed by the application of individual and combined measures. Each cell consists of three rows. The top row shows results from the Humberstone / Uppingham Road (A47), the middle row shows results from the Otley / Kirkstall Road network (A660) whilst the lower row shows results from the York / Selby Road network (A64). The top right-hand side of each table gives the results from the am peak period whilst those in the lower left-hand side are the results from the pm peak period, except for the York / Selby Road, where it is the inter peak period. A X indicates an improvement (reduced cost or positive score), whilst an x indicates a worsening (a greater cost or negative score) over an appropriate base case.
COST BENEFIT PM G SSW DC SVD TS CB BP PC SC
Individual AM
A47 A660 A64
x xx
xx
X
X
X XX X
X X XX
x
X
X XX
xxx
XXX
x
x
X
Gating xxx x
x
xxx
Starting and Stopping Waves
x
xxx x
x xxx
Cycling X xx
Selective Vehicle Detection
X
x x
x x
x
X
X xxx x x
Reduced Dwell time at Stop
X X XX
X
x
X
X XX
XX
XXX
Coordination for Buses
X
x
x x
X
X XXX
Bus / Pelican
Combination X X
XXX
Physical Calming
xxx xx
X
xxx xxx
x
xxx xx
Signal Calming
xx xx xx
Table 4: Summary of Cost Benefit Results across all real world arterials
Key:
x 0-2% Increase X 0-2% Decrease
xx 2-4% Increase XX 2-4% Decrease
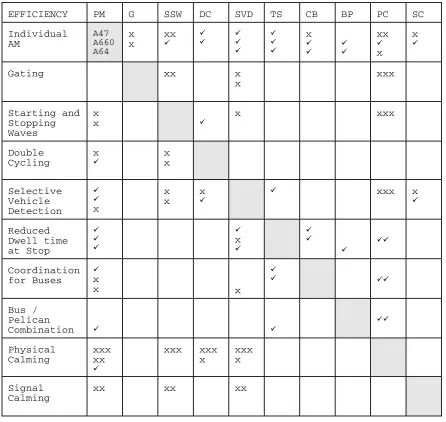
EFFICIENCY PM G SSW DC SVD TS CB BP PC SC Individual AM A47 A660 A64 x x xx X X
X XX X X X X x X
X XX
xx
X
x
x
X
Gating xx x
x xxx Starting and Stopping Waves x
x X
x xxx
Double Cycling x X x x Selective Vehicle Detection X X x x x x X
X xxx x
X Reduced Dwell time at Stop X X X X x X X X X XX Coordination for Buses X x
x x
X
X XX
Bus / Pelican
Combination X X
XX Physical Calming xxx xx X
xxx xxx
x
xxx x
Signal Calming
[image:16.595.70.516.106.528.2]xx xx xx
Table 5: Summary of efficiency results across all real world arterials
Key:
x 0.0 to -0.5 X 0.0 to 0.5
xx -0.5 to -1.0 XX 0.5 to 1.0
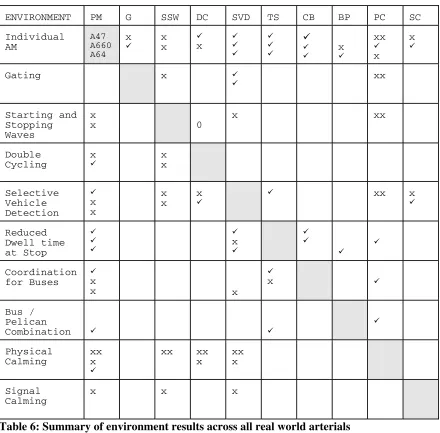
ENVIRONMENT PM G SSW DC SVD TS CB BP PC SC Individual AM A47 A660 A64 x X x x X x X X X X X X X X X x X xx X x x X
Gating x X
X xx
Starting and Stopping Waves
x
x 0
x xx
Double Cycling
x
X x x
Selective Vehicle Detection X x x x x x X
X xx x
X Reduced Dwell time at Stop X X X X x X X X X X Coordination for Buses X x
x x
X
x X
Bus / Pelican
Combination X X
X Physical Calming xx x X
xx xx
x
xx x
Signal Calming
[image:17.595.73.513.103.536.2]x x x
Table 6: Summary of environment results across all real world arterials
Key:
x 0.0 to -0.5 X 0.0 to 0.5
xx -0.5 to -1.0 XX 0.5 to 1.0
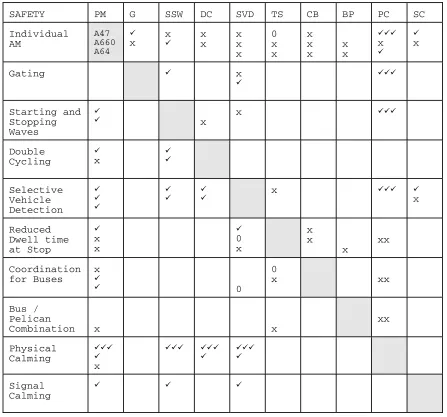
SAFETY PM G SSW DC SVD TS CB BP PC SC Individual AM A47 A660 A64 X x x X x x x x x 0 x x x x x x x XXX x X X x
Gating X x
X XXX Starting and Stopping Waves X
X x x XXX
Double Cycling X x X X Selective Vehicle Detection X X X X
X XX x XXX Xx
Reduced Dwell time at Stop X x x X 0 x x x x xx Coordination for Buses x X X 0 0
x xx
Bus / Pelican
Combination x x
xx Physical Calming XXX X x XXX XXX
X XXXX
Signal Calming
[image:18.595.69.516.106.523.2]X X X
Table 7: Summary of safety results across all real world arterials
Key:
x 0.0 to -0.5 X 0.0 to 0.5
xx -0.5 to -1.0 XX 0.5 to 1.0
8 CONCLUSIONS
For the hypothetical corridors, the bus priority measures performed well in their impact on user cost, while the calming measures and, surprisingly, the queue management measures performed badly. Their performance was, as expected, dependent on the characteristics of the corridor, but less sensitive to the level of bus demand or the overall distribution of demand. Bus priority measures were at their most effective in corridors with a capacity reduction midway, while calming of the side streets was least likely to reduce efficiency when the capacity reduction and closer junction spacing were nearer to the city centre. Queue management measures were the most sensitive to corridor design; they only performed effectively with a combination of close junction spacing and reduced capacity close to the city centre. These results were borne in mind in selecting measures for the case study corridors.
In all four real world corridors, there was a marked correlation between the aggregate performance of the measures in terms of efficiency, environment and safety. Those measures which were more efficient were also better environmentally, because they generated less pollution. Conversely they were less safe, because traffic was able to travel faster. This outcome can be explained in part by the use of a fixed OD matrix. This meant that increased capacity on the main arterial encouraged some rat-runners to return to using the main road, however the degree of saturation of the main road and rat-running roads were less than before. Against this background, the main additional environmental benefits arose from the transfer of traffic from minor roads to the main arterials, and this additional impact was assessed for a subset of options.
In virtually all cases the measures which were tested in more than one time period performed similarly in both. The one exception was the Otley / Kirkstall Road, where calming of a secondary road and reassignment of capacity on the Otley Road both had opposing impacts in the two peaks. This appears to have been a peculiarity of the corridor, rather than a transferable effect.
Generally, as in the hypothetical corridors, the queue management measures did not perform well. The two notable exceptions were the introduction of TRANSYT timings on the Humberstone / Uppingham Road (in the revised base) and the reallocation of queueing between the two arms of the York / Selby Road. However, the Humberstone / Uppingham Road tests also confirmed the results of the hypothetical tests, in that autogating performed most effectively on this corridor, with its closer junction spacing. It would be of interest to test this conclusion further in a corridor in which capacity is reduced at the inner end.
removed too much signal capacity at three critical junctions to be effective in terms of user costs. It is likely that actual implemented signal timings would have been more effective, and possible modal transfer would be sufficient to offset the effect. However it is clear that performance will be very sensitive to detailed design.
Not surprisingly, most of the calming measures adversely affected efficiency but improved safety; their environmental benefits were concentrated on the minor roads. The one exception was the calming of one route parallel to the Otley Road which, in the morning peak, substantially increased efficiency and improved the environment, but had the opposite effect in the evening.
Where queue management measures were combined with bus priority or traffic calming measures, they tended to dominate the resulting effects. Conversely, there was evidence of greater synergy between the effects of calming and bus priority.
Bus priority measures involving the provision of bus lanes and protected laybys have generally performed well, particularly where the corridor has a capacity reduction in its central section. Selective vehicle detection has, by comparison, had a much more limited effect. Bus priorities which reduce capacity for other traffic have, however, had adverse effects on both efficiency and the environment. This was true, also, of the tests of guided bus, and the study has demonstrated the importance of careful detailed design if guided bus is to be beneficial in congested corridors. A further research grant proposal is being developed to investigate this issue in more detail.
Calming measures have typically reduced efficiency but improved safety and the local environment. There are, however, situations in which calming of side streets need not have an adverse impact on overall efficiency. In particular, corridors in which capacity reductions and close junction spacing occur closer to the middle of the arterial perform better in this respect.
REFERENCES
Clark, SD, Fox, KA, Pretty, R, Shepherd SP, Biora, F and Conte, S (1995). "Initial Simulation Results". DRIVE II Project V2010, PRIMAVERA.
Clark, SD, May, AD and Montgomery, FO (1996). "Priority Management for Urban Arterials, Transferability of Techniques, Implementation in NEMIS". Technical Note 387, Institute for Transport Studies, University of Leeds, Leeds.
Clark, SD, May, AD and Montgomery, FO (1995a). "Priority Management for Urban Arterials, Transferability of Techniques, Humberstone/Uppingham Road". Working Paper 461, Institute for Transport Studies, University of Leeds, Leeds.
Clark, SD, May, AD and Montgomery, FO (1995b). "Priority Management for Urban Arterials, Transferability of Techniques, Otley/Kirkstall Road". Working Paper 462, Institute for Transport Studies, University of Leeds, Leeds.
Clark, SD, May, AD and Montgomery, FO (1995d). "Priority Management for Urban Arterials, Transferability of Techniques, Hypothetical Aterials". Working Paper 464, Institute for Transport Studies, University of Leeds, Leeds.
Department of Transport, UK (1983). "Cost Benefit Analysis (COBA) Manual Revision 9". HMSO.
Fox, K, Montgomery, FO, and May, AD (1995). Integrated ATT strategies for urban arterials: DRIVE II project PRIMAVERA. Traffic Engineering and Control 36(5), pp268-271.
Mauro, V. and Di Tarranto, C. (1989). SPOT-UTOPIA. In CCCT'89 - AFCET Proceedings, Paris, France.
TRIPS. MVA Systematica, MVA House, Victoria Way, Woking, Surrey, GU21 1DD
Rathi, AK (1988). "A Control Scheme for High Density Traffic Sectors". Transportation Research B, 22B(2), pp81-101.
SATURN. WS Atkins, Woodcote Grove, Ashley Road, Epson, Surrey.
Technische Universitaet Munchen (1991). EVA Manual. Munich.
Papageorgiou, M (1989). "Modelling Real-Time Control of Traffic Flow on the Boulevard Peripherique in Paris". IFAC Control, Computers, Communication in Transportation, Paris, pp205-211.
APPENDIX 1: EXAMPLE OF OUTPUT EVALUATION DATA
Base : LGT : AM Peak Measure : TRA : AM Peak Filter : All
Impact Base Measure Change % Change
Mean Speed (m/s) 9.44 9.04 -0.40 -4.26 Blocking back 0 0 0 0.00 Fuel Consumption (l) 2390.16 2469.43 79.27 3.32 Stops 82566 179240 96674 117.09 Travel time (s) 1854210 1941347 87137 4.70 Delay (s) 502712 513974 11262 2.24 Flows Out 61201 61218 17 0.03 Bus Travel Time (s) 48026.47 49348.00 1321.53 2.75 NOx Emissions (g) 8514.68 8716.58 201.90 2.37 HC Emissions (g) 21421.81 22187.95 766.13 3.58 CO Emissions (g) 248500.0 259564.5 11064.4 4.45 Bus Flows Out 1191 1266 75 6.30 Travel Time s.d. (s) 512311 526560 14249 2.78 Bus Travel Time s.d. (s) 10223 12569 2346 22.94 Occupancy 8.18 8.40 0.22 2.69 Accidents 0.050455 0.049049 -.001406 -2.79 Fatal Casualties 0.001514 0.001471
Serious Casualties 0.015137 0.014715 Slight Casualties 0.045410 0.044144
Cost (ECU) 20859.62 21470.11 610.49 2.93
Cost Benefit Analysis (ECU) ---
Impact Base Measure Change % Change
Travel time (s) 10282.62 10765.85 483.22 4.70 Fuel Consumption (l) 860.46 888.99 28.54 3.32 NOx Emissions (g) 3.77 3.86 0.09 2.37 HC Emissions (g) 7.45 7.72 0.27 3.58 CO Emissions (g) 0.75 0.78 0.03 4.45 Bus Travel Time (s) 6658.34 6841.55 183.22 2.75 Accidents 3046.23 2961.35 -84.88 -2.79
Multi-Criteria Analysis (MCA) ---
Impact Base Measure Reduction Target MCA Value Car Time 1854210 1941347 -87137 185421 -0.16 Bus Time 48026 49348 -1322 7204 -0.09 Car Time s.d. 512311 526560 -14249 51231 -0.01 Bus Time s.d. 10223 12569 -2346 1022 -0.09 Stops 82566 179240 -96674 16513 -0.53 Totals: -0.88 Fuel Consumed 2390 2469 -79 239 -0.08 NOx Emissions 8514.7 8716.6 -201.9 1277.2 -0.04 HC Emissions 21421.8 22187.9 -766.1 3213.3 -0.06 CO Emissions 248500 259564 -11064 37275 -0.07 Totals: -0.26 Fatal Acc. 0.001514 0.001471 0.000042 0.000227 0.06 Serious Acc. 0.015137 0.014715 0.000422 0.001514 0.09 Slight Acc. 0.045410 0.044144 0.001265 0.002270 0.18 Totals: 0.34 Total: -0.80
APPENDIX 2: EXAMPLE 3D MULTI-CRITERIA SCATTER PLOT
Congestion Management Public transport Priority Traffic Calming Characteristic
1 2 3 4 5 6 7 8 9 1 2 3 4 5 6 7 8 9 1 2 3 4 5 6
High vehicle flows X X X X X X X X X X X X X X X
High bus flows X X X X X X X X X
High pedestrian flows X X X X X X
Changes to junctions X X X X X
Signalised junctions X X X X X X
Poor queue management X X X X X
Rat-running X X
High cross flows X X
Critical junctions X X X X X
Movement of bus stops X X X
Redesign of bus stops X X
Spare link capacity X X
Delays to buses X X
Reduce boarding times X
Regulated buses X
Mid-link accidents X X X X X
[image:24.842.70.772.82.506.2]Low side street flows X
Table 1: Grid showing measures appropriate for differing characteristics
CM1 Maximise Signalised Junction Capacity CM2 Restrict Turning into Congested Arterial CM3 Separate Stage for Turning Traffic CM4 Queue Storage
CM5 Starting and Stopping Waves
CM8 Auto-Metering CM9 Shorter Cycle times
PP1 Bus Stop Relocation PP2 Increase Bus Stop Spacing PP3 Create Laybys
PP9 Form Bus Convoys TC2 Signalised Pedestrian Crossings TC3 Medians
TC4 Linked Traffic Signals