This is a repository copy of Deregulating the Bus Industry.. White Rose Research Online URL for this paper:
http://eprints.whiterose.ac.uk/2360/
Monograph:
Gwilliam, K.M., Nash, C.A. and Mackie, P.J. (1984) Deregulating the Bus Industry. Working Paper. Institute of Transport Studies, University of Leeds , Leeds, UK.
Working Paper 179
[email protected] https://eprints.whiterose.ac.uk/ Reuse
Unless indicated otherwise, fulltext items are protected by copyright with all rights reserved. The copyright exception in section 29 of the Copyright, Designs and Patents Act 1988 allows the making of a single copy solely for the purpose of non-commercial research or private study within the limits of fair dealing. The publisher or other rights-holder may allow further reproduction and re-use of this version - refer to the White Rose Research Online record for this item. Where records identify the publisher as the copyright holder, users can verify any specific terms of use on the publisher’s website.
Takedown
If you consider content in White Rose Research Online to be in breach of UK law, please notify us by
White Rose Research Online
http://eprints.whiterose.ac.uk/Institute of Transport Studies
University of Leeds
This is an ITS Working Paper produced and published by the University of Leeds. ITS Working Papers are intended to provide information and encourage discussion on a topic in advance of formal publication. They represent only the views of the authors, and do not necessarily reflect the views or approval of the sponsors.
White Rose Repository URL for this paper: http://eprints.whiterose.ac.uk/2360/
Published paper
Gwilliam, K.M., Nash, C.A., Mackie, P.J. (1984) Deregulating the Bus Industry.
Institute of Transport Studies, University of Leeds, Working Paper 179
Working P a p e r 1 7 9
O c t o b e r 1 9 8 4
DEREGULATING THE
BUS
INDUSTRY
b
Y
K.M. GWILLIAM, C.A.
NASH
and P.J.
MACKIE
.-. .
ABSTRACT
In its Buses White Paper, the British Government sets out its
proposals for abandoning quantitative control of entry to and
provision of local bus services. The logic on which the
proposals are based can be reduced to four propositions:-
(i) ~ e r e ~ u l a t i o n will produce a competitive market.
(ii) Competition will substantially reduce costs.
(iii) A competitive market will improve resource allocation.
(iv) A competitive market will not cause any significant
undesirable spin-off effects.
Each of these propositions is suspect.
If there is any competition on bus routes, it will tend to be
small group rather than large group. Active rivalry involving
schedule matching and price wars may occur, as may collusion. Neither will produce efficient results.
Even if a competitive result were to obtain, the resulting
resource allocation would not be socially efficient. A first
best optimum requires subsidies because the market is subject to
external economies (the Mohring effect). If Government budget
constraints operate, the second-best solution then requires
cross-subsidies. Competition is not compatible with social
efficiency in either of these cases. Nor will the competitive
market solution optimise load factors. Quality competition, in
the form of minibuses 'creaming' the best traffics, may also be socially undesirable.
The White Paper authors underplay the significance of these resource allocation arguments, while exaggerating the likely impact of deregulation on cost efficiency. Even though some cost savings may be available they could be obtained anyway under a regime of competitive tendering for profitable as well as
unprofitable routes. Competition for the market rather than
DEREGULATING THE BUS INDUSTRY
In its White Paper "Buses", [ I ] the British government sets out
its proposals for creation of a freer local bus service sector than exists in any developed industrial economy in the world. The purpose of this paper is to examine the basis and nature of the proposals, and particularly to assess the validity of the analysis that has been presented in support of them.
The White Paper diagnosis of the bus industry is that a potentially virile sector is being stifled to such an extent by regulation that the variety and quality of service is poor,
demand is unnecessarily low, and costs unnecessarily high. The
prescription is for a heavy dose of free competition on the road between commercially motivated, financially autonomous companies, supported (lest the cure be worse than the disease) by tighter quality regulation, fair competition protections, and direct
support of socially desirable unremunerative services. The
prognosis is the elimination of cross-subsidy, the introduction of new types of service, and the establishment, essentially through market pressures, of the best attainable price/frequency/
quality combination consistent with the external finances
available.
The essence of the White Paper can be reduced to four
propositions."
1. Deregulation will produce a competitive market.
2. Competition will substantially reduce costs.
3 . A competitive market will improve resource allocation.
4. A competitive market will not cause any significant
undesirable spin off effects.
We shall examine each of these propositions in turn.
1. THE WHITE PAPER PROPOSALS AND MARKET STRUCTURE
The White Paper makes the simple assumption that the market is
effectively contestable, so that either there will be
competition, or at least, operators will have to behave as if the
market is highly competitive in order to forestall entry.
Either way, the outcome would be competitive prices, costs and
services. In section 3 we shall examine whether such an
outcome would be socially efficient. But now, we must question
the validity of the assumption that local bus service is an
effectively contestable market. We do so on two grounds.
The first is that some markets are too small to sustain many
operators. The unit of capacity (the bus) will be large in
relation to the market, so that effective entry barriers will
then exist. The second is that we do not start with a clean
*
We do not discuss here the proposals for the ownershipsheet. In many markets, one at least of the incumbents will be a large operator which for historical reasons has achieved a
position of market dominance. Even with the necessary measures
in the White Paper requiring equal access to the concessionary pool, bus stations and so on, the network operator may retain a
variety of advantages. These include demand-side factors such
as the ability to offer a range of connections and forms of
ticketing which enhance customer loyalty. They also include the
sheer financial strength of large operators and their control over the second-hand bus market, which is itself by no means
perfect. All of these _factors may leave entrants at a
disadvantage.
If these arguments have any force, then the implications for
market structure need to be considered. One likely outcome is
active small-group competition. The relevant model may then be
that of oligopolistic rivalry.
Consider the case in which new entry by a small operator against
a large incumbent occurs. Both logic and experience suggest
that he is likely to run just ahead of the existing operator,
probably at lower fares. The likely response of the existing
operator is to match the schedules and fares of the newcomer in an attempt to drive him out of the market, and at the same time offer a demonstration to other potential entrants of the likely consequences.
The White Paper argues "this is not what will probably happen
with totally free entry. If two competitors were to behave like
that, the .profitability of both would be at risk."
This rests on the article of faith that entry barriers are so low that incumbents will face such a strong threat of entry in all their profitable markets simultaneously, that they will lack the power, and the incentive, to engage in fighting tactics.
In practice, the evidence is that tactics of this kind have
occurred. The best example comes from the Hereford and
Worcester Trial Area, where free entry on profitable urban routes
has seen both free buses and simultaneous departures as
competitive tactics. The TRRL monitoring exercise concluded
that average revenues, at 51p per service mile had fallen to
unsustainable levels. "It appears that the present situation in
Hereford must be unstable, although the eventual outcome is
unpredictable
...
Under present conditions, deregulation initself may not be sufficient to allow small operators, however efficient, to compete successfully with established operators
with greater resources." [23.
Other evidence is slightly less persuasive, because it relates to cases of regulated competition under the 1980 Transport Act stage licensing procedures, rather than to a regime of unregulated
competition. Here, a number of cases have featured schedule
matching, including Erwash Travel (Nottingham) and Tally Ho
Cardiff and Cardiff City Transport, public safety aspects
surfaced, and both parties were warned by the Traffic
Commissioners against unruly driving practices. In each of these cases schedule matching lasted for a considerable time, and it
can be shown [31 that even if the low cost operator emerges
victorious, a lengthy payback period is typically required to recoup the costs involved.
A noteworthy feature of this type of case has been the role of
the relevant regulatory bodies. In the Erewash and Tally Ho
cases, pressure from the County Councils helped to end the schedule matching phase, while in another case (Felixstowe Omnibus), the Traffic Commissioner imposed licensing conditions,
which prevented this type of behaviour. With the removal of
these regulatory powers, the schedule matching phase may be further prolonged.
As evidence of the effects of competition following from
deregulation frequent reference is made in the White Paper to the experience of express deregulation under the 1980 Act. It is very doubtful, however, whether the experience of deregulation of the express business can teach us anything about what to expect from deregulation of stage carriage for three main reasons.
Firstly, the express sector was, and is, unsubsidised and largely
financially viable. Thus it presented a much more attractive
market for new entry than the stage carriage business, where a much more limited part of the network remains profitable.
Secondly, a major feature of regulation in the express sector was
the protection of rail services from competition. Thus there
was a large market awaiting coach invasion immediately regulation was lifted. Whether this effect of deregulation was desirable is
open to question. Indeed, the evidence quoted on P.74 of the
White Paper in respect of long distance commuter coaching suggest
that it has cost other public transport operators a loss of £7.4117
p.a. in revenue in return for a saving to commuters of E3m. p.a.
If we assume that commuter coach operators are just breaking even, this would require a combination of net non-financial
benefits to users and cost savings to established public
transport operators to total S4.4m if commuter coach services
were to be judged desirable. On balance, there is probably a
net disbenefit to users when fares are excluded. Allowing for
the effects on congestion and accidents would make the comparison even less favourable to commuter coaches.
Thirdly, partly because of the presence of a close substitute and partly because of other factors, such as the mix of journey purposes, the express business is far more sensitive to price and
quality changes than is the stage carriage. For the latter,
mean price and mileage elasticities appear to be of the order of
-0.3, +0.3. For express, Douglas [41 has estimated mean
elasticities of -1.1 and +0.6 respectively. Consider the effect
expanding bus miles run by 25%. Using a semilog demand function
and reasonable parameter values (Appendix I ) , we find that on the
local service, breaking even would actually require a 17%
increase in fare. Provided that the buses were optimally
scheduled, one would see a marginal increase in traffic of 3%; if the competitor simply duplicated existing timings, traffic would fall by 11% and price increase by a further 202 to break
even. For the express example, by contrast, if there is no
schedule matching, price could drop by 20% and volume rise by
40%. With schedule matching, given that demand is price
elastic, an even greater fall in price could be expected before capacity constraints started to bite.
It is thus quite clear that the incentives to enter are far less in the stage carriage business than in the express, and the
potential benefits far lower - indeed, as we shall argue,
frequently negative.
This leads us to conclude that, while rivalry a7d schedule matching may occur in some of the most attractive markets,
elsewhere another solution is likely. This is recognised in the
White Paper.
"Otherwise, one [operator] might be forced to withdraw. But if there is enough demand to support two operators of the same kind of service, they will usually, in practice, agree to co-ordinate their services (subject to the provisions of the Restrictive Trade Practices Court)."
We agree that monopoly or cartelisation of bus routes is a
further possibility. But there is no specific discussion in the
paper of whether a monopolistic outcome can be considered
"competitive" or not. Clearly, if the market is perfectly
contestable, then the monopolist will be unable to stray far from
the competitive path without attracting entry. But we fear that
too much faith is being placed on the threat of entry to regulate prices and output or, if that fails, on the ability of control institutions such as the Restrictive Trade Practice Court to regulate anti-competitive behaviour. In practice, distinguishing operating agreements which are in the public interest, such as timetable co-ordination, from those which may not be, such as agreements to reduce capacity, will be a regulatory minefield.
In any case, we shall argue later that we see no reason to expect the agreed price/frequency combination to be that which yields the maximum benefit to the public consistent with breaking even.
2. COMPETITION AND COSTS
In the White Paper, it is suggested that one of the prime benefits of coqpetition will be reductions in unit costs. The
scope for improved efficiency is examined in Appendix A to the
Annex, where it is stated that NBC costs per vehicle mile are on
average more than 25% below the PTE level, with private operators
costs of public operators. Competition is the only way to secure
and sustain these efficiency gains". (4.10)
We do not quarrel with the proposition that there is scope for
efficiency improvements in the bus industry. But we do suggest
that the White Paper, while paying lip-service to the arguments, grossly underplays the effects of the patterns of work of the different types of operator on their unit costs.
As an example, consider the four operators investigated by the
Monopolies and Mergers Commission in 1982 C51. From Table 1, it
can be seen that the NBC subsidiaries Bristol and Trent had costs
per vehicle mile some 60-702 of the West Midlands PTE and Cardiff
City Transport.
Table 1 --
WMPTE CCT BOC THT
80/81 80/81 80 80
Cost (p) --
Vehicle mile
Employees nos 0.112 0.123 0.109 0.082
Vehicle mic('000s)
Employee cost (E'000s) 9.259 8.475 6.757 6.944 Employee nos
Other cost (p) --- Vehicle miles
Now, it is quite clear that each of the three ratios which together determine the cost per vehicle mile are themselves strongly influenced by the external environment as well as
internal efficiency. Employees per vehicle mile will be partly
determined by operating speeds and degree of peakiness. Cost per employee will be determined by local labour market conditions, amount of overtime and spreadover working, and other costs per
vehicle mile will be influenced by speeds and operating
conditions.
We tried [6] to allow for these variations in the external conditions which the four operators face by standardising for the differences in average operating speed and the differences in peakiness, as measured by the peak vehicle requirement per
million vehicle miles operated. The result was to cause the
Table 2 --
PARAMETERS BOC TMT WMPTE CCT
Av. speed PVR/million pence/ pence/ pence/ pence/
(mph) veh. miles mile mile mile mile
Cost per BOC 13.7 21.72 103.3 103.9 107.5 102.9
vehicle mile TMT 16.8 19.05 86.6 87.4 90.3 86.9
to operate WMPTE 10.3 26.94 133.4 133.8 138.4 131.8
service CCT 10.7 26.72 129.1 129.6 133.0 127.6
pattern of:
Thus, to operate the services of Bristol Omnibus Co., as represented by their average speed and peak characteristics, each of the four operators would have had costs per vehicle mile
within 3%. If these 4 operators are at all representative, then
most of the cost difference between the municipal sector and NBC
operators is a product of the different external circumstances
they face, rather than the result of different levels of internal efficiency.
If similar arguments apply as between NBC and private sector
ooerators then the taroet of a cut of 33% in unit costs for a
. -
2-
- -given pattern of work will be difficult to achieve. Of course
7 -
reported costs per vehicle mile may fall if the mix of wark changes, but that is an3ther issue.
Supposing that a cost reduction does take place, it is important to consider its status. The WP presumes that a reduction in unit costs is synonymous with an improvement in ecoiomic efficiency.
But this is simplistic. There are two ways in which an
improvement in cost efficiency can come ab0.A:- wages per paid hour can fall or productivity (work hours per paid hour) can rise. If the first of these occurs, then the fall in costs is a pure transfer payment from workers to consumers or taxpayers. If the second happens, then insofar as workers are off their wark effort/wages equilibriun because of th- complexities of wage bargaining, the effect is part transfer payment, part efficiency
gain. Glaister [7] quotes the Department of Transport's
estimates. These are that for big buses, competition will cause
drivers' wages to fall by 29% and utilisation to increase by 11%. Hence, any reduction in the money costs of running bus services represents predominantly a redistribution of welfare rather than a real efficiency gain.
The White Paper quotes the case of the taxi and hire car business as evidence that competition brings pressure to keep down costs
(para 1.7
.
That evidence consists of the observation thatover the period 1972 to 1982 operating costs of buses rose by 15 to 30% in real terms, and fares by 30% whilst taxi fares rose by
only 10%. That was despite the fact that the taxi business is
even more labour intensive than the bus business.
We do not dispute the statistics, which are consistent with the
TRRL's evidence
[a].
But the interpretation that this representsFirstly, the comparisons made relate to prices rather than costs. Public transport costs per passenger mile have increased partly due to a decline of patronage quite independently of the
efficiency with which transport services are provided. Over the
period 1972-82 passenger kilometres have declined by about 15%
more than vehicle kilometres. This has been largely a result of
conscious policy decisions to try to maintain the level of service rather than a result of inefficiency in restricting
outputs. For taxis, what has been happening to utilisation is
a little less clear. Coe and Jackson report "Given that real
expenditure on taxis aid hire cars has risen by a factor of two over the last ten years, and that real fares have fallen, the
number of passengers carried must have more than doubled. While
increases in numbers of vehicles have been marked they have been proportionately less and this strongly indicates significant
productivity gains. It is these productivity gains, probably
facilitated by increasing use of radio, that have enabled real fare levels to fall". On the basis of those calculations the differences in fare trends would appear to be wholly explicable
in terms of utilisation rates. Given that taxis do offer a
higher quality of service at a higher price than buses one would expect increases in personal incomes to cause increases in taxi patronage and reductions of public transport patronage even if there were no change in relative prices.
The White Paper gives the increase of real expenditure over the
decade as only 30% and the increase of the number of taxis as 37%
outside London and 22% in London. A weighted average of these
figures gives an increase in fleet size of just under 30%. Even
on this basis the bulk of the difference between the real price
trends appears as a difference in the relevant effective
utilisation rates. The pressures of competition appear to have
very little to do with it.
Secondly, the inference of the White Paper is that the taxi business is an unregulated business in which the outcomes are
determined by the forces of competition. Of course that is not
the case. In London, though entry is not restricted statutorily
there is a high barrier to entry in the form of "the knowledge",
and fares are regulated. Taxi licensing existed in 305 Of the
369 county districts surveyed by Coe and Jackson. In 201 of
these there was a binding constraint on the number of taxis
operating. In 278 fares were controlled on a prescribed scale.
The effect of these entry and price controls is thus that what is happening to prices is effectively determined not by competition
and the level of costs. The equilibrating mechanism in these
markets is either the level of service provided (in those districts where the entry constraint does not bind) or the quasi rent of the licence where the entry control kept profits above
normal. Coe and Jackson reported evidence of trading in
licences in 161 of the districts with a mean value of about
£5000. In these circ~stances clearly utilisation rates were
free entry. Whether free entry would have led to lower fares or
lower utilisation rates and hence higher unit costs is
indeterminate. Evidence from at least one of the cities where
there is free entry, Santiago in Chile, suggests that a low
utilisation high unit cost outcome may occur. But that is the
subject of a lively current discussion.
Taking these two points together it is clear that there is very little at all that one can deduce from the evidence of taxi fare
trends about the effects of competition on costs. The arguments
of the White Paper are spurious. -
3. COMPETITION AND EFFICIENT RESOURCE ALLOCATION
The authors of the White paper avoid directly confronting the resource allocation arguments and by implication suggest that any losses in this dimension are insignificant in comparison with
the potential cost-efficiency effects. In this section we
challenge that assertion by asking the following questions, none of which are adequately addressed in the White Paper:-
(a) are public transport subsidies indeed incompatible with securing allocative efficiency?
(b) if the Government budget is constrained, is cross-
subsidisation consistent with alocative efficiency, and if so, what are the implications for regulatory policy?
(c) is competition sure to throw up a pattern of fares and frequencies on bus routes which accords with consumers' preferences?
(d) is quality competition, in the form of minibuses, likely to be commercially viable, and if so, does that automatically mean that it is socially efficient?
(el is it true that the integration benefits offered by a planned system can in practice be secured through the market?
(a) User cost'economies and the case for subsidy
Even if there are no internal economies of scale in production, the fact that there are external economies of scale associated with the existence of user costs is the economic basis of the case for subsidies. This result, which was first demonstrated by
Mohring, 191 relies 03 the fact that increases in frequency
simultaneously raise capacity and improve service quality. A
simple proof of the result is given in Appendix 2.
The White Paper asserts that "in some of our 'major cities the cost of subsidising public transport is now unacceptable" (para
1.3). In the supporting.Annex 2 it is conceded "This is not to
o t h e r w i s e t h o s e who l i v e a l o n g o r n e a r them would b e d e p r i v e d a f a v a l u a b l e s e r v i c e . But t h e m e r i t s o f s u c h e x p e n d i t u r e need t o b e judged a g a i n s t t h e s o c i a l v a l u e o f o t h e r f o r m s o f p u b l i c e x p e n d i t u r e " ( p a r a 3 8 ) . One might b e tempted t o draw t h e i n f e r e n c e t h a t s u c h a t e s t had t h e r e f o r e b s e n c o n d u - t e d i n t h e c a s e o f urban s u b s i d i e s and t h a t t h e y had f a i l e d t o meet a " v a l u z f o r mgney" c r i t e r i o n . That i n f e r e n c e would a p p e a r t o b e p a r t i c u l a r l y l e g i t i m a t e a s one o f t h e a d v i s o r s on t h s Annex, Dr G l a i s t e r , was a l s o t h e o r i g i n a t o r o f t h e p r o c e d u r e o f c o s t b e n e f i t a p p r a i s a l o f urban r e v e n u e s u p p o r t which t h e Department i t s e l f p r o m u l g a t e d . [ I 0 1 I t would b e r e a s o n a b l e t o e x p e c t a
d e g r e e o f c o n s i s t e n c y between t h e arguments o f t h e White P a p e r and t h e c o n c l u s i o n s r e a c h e d from t h e c o s t / b e n e f i t a n a l y s e s .
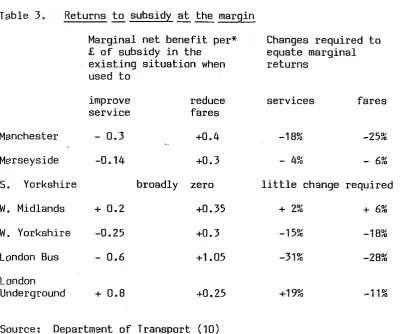
The i n i t i a l c a l c u l a t i o n s o f t h e D.Tp. s t u d y i n f a c t showed t h a t t h e m a r g i n a l b e n e f i t c o s t r a t i o f o r p u b l i c t r a n s p o r t r e v e n u e s u p p o r t i n t h e m e t r o p o l i t a n c n u n t i e s e x c e e d s d u l i t y by a
Table 3. Returns - to subsidy at the margin
--
Marginal net benefit per* Changes required to
£ of subsidy in the equate marginal
existing situation when returns
used to
improve reduce services fares
service fares
Manchester - 0.3 +0.4 -18% -25%
Merseyside -0.14 +0.3 - 4%
-
6%5. Yorkshire broadly zero little change required
W, Midlands
+
0.2 +0.35 + 2%+
6%W, Yorkshire -0.25 +0.3 -15% -1 8%
London Bus - 0.6 +I .05 -31% -28%
London
Underground
+
0.8Source: Department of Transport (10)
*
This shows the position in 1982 for London and in 1980/81 forother areas.
Those initial calculations used common estimates of the various
relevant elasticities and could therefore b? improved 07 the
basis of local evidence. In the context of preparing the Public
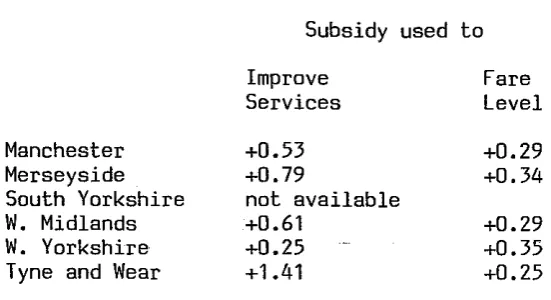
Transport Plan appraisals of the value of subsidy, required under the 1983 Transport Act, the counties have reworked these
calculations, and some of the results are given in Table 4 (see
below). There is therefore a basis for answering the question
[image:14.599.110.513.91.425.2]Table 4. Marginal net benefits per E of subsidy*
Subsidy used to
Improve Fare
Services Level
Manchester +O. 53 +0.29
Merseyside 4.79 +O .34
South Yorkshire not available
W. Midlands ~0.61 +0.29
W . Yorkshire t0.25 - +O .35
Tyne and Wear
+I
.41 +O .25*
for the preferred plan options, 1985/6.Source: PTE Financial Plans 1985/6-1987/8.
In practice the government has steadfastly argued that the Glaister cost benefit calculations are appropriate for testing the balance, between the support of fares and that of service levels and for examining the distribution of revenue support
between counties, but not for determining the absolute level of
-
subsidy which is justifiable.
There appear to be four grounds on which that refusal might be defended:
(i) that because there are "substantial leakages" of
subsidy into cost increases the measured benefit cost ratios need deflation;
The Department appears to make much of the 'leakage' argument. There are three major pieces of work to which it refers in
support of this positon - one relying on a comparison of
European countries
[Ill
and two referring to American conditions112, 3 The weakness of the evidence has been well documented
by Collins [141, and we do no more than reiterate his main points.
Correlation between rising costs and subsidy increases is almost
certain to exist whether leakage is occurring or not. This is
because many of the forces leading to cost increases (rising
real wages, declining patronage) simultaneously lead to a need
for increased subsidies. Thus we are thrown on to the rather
weaker evidence regarding the lag structure of the relationship
to see which effect comes first. But even if subsidy does raise
unit costs, this need not represent leakage, but may well represent a deliberate and justified use of subsidies to raise wages and aid recruitment, to preserve relatively high-cost
services; to improve vehicles, bus shelters, publicity,
reliability or any of a host of factors that determine between
them the quality of the service offered. Lastly, even if such a
[image:15.595.103.379.113.263.2]institutional arrangements in Britain, where there are no earmarked sources of revenue support and financial controls are generally much tighter.
Nothing we have said here proves that leakage does not occur. But it would require very much stronger evidence than anything published to date before we could even be reasonably certain of its existence in Britain, let alone of its msgnitude.
(ii) that the high level of aggregation in the model leads to an overestimation of the benefits of support;
We have seen no evidence to date to suggest that the degree of aggregation in the Glaister model overstates the benefits of
public transport subsidy. Indeed, given the highly non-linear
nature of congestion effects, we should rather suspect that, in a model which is based on average conditions over the day and
across an entire county, any bias w ~ u l d probably be in the
reverse direction.
(iii) that there is an economic distortion involved in the taxation which is necessary to fund public expenditures so that any expenditure needs to generate a direct benefit/cost ratio sufficiently above unity to compensate for these distortions;
(iv) that in any case macro-economic constraints on public expenditure lead to a required beneFit-cost ratio in excess of unity;
We would accept both these points in principle, but argue that the implications of neither of them, when examined in detail supports the assertion that urban public transport subsidy at the
present level is economically unacceptable. Let us examine each
of them in turn.
Increased taxation msy cause an "excess burden" as a result of
either reduced incentives to work in l a b w ~ r markets (in the case
of direct taxatio?), or distortions of consumers choices between
goods and services (in the case of indirect taxation). Dodgson
[291 quotes both American and British research as yielding estimates of the aTpropriate shadow price of funds obtained through national taxes of about 1.1.
For the local tax source, domestic rates, Dodgson obtains a
shadow price estimate of 1.15. This is obtained with an average
effective tax rate on the rental value of housing estimated as
0.218, and a price elasticity of demand for housing of 0.6.
Whilst Dodgson concedes that commercial and industrial rates will also impose welfare costs he finds no basis for a1 equivalent calculation.
expenditures in the transport sector, such as local road
investments, road maintenance, etc. If it were not so then the
imposition of some coitrols on the amount of funding to be provided for local transport expenditures by central government would be a sufficient control.
Within transport sector expenditures, of course, the disparity of the set of relevait casts and benefits is much snaller than
between transport aid othsr sectors. The value of time,
environmental effects, the value of life, etc are just as relevant to the appraisal ~f public transport expenditures as to road expenditures and there does not appear to be any valid reason why the samne conventions of valuation should not apply.
In fact, the initial Glaister model calculations included a narrower set of benefits than those applied to road schemes.
They did not, for example, include aiy safety bensfit
calculations. Some analysis of the London fares changes by
Professor Allsop [ I 5 1 has suggested that the returns to the
public transport subsidies would increase substantially if
accident savings were included. The onission of any formal way
of treating environmental or distributional effects within the calculations is of course parallelled in the appraisal of road schemes where it has on occasion been used to justify investment in schemes with a neasured benefit/cost ratio of less than one (a
negative net present valus in NPV terms). If anything,
therefore, the pxblic transport appraisals have been less
comprehensive thsn road,investment appraisals and a lower ratio
of measured benefits to coats should bs acceptable.
Our conclusion on this dimensioi of the diagnosis follows. The
assertion thst current levels of pxblic transport subsldy are
unacceptable ignores the importance of external ecanomies
associated with user costs and is in-onsistent with the results
of the application of the Department's o m techniques of cast
benefit appraisal to alternative forms of expenditure. Whilst
there are valid reasons to look for a benefit/cost ratio in
excess of 1, we see no reason to doubt that existing subsidy
levels represent good value for money in the majority of cases.
(b) Cross-subsidy and the economics of the second best.
The White Paper states that "over time, competition will elimi-
nate cross-subsidy" (Para 4.11 ). This is stated to bz a good
thing because;
-
cross-subsidy hastens the decline of bus services,-
cross-subsidy "requires some passengers to take 00 theirshoulders the burden of maintaining services for other bus users regardless of their ability to d~ so.
"That k i n d o f c r o s s - s u b s i d y h a s p e r v e r s e e f f e c t s . I t r a i s e s f a r e s on t h e m3re h e a v i l y used r o u t e s h i g h e r t h a n i s n e c e s s a r y f o r p r o f i t a b l e o p e r a t i o n i n o r d e r t o p r e s e r v e s e r v i c e s f o r which t h e r e i s less demand. So i t d r i v e s p e o p l e away from u s i n g b u s e s . F a r e r i s e s l e a d t o a l o s s o f p a t r o n a g e e q u a l , o n a v e r a g e , t o a b o u t 3 p e r c e n t f o r e v e r y 1 0 p e r c e n t r e a l f a r e i n c r e a s e . Thus, f a r from p r o t e c t i n g b u s s e r v i c e s , c r o s s - s u b s i d y h a s i n c r e a s e d t h e r a t e o f t h e i r d e c l i n e " .
T h i s p a r a g r a p h i s g r o s s l y m i s l e a d i n g . Suppose t h a t a p a r t i c u l a r r o u t e is making a l o s s o f % p e r p a s s e n g e r on a volume o f q, p a s s e n g e r s . C l o s u r e o f t h i s r o u t e would t h e r e f o r e y i e l d a s a v i n g o f E L q , t o r e d u c e f a r e s o? p r o f i t a b l e r o u t e s . Suppose t h a t t h e p r o f i t a b l e r o u t e s c a r r y q p a s s e n g e r s a t a f a r e o f p,: We may t h e n c a l c u l a t e t h e p e r c e n h g e r e d u c t i o n i n r e v e n u e r e q u i r e d on p r o f i t a b l y r o u t e s :
L r e d u c t i o n i n f a r e s on 100
l-
q.
p r o f i t a b l e r o u t e s (assuming =
an e l a s t i c i t y o f 0.3) P L q L o . 7
76 rise i n volume on t h e 0 . 3 100 2. o . p r o f i t a b l e r o u t e s
A b s o l u t e rise i n volume 0 . 3
t
a .' I
on t h e p r o f i t a b l e r o u t e s
0.7 p
L
T h i s w i l l exceed t h e p s s s e n g e r numbsrs on t h e u n p r o f i t a b l e r o u t e i f :
I n o t h e r words, o ~ l y i f t h s l o s s p s r p a s s e n g e r on t h e u n p r o f i t a b l e r o u t e s is well wder t w i c e t h e mean f a r e psr
p a s s e n g e r on t h e p r o f i t a b l e r w ~ t e s w i l l t h e removal o f c r o s s s u b s i d y b o o s t p a t r o i a g s . I t may a l s o b e shown t h a t i f b o t h r o u t e s have t h e ssme p r i c e e l a s t i c i t y o f d,:mand and b o t h are
This does - not prove that cross-subsidy is always socially
desirable and indeed we do not so argue. But it i s clear that
the solution to the second-best problem of maximising social benefit subject to a budget constraint is likely to contain cross-subsidy. Appendix 2 shows that the first best solution to the optimisation problem involves subsidies due to the "Mohring
effect". The second best solution, if first best subsidies are
not available, involves prices in the more heavily patronised and the less price elastic routes which are further above first best price levels than on "thin" and price elastic routes.
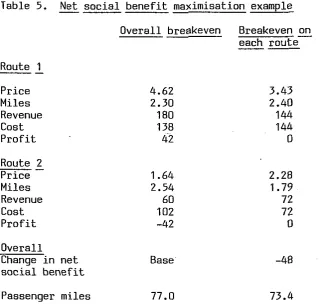
As an example, we have. extended one of the illustrative
calculations by Nash ( 1 6 ) to show the result of eliminating cross
subsidy. It is seen from Table 2 that, in the absence of any
subsidy, the social welfare maximising policy involves a
substantial degree of cross-subsidy from route A to route B. If
the introduction of competition makes such cross-subsidy
Table 5. Net social benefit maximisation example
Overall breakeven Breakeven on
each route-
--
Route
I
--
Price Miles Revenue Cost Profit
Route 2 --
Price Miles Revenue Cost Profit
Overall
Change in net Base
social benefit
Passenger miles 77.0 73.4
The second argument is d-veloped further in Annex 2 to ths Wnite
Paper (paras 33 - 45). Two main p3ints are made. Firstly,
"users of good routes are being penalised by being made to pay excessive fares in relation to the costs of the service they
use, s~ the principle of cross-subsidy, rather than of direct
subsidy from p ~ h l i c funds, can mean that the public transport
services of the less prosperous areas are being taxed to cover
the deficits in more prosperous areas". Secondly, cross-
subsidy "leaves to operators for decision matters that should
not bs so left". This argunent continues "services which the
market does n3t provide and which therefore need subsidy if they are nevertheless to continus should get that subsidy only by decision of elected representatives after proper testing that they represent good value for money and within the resources available to them."
The thrust of this argunent is t h s that any subsidy of loss making services should, bgth for reasons of equity and of democratic accountability, be financed directly from taxpayers on the basis of the appraisal of their value for money, rather than
indirectly from other users. Whether this would lead to a
reduction in the amount of subsidy for uiremunerative services or not is left conceptually indeterminate.
If the real alternatives presented by the White Paper ware direct
or indirect financing of a given amount of support of
unremunerative service.-. ..ws would ollrselves choose direct
[image:20.599.108.435.102.406.2]i n d i c a t e d t h a t t h e t o t a l l e v e l o f e x t e r n a l s u b s i d y is t o be d e c r e a s e d , s o t h a t t h e e f f e c t on t h e u n r e m u n e r a t i v e s e r v i c e s is a r e d u c t i o n o f t h e l e v e l o f s u b s i d y by a n amount e q u a l t o t h e o v e r a l l r e d u c t i o n ,
-
p l u s t h e amount o f i n t e r n a l l y g e n e r a t e d s u p p o r t e l i m i n a t e d , minus a i y s a v i n g s i n d i r e c t l y a c c r u i n g t h r o u g h c h e a p e r o p e r a t i o n c o n s e q u e n t on d s r e g u l a t i o n , minus t h e s p e c i a l i n t e r i m g r a n t o f £20 m i l l i o n i n t h e f i r s t y e a r .Let u s make some c a l c u l a t i o n s o f t h e a n t i c i p a t e d e f f e c t on t h e l e v e l o f s u b s i d y o f u i r e n u n e r a t i v e r u r a l s e r v i c e s , u s i n g t h e White P a p e r s own e s t i m a t e s o f t h e magnitudes i n v o l v e d . A s we have a r a u e d e a r l i e r , we b e l i e v e t h e s e t o b s undulv f a v o u r a b l e t o t h e c a s e f o r d e r e g u l a t i o n becau.;e o f t h e u n r e a l i s t i c a l l y h i g h e s t i m a t e g i v e n f o r a c h i e v a b l e c o s t r e d u c t i o n s .
S h i r e c o u n t y r e v e n u e s u p p o r t is s a i d t o b s a p p r o a c h i n g £100 m i l l i o n . The r a t i o o f i n t e r n a l t o e x t e r n a l g e n e r a t i o n o f s u b s i d i e s g i v e n by t h e j o i n t NBC/D.Tp s t u d y o f Taunton was 3 t o
1 , which i f g e n e r a l l y a p p l i c a b l e would g i v e an i n t e r n a l c r o s s s u b s i d y g e n e r a t i o n o f £300 m i l l i o n . That would b e l o s t . On a t u r n o v e r f o r t h e s e c t o r o f £600 m i l l i o n a 30% c o s t r e d u c t i o n wauld r e d u c e t h e n s e d f o r s u b s i d y by S180 m i l l i o i , t o which we s h o u l d add t h e £20 m i l l i o n i n t e r i m psyment. £250 n i l l i o n less would t h e r e f o r e be needed from r e v e n u s s u p p o r t . A n e t r e d u z t i o n o f s u b s i d y t o u n r e m u n e r a t i v e s e r v i c e s o f £100 m i l l i o n is t h e r e - f o r e i m p l i e d w i t h o u t a i y s a v i n g t o t h e exchequor. I f , a s h s s been i n d i c a t e d , d e r e g u l a t i o n would b e t a k e n as t h s o p p o r t u i i t y t o r e d u c e e x t e r n a l s , ~ b s i d y l e v e l s t h e n t h e l 0 : 3 ~ o f s ~ p p 3 r t f o r u n r e m u n e r a t i v e s e r v i c e s would be even g r e a t e r .
That c a l c u l a t i o n makes it q u i t e c l e a r t h a t t h e Wnite Paper p r o p o s a l is n o t t o r e p l a c e i n t e r n a l cross-subsicly by e x t e r n a l s u b s i d y , b u t t o r e p l a c e a s y s t e m w i t h an exogenously d s t e r m i n e d e x t e r n a l s u b s i d y p l u s i n t e r n a l s u b s i d y s u p p l e m e n t a t i o n by a system w i t h t h e same, 07 less, e x t e r n a l s u b s i d y w i t h o u t any i n t e r n a l s u ? p l e m e n t a t i o n . The l o g i c a l l y c o r r e c t test o f t h e p r o p o s a l s is t h e r e f o r e t o compare t h e w e l f a r e e f f e c t s o f t h e s e a l t e r n a t i v e s , as we h s v e i l l u s t r a t e d above.
The b a l a n c e betwesn f a r e s and s e r v i c e l e v e l s under c ) -
- -
c o m p e t i t i o n
P u t t i n g a s i d e t h e i s s u e s o f s u b s i d y a ~ d c r o s s - s u b s i d y , a v e r y i m p o r t a n t q . ~ e s t i o n r e m a i n s a s t o whether f r e e c o m p e t i t i o n w i l l
n e c e s s a r i l y l e a d t o t h e b e s t combination O F f a r e s a i d f r e q u e n c i e s s ' a b j e c t t o a breakeven c o n s t r a i n t . I t is e a ~ y t o show t h a t a n e q u i l i b r i u m p m i t i o n , w i t h o p e r a t o r s b r e a k i n g even and w i t h no i n c e n t i v e t o e x p a i d o r c o n t r a c t , c o u l d o c c u r a t any o f a set o f c o m b i n a t i o i s o f f a r e and by!; miles.
I f C = C ( F ) and Q = 3 ( P , F ) where
C = t o t a l c o s t
F = f r e q u e n c y .-. ..
P
= fare per tripThen breakeven is given by:
Generally, this will represent a whole locus of possible
combinations of price and frequency at which the industry may break even.
At any point on this locus, an operator who placed one extra bus
on the road would expect to gain P. Q(P.F)B in revenue
F
(where P.Q(P,F) is the average revenue per trip and B is the
F
number of trips made per bus). Assuming constant costs per
trip, he will incur costs of C(F) B
.
These must equal P. Q(P,F)F F
to just break even or in other words C(F) : P. Q(P,F), as stated
above.
Thus, at any point on this locus, there is no incentive for entry to or exit from the industry.
It is possible that when new entry occurs, on profitable routes, the original operator may so cut mileage that - assuming the new
entrants' costs are the same as his own - the original
combination of fare and bus miles is re-established. But it is
more likely that he will resist such a cut, leading to an
expansion in service levels. Thus a new equilibrium could be
established at higher bus mileages and higher fares.
-
Indeedthis has often been what has happened abroad when taxi fares and
numbers have been deregulated 1171. If the original position was
in some sense a planned optimum then - in the absence of a cut in
costs or profits - obviously this new position would be inferior
in terms of this objective. Yet it is the result of
commercially viable new entry. This is the key point: there is
no mechanism whereby the free market will ensure an optimal
combination of fares and frequencies. Indeed, this point is
acknowledged in a paper by Beesley and Glaister on the taxi industry where they argue that it is likely that a free market will tend towards maximising the number of operators able to
survive
-
in other words, a high fare high frequencycombination [18].
Clearly, then, new entry can only be of benefit in the following circumstances:
-
if the existing operator is providing non-optimal (andprobably sub-optimal frequencies).
- If the new entrant has significantly lower costs, and/or
competition forces costs down. In the example in Appendix 1, even
optimally. If they practice duplication of timings, then even with a 10% cost cut, traffic will fall.
- If the previous operator was making a surplus on the route
in question, which is eliminated by competition. In this case
the question is whether the benefit to users is larger than the loss of profit to the operator (or the loss of benefit to other
users if this profit was used to cross-subsidise other
services).We have already indicated that it is quite possible
that a 10% profit margin could be eliminated with little- or even
negative - benefit to users of the route in question. In our
example in Appendix 1, there is a clear disbenefit to both
operators and users if timings are merely duplicated at the
higher fare. But even when an optimal schedule is negotiated,
the net user benefits - at £112 - do not compensate for the loss
of £117 profit.
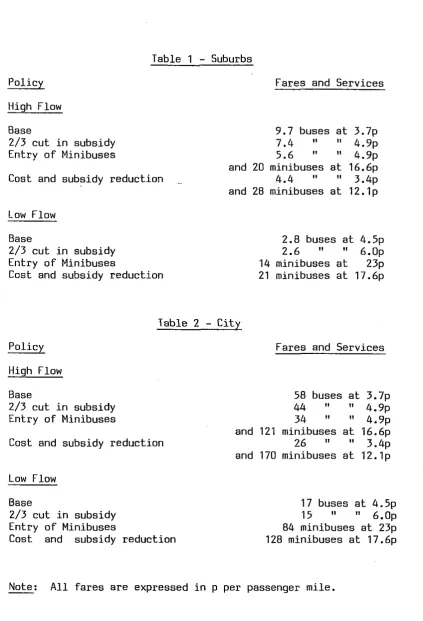
(d) Quality competiton
It is suggested (Annex 2 Para 16) that there may be a substantial market for minibuses, shared taxis and other intermediate modes, providing a form of new entry with different consequences from
those analysed above. It appears from Para 1.6 of the White
Paper itself that it is believed to be in city centres that "competing minibuses may offer a fast and frequent service".
Minibuses are used extensively in Third World cities to provide
public transport services. However, these cities are generally
characterised by excess demand for public transport and a
plentiful supply of cheap labour. In Britain, both past studies
19, 20) and experience (e.9. Harlow, Harrogate) have suggested that minibuses are a very expensive way of providing public
transport services, appropriate
-
if at all-
only where physicalfactors prevent access by a larger bus or where traffic is consistently very low, with no peaks justifying a larger vehicle. Viable urban operations have not seemed feasible.
Three recent papers challenge this view. The first is the work
of Glaister [7], which was specially commissioned by DTp.
Glaister concludes that on high density urban routes, minibuses could sucessfully capture a substantial proportion of the market
even when operating at four times the fare charged on
conventional buses; on lower density routes they would
completely supplement the big bus. We attach a critique of this
paper in Appendix 3. Suffice it to say that we believe these
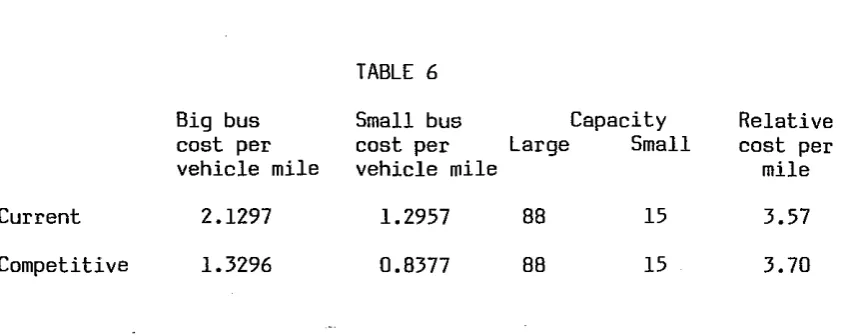
conclusions arise from a number of unrealistic assumptions, which lead to both large and small buses having very low fares (so that the absolute price penalty of the minibus is understated) and to big buses having very long waiting times, so that the advantage of the minibus is grossly overstated.
TABLE 6
Big bus Small bus Capacity Relative
cost per cost per Large Small cost per
vehicle mile vehicle mile mile
Current 2.1297 1.2957 88 15 3.57
Competitive 1.3296 0.8377 88 15 3.70
If we assume, as Glaister does, the same proportionate subsidy and the same load factors for the twotypes of bus, it is clear
that minibus fares must be nearly 4 times big bus fares. Let us
take a realistic example of a big bus service charging 20p for a
2 mile journey. The small bus fare will be 71p. In vehicle
time savings will be slightly under 2 minutes. We may calculate
the necessary time savings for the small bus to offset
passengers' money losses as - 51
-
2, where V is the value of2v
time of the passenger (assumed doubled for waiting time). We
calculate this for each of Glaister's three categories of
passenger. It is clearly unlikely that even high value of time
passengers will benefit from using the minibus; low value of
time passengers would certainly greatly disbenefit.
TABLE 7
Waiting Time Savings Necessary for Passengers to
-
-Benefit from
Usins
MinibusesValue of Necessary Waiting Time Savings
Time
Existing Load Double Minibus Double Both
Factor Load Factor Load Factors
High (2.4 p/m) 8.6 1.33
Medium (1.35 p/m) 16.9 3.93
Low (0.57 p/m) 42.7 12.04
The only way in which minibus operation could be commercially attractive is if they were able to achieve much higher load
factors than conventional buses. For instance, if they achieved
double the load factor, then the cost ratio would be reduced to
1.8. Reworking the above calculations, the fare on minibuses
would be 36p and the necessary time savings - 16 - 2, or for
2v
the three categories of passenger as shown in Table 2.
It would now seem more likely that high value of time passengers would prefer the minibus, although low value passengers would
certainly still prefer c-gnventional buses. However, we must ask
[image:24.599.96.524.47.729.2] [image:24.599.111.535.72.240.2]achieve such an increase in load factors. Probably it would involve:
1. Reducing peak capacity to the level which can achieve high
off-peak utilisation (unless part-time operators could be found for peak extra work).
2. Shuttling on the more heavily used parts of the route, with
few or no buses proceeding to the extremities.
3. Operating few or no services in the early morning, evening
and on-Sunday.
But big bus operators who adopted the same tactics could achieve
much higher load factors too. If they also doubled their load
factors, they would become much more attractive (Table 7).
A second paper by Walters [21], produces some very surprising
results on optimal bus size. He concludes (under given
assumptions) that the greater the volume of traffic, the smaller the optimal bus. He argues that typical urban buses in developed countries are far too large, and also that as a result of taking into account the bus size decision, the economies of scale noted by Mohring (1972) whereby increases in traffic volumes lead to some combination of reduced bus operating costs and reduced waiting times, are probably trivially small.
All of these conclusions appear to follow from a simple error in
Walters' model. He introduces variables for the flow of
passengers (p), the size of bus ( A ) and the waiting time for a
standard bus (v) without noticing that
-
given optimal behaviour-
v is uniquely determined by p.Allowing for this relationship radically changes the results from
the modal. Given Walters own assumptions, it appears that bus
loads in the range 28
-
35 (implying somewhat larger capacitiesin view of stochastic variations in demand) are optimal on
typical urban routes. Only where the flow is very light would
something significantly smaller than a standard bus be optimal, and even this result may well be altered by the presence of peaks
in demand. In British conditions, the costs quoted in Glaister
[7] suggest a smaller cost saving from using small vehicles; thus
the optimal bus size will be larger still.
The complete argument is reproduced in Appendix 4. We conclude that Walters has failed to show a case for using smaller buses on
typical urban routes; moreover, even when allowing for variable
bus size, the economies of scale in bus operations due to the 'Mohring' effect remain very significant.
The third paper is a recent piece of unpublished work [221 by Bly
and Oldfield of TRRL. Unlike Walters, they conclude that there
is no case for completely replacing conventional buses by
minibuses. However, they do conclude that
-
by operating atminibuses may give their passengers waiting time savings which exceed the disadvantages to other passengers of fewer big buses
and of increased congestion. We note that regulation is still
required to restrict their numbers, however, for otherwise commercial incentives lead to their expansion to a level at which
the net disbenefits of minibuses are very large. We note also
that the entry of a high price minibus service, leading to fewer big buses themselves at higher fare (due to reduced load factors), would seriously penalise poorer public transport users.
Thus our conclusions are:
-
Minibus services could only be commercially viable byoperating at high load factors over the better sections of route, with few peak extra, evening or Sunday services.
- The consequences of this would be to force big bus operators
to a combination of reduced services and higher fares.
- In some circumstances it is conceivable that there would be
net benefits as a result, although we are worried about the distributive consequences of such a change.
-
However, the number of minibuses needs to be restricted, andthe case for minibus entry needs judging on its merits in
each individual context. (It is noteworthy that the
current Secretary of State has recently refused entry to
AMOS in London. )
Thus we conclude that retention of regulation to enable the authorities to limit minibus entry is essential: more work needs to be done to establish when, if at all, minibus entry really is to the public good.
(e) Integration
The WP argues (Para. 4:14) that loss of the benefits of
integration will be small, because where customers need
comprehensive information and connecting services, the free market will automatically provide them.
It is important to understand at the outset that the benefits of
integrated public transport planning, whilst they include
provision of comprehensive information, connecting services and
through ticketing, go far beyond these issues. Fundamentally,
the point is that the best value for money is obtained from a limited amount of support if the fares and services of an area
are planned jointly with that aim in view. Fares differentials
may then be established according to second-best principles
rather than the profitability of individual routes. The optimal
trade-off between highly discriminatory complex systems and less
discriminating simple ones can be established. Routes, services
and frequencies may be optimised allowing for the important
interactions between them
-
not just as feeders to each other,catchment areas do so. Of course, we accept that such network planning will be far from perfect, and indeed the computerised techniques which hold high promise of improvements are still in
their infancy. But we believe that the experience of integrated
network and fares planning provided by the PTE's, the NBC MAP
project and the more active shire counties (e.9. Lancashire) is
sufficiently encouraging to suggest that more systematic
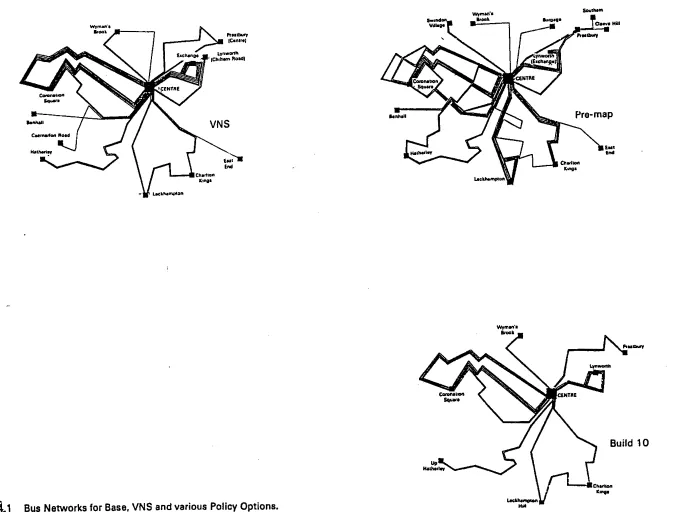
planning, not less, is required. Some of the ways in which the White Paper proposals will make such integration unlikely or impossible are discussed below:
(i) Such integration almost always involves elements of cross- subsidy (see above, and the examples given in Nash, (15, p56, et seq.)
(ii) Integration involves exploiting the economies of scale enjoyed by rail transport when it is present, by designing bus networks to complement the rail service and by attractive
ticketing packages. Much progress has been made on this in
the PTE's (particularly, of course, Tyne and Wear). Yet if
subsidies are inadequate to permit prices which fully reflect the low marginal cost of rail, it will be subject to threat of bus competition at lower fares, in circumstances in which this will cost the rail service revenue greatly in excess of any cost
savings it can make. The result will be higher subsidies and/or
higher fares and poorer services for remaining rail users. This
will occur not just in PTE areas, but also on most Provincial inter-urban routes, where the possibility for profitable inter-
urban bus operation exists. There is a clear need for a
mechanism to weigh up the benefits of new competition on routes against the costs.
(iii) Simplified ticketing systems and travelcards hold great attractions both in marketing and in administrative cost, as the London Transport experience and the West Yorkshire simplification and 3Op off-peak fares have amply demonstrated. Yet such schemes inevitably result in temptation to the small operator to undercut
them on healthier routes and times. It is unlikely that the
existing operator could offer a side-payment to the small operator to keep his fare up, or that this would be legal. Thus, emergence of competition may well require existing operators to
abandon such schemes. In any event, the offers rest on the
ability to provide some support on a network basis rather than for individual routes, and the presence of a body charged with performing a co-ordinating role.
(iv) Sensible route planning often dictates that the best way to serve particular communities is often by combining them with other more lucrative destinations. Of course, it needs checking that the benefits to the additional communities served exceed the losses to other passengers, but this is sure to be the case in
many instances. Now consider an operator running from
A
to B viaC. A new competitor enters on the direct route, offering a
marginally faster service direct from
A
to B. The existingreducing his fares from A to B to such a level that they
compensate for the slightly longer journey time. In the first
case, passengers to and from C are seriously inconvenienced for the sake of a very minor benefit to passengers between A and B. In the second, the operator will require a greatly increased subsidy. He cannot recoup the substantial benefit to inhabitants of C in his revenue partly because it is not practical in bus operations to price-discriminate in sufficiently fine detail to extract a substantial proportion of the consumers surplus and partly because in any case it is hardly feasible to charge a
shorter distance fare from A to C which is higher than the (now
reduced) longer distance one from
A
to B. Thus there is no wayin which a free market will lead to the optimal routeing of the service via C.
(v) Similar problems arise when relying on the free market to
provide connecting services, through ticketing etc. Such
measures invariably require administrative cost, and frequently loss of revenue or increased operating cost for at least one
party. Where connections are implemented which attract
additional traffic, they will of course benefit most the operator with the highest fare for his part of the journey. In principle, he could pay the other operator a sufficient side payment to
ensure that the connection is made, or
-
if through ticketing isadopted
-
agree to a non proportional sharing of the proceeds.But there remain two problems. Firstly, it will not be possible
for the operators between them to recoup in revenue all of the
benefits to users, because of the problem of extracting
consumers' surplus referred to above, and because the through
fare cannot exceed the sum of the two individual fares.
Secondly, in a complicated network of many routes and many operators it is most unlikely that optimal side-payments and
revenue sharing agreements will emerge because of the
administrative costs involved. An overall co-ordinating body has been found necessary to achieve this; hence the growth of PTE type institutions throughout Western Europe, North America and Australia.
(vi) In a network of many operators, information to the public on routes, times and stopping places becomes a real problem. It is conceivable that such a service to the public might be provided on a commercial basis, but in the vast majority of cases in Britain and elsewhere in Western Europe of which the authors are aware in which printed material or enquiry offices handling enquiries concerning a number of operators exist, they have been
provided by public authorities. In the many cases in Britain
where neither shire counties nor tourist boards provide this service, it does not exist even in areas with a reasonable array of different operators.
Overall, then, we conclude that sensible integration requires the presence of a public body with overall responsibility for co-
ordinating routes, times and fares. The free market will not
revenue sharing and side-payments will be too complex to be achieved in practice.
4, UNDESIRABLE SPIN-OFF EFFECTS
A number of the undesirable consequences which may follow
deregulation are discussed in the WP. The most important are as
follows:
(a) Safety
The White Paper authors regard the maintenance of safety
standards as being a matter of the utmost importance, and we
welcome the promise of additional resources to this end.
Nevertheless, we note that the White Paper produces no evidence on the likely scale of the problem following the entry of many
small operators with, in many cases
-
we suspect - minimalmaintenance facilities. One of our students has examined the
maintenance record of existing bus operators by fleet size in the
Yorkshire traffic area
[31.
He found a steady reduction inprohibition and defect notices as fleet size increased (Table
81, with a tenfold increase n the rate far fleets of up to 3
compared with those of over 50. While the result of this sample survey should be treated with due caution, we judge that the task of ensuring safety standards in an industry with many more small
firms will greatly increased. Until the Government's detailed
proposals are made public, it is impossible to judge their adequacy for the task.
Table 8
Maintenance Record of Bus Operators
Fleet
-
- No ofSize Operators
-
(b) Congestion
[image:29.599.90.525.165.724.2]