TOTAL MANUFACTURING E-PLATFORM
LEE WEN YUH
This report is submitted in partial fulfilment of the requirements for the award of
Bachelor of Electronic Engineering (Computer Engineering) With Honours
Faculty of Electronic and Computer Engineering
Universiti Teknikal Malaysia Melaka
ii
UNIVERSTI TEKNIKAL MALAYSIA MELAKA
FAKULTI KEJURUTERAAN ELEKTRONIK DAN KEJURUTERAAN KOMPUTER
BORANG PENGESAHAN STATUS LAPORAN PROJEK SARJANA MUDA I
Tajuk Projek : TOTAL MANUFACTURING E-PLATFORM
Sesi Pengajian : 2010/2011
Saya ……….. mengaku membenarkan Laporan Projek Sarjana Muda ini disimpan di Perpustakaan dengan syarat-syarat kegunaan seperti berikut:
1. Laporan adalah hakmilik Universiti Teknikal Malaysia Melaka.
2. Perpustakaan dibenarkan membuat salinan untuk tujuan pengajian sahaja.
3. Perpustakaan dibenarkan membuat salinan laporan ini sebagai bahan pertukaran antara institusi
pengajian tinggi.
4. Sila tandakan ( √ ) :
SULIT*
(Mengandungi maklumat yang berdarjah keselamatan atau kepentingan Malaysia seperti yang termaktub di dalam AKTA RAHSIA RASMI 1972)
TERHAD* (Mengandungi maklumat terhad yang telah ditentukan oleh organisasi/badan di mana penyelidikan dijalankan)
TIDAK TERHAD
Disahkan oleh:
__________________________ ___________________________________
(TANDATANGAN PENULIS) (COP DAN TANDATANGAN PENYELIA)
Alamat Tetap:
2970-1,WEST ROAD 15, JINJANG UTARA 52000 KUALA LUMPUR
iii
“I hereby declare that this report is result of my own effort except for works that
have been cited clearly in the references.”
Signature : ……….
Author : ……….
Date : ………. Lee Wen Yuh
iv
“I hereby declare that I have read this report and in my opinion this report is
sufficient in terms of scope and quality for the award of Bachelor of Electronic
Engineering (Computer Engineering) with Honours”
Signature : ……….
Supervisor’s Name : ……….
Date : ……….
Engr. Siva Kumar Subramaniam
v
Special dedicated to my beloved parents, family and fellow friends, who had
vi
ACKNOWLEDGEMENT
Taking this opportunity, I would like to express my gratitude to those who have
assists and guide me during the development and research of this Final Year Project (FYP).
My FYP supervisor, Mr Siva Kumar S/O Subramaniam does give a lot of advices and assists
during the development process of this project. Besides, my FYP second supervisor, Mr.
Uthaya Kumar A/L and his collegue Mr. Tam, from AI automation Sdn Bhd, have give me a
lots of guidance about the industrial standard. Lastly, I appreciate Faculty of Electronic and
Computer Engineering (FKEKK) for giving me a chance to design and to implement my
vii
ABSTRACT
This project is to build up a manufacture monitoring system that is able to work out an
accurate data collection for the appropriate analysis so that to provide a solution or guide line
to the workers, and thus automate the FMEA (Failure Mode Error Analysis) system. The
difficulty on achieving the production goal due to the inefficient of the real time problem
solving system has been a great issue in manufacturing since long time ago. Besides, the lack
of proper and accurate tools to analyze the data collected from machine also results in less
utilization of automated data collect and analysis system. Hence, the objective of this project
is to automate the FMEA system so that to increase the workers efficiency and optimize the
machine performance. This monitoring system is able to collect and analyze the data from
machines. The proper guide line and solution will then be provided and displayed to the
workers and management level respectively. The data will be collected by using PLC and be
analyzed by the Visual Basic.Net based system. The guide line and solution will then be
viii
ABSTRAK
Projek ini adalah untuk membina suatu sistem pemantauan perkilangan yang mampu
memngumpul data yang diperlukan untuk analisis yang tepat bagi memberikan penyelesaian
atau garis panduan kepada para pekerja, dan dengan demikian men-automasikan FMEA
(Failure Mode Analisis) sistem. Kesulitan dalam mencapai matlamat pengeluaran disebabkan
kekurangan kecekapan daripada sistem masalah penyelesaian masa nyata telah menjadi isu
besar dalam bidang pembuatan sejak lama. Selain itu, kurangnya alat yang tepat dan sesuai
untuk menganalisis data yang dikumpul dari mesin juga menyebabkan kekurangan
pemanfaatan sistem mengumpul dan menganalisis data automatik. Oleh kerana itu, tujuan
projek ini adalah untuk mengotomatisasikan sistem FMEA supaya meningkatkan kecekapan
pekerja dan mengoptimumkan prestasi mesin. Sistem monitoring ini mampu mengumpul dan
menganalisis data dari mesin serta menyediakan dan memaparkan garis panduan yang tepat
dan penyelesaian kepada para pekerja dan bahagian pengurusan masing-masing. Data akan
dikumpulkan dengan menggunakan PLC dan dianalisa oleh sistem berasaskan Visual
ix
CONTENT
CHAPTER TITLE PAGE
TITLE i
CONFESSION ii
DEDICATION v
ACKNOWDGEMENT vi
ABSTRACT vii
ABSTRAK viii
CONTENTS ix
LIST OF TABLE xii
LIST OF FIGURE xiii
LIST OF ABBREVIATION xv
I INTRODUCTION
1.1 Introduction
1.2 Objective
1.3 Problem Statements
1.4 Scope
1.5 Methodology Briefing
1.6 Existing system
1.6.1 Supervisory Control And Data Acquisition
System (SCADA)
1.7 Introduction to Total Manufacturing E-Platform
x
II LITERATURE REVIEW
2.1 Seven QC Tools
2.1.1 Check Sheet
2.1.2 Fishbone Diagram
2.1.3 Control Chart
2.1.4 Histogram
2.1.5 Pareto Chart
2.1.6 Scatter Diagram
2.1.7 Stratification
2.2 OEE (Overall Equipment Effectiveness)
2.2.1 OEE Factors
2.2.2 Six Big Losses
2.2.3 World Class OEE
2.2.4 Calculating OEE
2.2.5 OEE FAQ
2.2.6 Visual OEETM
2.3 Programmable Logic Controller (PLC)
2.3.1 PLC Parts And Architecture
2.3.1.1 I/O Section
2.3.1.2 Central Processing Unit (CPU)
2.3.1.3 Memory
2.3.1.4 Power Supply
2.3.1.5 Programming Device
2.3.1.6 PLC Ladder Logic
Programming
2.4 Sensor
2.5 Visual Basic .NET
2.6 Microsoft Access Database
xi
III METHODOLOGY
3.1 Flow Chart
3.1.1 General Flow Chart
3.1.2 Hardware Flowchart
3.1.3 Software Flow Chart
3.2 Hardware Development
3.2.1 Push Button To PLC
3.2.2 PLC To PIC Circuit
3.2.3 PIC Circuit To PC Workstation
3.3 Software Development
27 27 28 29 30 30 32 33 34
IV RESULT AND DISCUSSION
4.1 Hardware
4.1.1 Overall Hardware Layout
4.1.2 Push Button
4.1.3 PLC
4.1.4 PIC Circuit
4.2 Total Manufacturing E-Platform
4.2.1 System Flowchart
4.2.2 System Operation
37 37 38 40 41 43 43 44
V CONCLUSION AND FUTURE WORKS
5.1 Conclusion
5.2 Future Works
49
50
xii
LIST OF TABLE
NO TITLE PAGE
2.1 Key word definition 15
2.2 Six big losses 16
2.3 Example of world class OEE standard 17
2.4 Example of table in Access database 25
4.1 Push button function list 39
4.2 PLC input port function list 40
xiii
LIST OF FIGURE
NO TITLE PAGE
1.1 Total Manufacturing E-Platform Development Flow Chart 4
1.2 Total Manufacturing E-Platform block diagram 6
2.1 Fishbone diagram 8
2.2 Control chart 9
2.3 Histogram 10
2.4 Pareto chart 10
2.5 Scatter Diagram 11
2.6 Stratification diagram 12
2.7 Keyence PLC 18
2.8 Omron PLC 18
2.9 PLC parts and architecture 20
2.10 Fixed I/O PLC 21
2.11 Modular I/O PLC 21
2.12 Ladder diagram 23
2.13 Example of a VB .NET form 24
3.1 General Total Manufacturing E-Platform flow chart 27
3.2 Hardware flow chart 28
3.3 Software flow chart 29
3.4 Connection between push button, PLC, PIC circuit, and PC
workstation
30
3.5 Push button 31
3.6 PLC and its input module model CQM1-ID212 31
3.7 Connection of PLC input module (model: CQM1-ID212) with
input devices
xiv
3.8 PLC and its output module model CQM1-OD212 32
3.9 Connection between PLC and PIC circuit 33
3.10 Connection of PLC input module (model: CQM1-OD212)
with input devices
33
3.11 RS-232 to USB converter 34
3.12 MAX232 driver 34
3.13 VB .NET coding platform 35
3.14 VB .NET design platform 35
3.15 Ladder logic programming 36
4.1 Total Manufacturing E-Platform hardware Overview 38
4.2 Push button box 39
4.3 Omron PLC 40
4.4 Interior look of PIC circuit box 42
4.5 PIC Circuit 42
4.6 Total Manufacturing E-Platform flowchart 43
4.7 System first page 44
4.8 Initialize login page 44
4.9 Edit system login page 45
4.10 Start system login page 45
4.11 Failures setting page 46
4.12 Solution setting page 47
4.13 Real-time data collection display screen 47
xv
LIST OF ABBREVIATION
PLC - Programmable Logic Controller
QC - Quality Control
PC - Personal Computer
FAQ - Frequently asked questions
OEE - Overall Effectiveness Equipment
I/O - Input/Output
GUI - Graphical User Interface
OOP - Object-Oriented Programming
VB - Visual Basic
CPU - central processing unit
PIC - Programmable Interface Controller
LHS - Left Hand Side
RHS - Right Hand Side
FMEA - Failure Mode Error Analysis
SCADA - Supervisory Control And Data Acquisition
System
CHAPTER I
INTRODUCTION
There are reasons of why Total Manufacturing E-Platform is designed, and
how it is going to solve the existing problems. In this chapter, a brief introduction on
the system will be discussed, and a comparison between the existing system with the
this system will be made.
1.1 Introduction
Accurate data collection and appropriate analysis could save millions of
dollars for the industries. The management personal has to keep their focus on
performing detail analysis and improvement as an ongoing activity throughout the
year. Data analysis is never to be a great deal for the management in industries, but
analyzing them accurately and according to requirement should be the main objective
of the data collection in industries.
A universal data collection system which will be incorporated with a software
as an analysis tool that could be the best practice in assisting the management by all
means on decision making. In general, this system can be best utilized in any
industrial nature in afford to improve quality issues, production factors and a better
2
The real time system captures valuable information from a certain machine
and interprets this data into understandable figures with detail analysis for
improvements. Such automated software creates solution instantly according to
changes in the production process which could be affected by many factors like
human, machine, supporting department etc. True collected data and accurate
solution is a vital tool and key for the management to move forward for better yield
within their resources.
1.2 Objective
This project is mainly designed to enhance the efficiency of the FMEA
system of manufacture to increase the productivity of industry. The objectives are
stated as the following:
i. To automate the Failure Mode Error Analysis (FMEA) system.
ii. To increase the efficiency of the operation management level.
iii. To control the workers efficiency by which it provides the real time
guidelines and solution to workers/operator.
1.3 Problem Statements
Over the decade, plenty of research have been done on increasing the
productivity of industry. Those research consists of enhancing the industry facilities,
enhancing the used technologies, enhancing the management system, and enhancing
the FMEA system. However, the utilization of automated data collection and
analysis system is still not reach the requirement of industry. The real time data
collect and analysis system should be developed in finding the root causes and
preventions to reduce the production down time. Apart from that, the inefficiency of
the communication between the management and the production lines is the
main factor of increasing the production down time. The delay of transferring the
3
the management over the errors. Besides, the less utilization of the automated
management system also results in wastage of time. There are many routine
failures that occur daily, and in fact, these failures can be solved by the workers
themselves without going through the management.
1.4 Scope of Total Manufacturing E-Platform
This system designed Visual Basic.Net based system that is able to enhance
the RCA (root cause analysis) in manufacturing sector. The research will focus on
the industrial environment, manufacturing RCA, Programmable Logic Controller
(PLC), and Microsoft Visual Basic.Net 2005. The data will be collected from the
machine through the PLC and stored in a database. The data from the database will
then be analyzed based on the Overall Equipment Effectiveness (OEE) concept and
Seven Quality Control Tools (7QC tools) concept. At the final stage, the system will
provide a guideline with a solution to the workers and management through display
screen. Besides, sensors will be added in the system based on the industrial needs for
4
[image:19.595.172.566.81.633.2]1.5 Methodology Briefing
Figure1.1: Total Manufacturing E-Platform Development Flow Chart Start
Discuss with supervisor to get the literature review.
Searching for information
Industry visit
Practical review on PLC and how the system going to interface with the machine
System design using Visual Basic.NET
Interfacing the system program to the machine.
Error?
Programming simulation
System testing No
Yes
Function?
No
End
Project submission Yes
5
1.6 Existing system
1.6.1 Supervisory Control And Data Acquisition System (SCADA)
SCADA is an universal supervisory system that is commonly in used by
many of the industries. It collects data from various sensors at a factory, plant or in
other remote locations and then sends this data to a central computer which then
manages and controls the data [1]. However, SCADA is more focus on prevention
for the occurring of production fault where as the system to be designed is more
focus on providing the solution after the occurring of the production fault.
1.7 Introduction to Total Manufacturing E-Platform
In general, this system is a real-time manufacturing supervisory system that
used to guide the workers or operators when failures occur during the manufacturing
in production lines. Figure 1.2 shows that the data collected from the sensors are
being processed, and analyzed in the system. A series of guideline will then be
displayed to the workers and technicians. In essence, this system is focusing on
providing solution for the failures that is unable to be solved in automation system.
Such failures may cause machine break down, reject units, low quality units, etc.,
6
Figure 1.2: Total Manufacturing E-Platform block diagram Machine /
Production Lines
Database
Visual Basic.NET based System
Management level
Workers and technicians Data collected
Solution PLC
Data Stored
Data processed
CHAPTER II
LITERATURE REVIEW
This chapter will discuss about the background of the research on Total
Manufacturing E-Platform. The theories and concepts that will be used are explained
in detail here.
2.1 Seven QC Tools
In industry manufacturing, quality control is an essential part in maintaining
the quality of the production within the requirement range. Seven QC tools are
fundamental instruments to improve the quality of the product that are used to
analyze the production process, identify the major problems, control fluctuations of
product quality, and provide solutions to avoid future defects. Statistical literacy is
necessary to effectively use the seven QC tools. These tools use statistical techniques
and knowledge to accumulate data and analyze them.
Seven QC tools are utilized to organize the collected data in a way that is easy
to understand and analyze. Moreover, from using the seven QC tools, any specific
8
In essence, the seven QC tools include:
• check sheet, • fishbone diagram, • control chart, • histogram, • Pareto chart,
• scatter diagram, and • stratification
2.1.1 Check Sheet
It is a structured, prepared form that used to collect data for analysis purpose.
When an event or problem is to be observed, the form is to be designed as simple as
possible to ease for collecting data.[3]
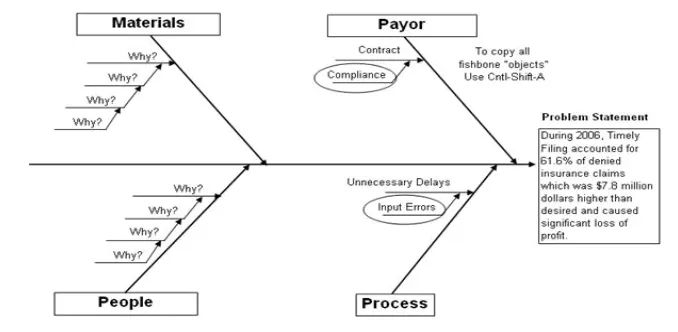
2.1.2 Fishbone Diagram
It is used to identify the possible failures root causes according to the
different categories. In industry, there are six general categories of factors such as
[image:23.595.147.486.548.714.2]measurement, manpower, machines, materials, methods, and environment.[3]
9
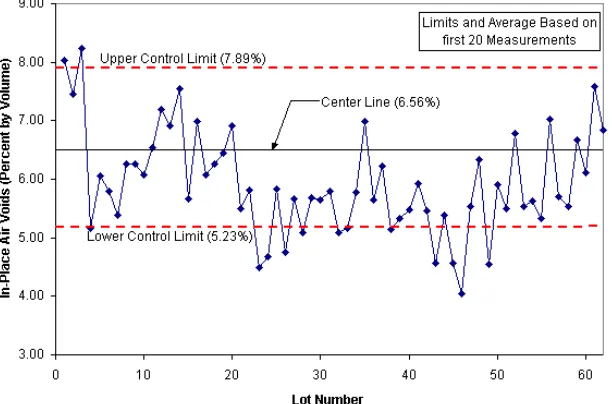
2.1.3 Control Chart
It is a graph that used to study how the process changes over time. The data
are analyzed in time variation. There are upper limit, lower limit and average that
determined from the historical data. Data collected are then compared to these values
and thus a conclusion can be drawn on whether the data are consistent (process in
[image:24.595.167.473.242.444.2]control) or unpredictable (process out of control, affected by special causes).[3]
Figure 2.2: Control chart
2.1.4 Histogram
It is a frequency distribution that used to observe how often each different
value occurs in a set of data. In industry, it can be used to observe the frequency of