AREA FUNCTION IMAGING IN TWO-DIMENSIONAL UL1RASONIC COMPUiERIZED TOMOGRAPHY
L. S. Koo, H. R. Shafiee, D. K. Hsu, S. J. Wormley, and D. 0. Thompson
INTRODUCTION
Ames Laboratory, US DOE Iowa State University Ames, lA 50011
In ultrasonic nondestructive evaluation (NDE) studies, impulse response is often used to evaluate internal defects. Under the far-field Born approximation [1], the impulse response can be written as the product of the second derivative of the area function with respect to the coordinate along the line-of-sight and a scattering constant which depends on the material properties as well as scattering directions [2]. The line-of-sight is a straight line along the illumination direction for pulse-echo tests, and the area function is an artificial time domain waveform equal to the target cross-sectional area intersected by an imaginary transverse plane travelling along the line-of-sight. Hence the double integration of the impulse response yields the product of the area function and the scattering constant. This product is also known as the ramp function response or the ramp response. Dividing the ramp response by its integral results the area function per volume of the target (normalized area function) [2] thus
eliminating the unknown scattering constant. Since the area function (or its normalized form) contains the geometric information about the target, it has been employed in studies of both radar [3-5] and ultrasonic signal imaging [6]. In this paper, an ultrasonic CT algorithm is develped, using the area function from the Born approximation previously suggested by Tam [7]. A similar imaging technique for radar signals can be found in an earlier work done by Das and Boerner [5].
The area function (or the normalized area function) can be expressed as either the three-dimensional Radon transform of the characteristic function of the target (which has the value of 1 inside the target and 0 otherwise), or the two-dimensional Radon transform of the vertical thickness of the target (with respect to a plane "view~ plane" containing the line-of-sight). In the latter case, the area function is analogous to the monochromatic ray sum in parallel-beam X-ray computerized tomography (CT) [8] while the vertical thickness of the target is
analogous to the two-dimensional attenuation function. This analogy suggests that one could acquire the area functions of a target ultrasonically on a designated plane (view-plane) and then reconstruct the vertical thickness function by means of the X -ray CT algorithms. This ultrasonic imaging technique does not require any particular target symmetry and takes advantage of the simplicity and greater efficiency in the X -ray CT algorithms. Although one is not reconstructing the three-dimensional image of the target, one can deduce considerable knowledge about the target geometry from one vertical thickness function. When more than one vertical thickness function is available, then all salient features about the target can be obtained. For example, if the target has a simple regular geometry (ellipsoid, cube, etc.), the vertical thickness functions from three mutually orthogonal view-planes would reveal all the characteristics of it.
The next section briefly reviews the theory. A more detailed discussion of the theory and demonstrations can be found in [2]. Following the theoretical considerations, experimental results with full
aperture
for two laboratory samples containing a 2-to-1 spheroidal void and a circular cylindrical inclusion are discussed. After that, studies of some preliminary results of coping with the problem of limited aperture will be shown. Finally, conclusions are given.1HEORY
In an Euclidean n-space En, the Radon transform of a function fW is [9]
(1)
where t( ) is the Radon transform off( ) and 0( ) is the Dirac delta function. In this paper, a lower case Latin letter like "s" is a real variable unless specified otherwise and an underscored letter denotes a vector (e.g.,~). A vector with the circumflex accent symbolizes a unit vector (e.g.,
t>.
In {1), both~ and t £En. In particular, we will consider fW as the characteristic function of a three-dimensional target V (n=3), i.e., it has the value of 1 inside V and 0 otherwise; its Radon transform is then the area function. From (1)f(s,eJ
=
f
o(s - .lS."eJ~
Jl._EV
=
J.
o(s-x~;) A(x~;) dx~;, x~;
= .lS.·t and d.lS. =A(x~;) dx~;
!;EV=
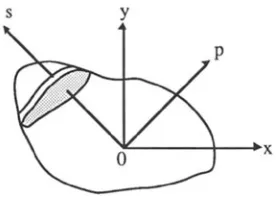
A(s) [H(s+k+)- H(s-k:-)] (2)where the volumetric differential~ is written as a "thin-slice" (with area A(x!;) and thickness x!;) along the direction
&
(Fig.1 ). Then by using the sifting property of the Dirac delta function, one obtains the so-called area function A(s), i.e. the transverse cross-sectional area at s along~- The two H( )'s are the Heaviside functions specifying the boundary k-~ s ~ k+ of A(s) along~ (Fig.1). On the other hand, by restricting the integration in (1) on a plane, the same function f(s,eJ can also be expressed as the two-dimensional Radon transform (n=2) of the vertical thickness of the target with respect to the plane. For convenience, we will set this plane (called view-plane hereafter) as the x-y plane and the z-coordinate is perpendicular to it. With x-y being the fixed coordinates on the view-plane, the corresponding rotationcoordinates are set to be s-p with the corresponding unit vectors
~
andD..
Then, from ( 1)s
y [image:2.482.176.316.480.580.2]f(s.~
=J~ f(~) B(s-~-~ d~
=
JJ~ (J~
fW dz)B(s-~·~
dydx=
JJ~
fz{x,y)B(s-~·~
dydx=
1
. .
fz(x,y) dpalong ll at s=;! ·~ (3)
where
fz<x,y) =
f_~
fW dz (4)is the vertical thickness of the target since f~) is the characteristic function. From (2) and (3), A(s) [H(s+k +) - H(s-k -)]
I
along~=
J
. .
f2(x,y) dp.along n at s=.x:l; (5)
Notice that the data acquisitions on the left-hand-side and the right-hand-side of (5) are made along two perpendicular directions,~ and
U,
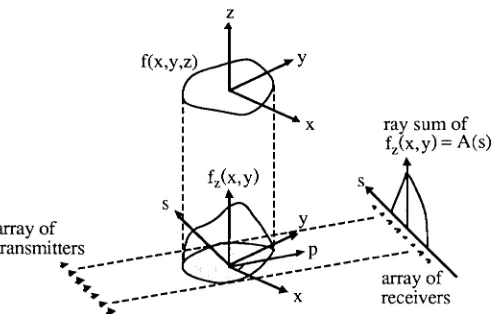
respectively. In parallel-beam X-ray Cf, (5) is analogous to the monochromatic ray sum of the two-dimensional attenuation function on the view-plane (x-y plane) (Fig.2). Therefore by interpretating fz(x,y) as the attenuation function and A(s) as the ray sum, we can directly apply A(s) in an algorithm for X-ray Cf to recover fz(x,y). However, due to the fact that these two functions are measured along two different but perpendicular directions, there will be a 90° rotation in the reconstructed image fz(x,y). In [2], we applied this method to synthetic data based on the Born approximation for two model flaws, a 2-to-1 spheroidal void and a circular cylinderical inclusion and the results indicated that this method can reconstruct the sharp comers as well as smooth boundaries faithfully from theoretical Born signals.z
f(x,y,&
!
;
x ray sum of!
!
ifz(x,y)=A(s)I I
1 f2(x,y) : s
: I
S 1 I •
: y --- • ..
array of I - ..__ --- .. •
transmitters
---~-
p ---• ...~ ~.
---
-------
array of"'~~--- x receivers
•
[image:3.482.116.363.426.583.2]EXPERIMENTAL RESULTS Full aperture reconstruction
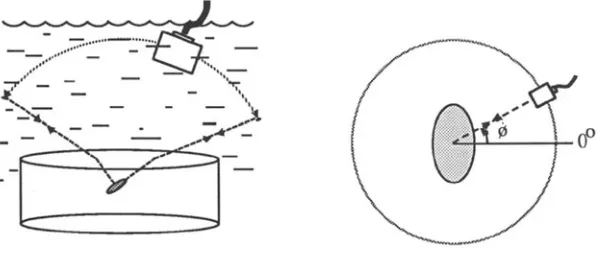
In the full aperture reconstruction, two laboratory samples containing axially symmetric flaws were used One sample was a diffusion bonded titanium block containing a 2-to-1 spheroidal void (semi-axes = 400 and 200 Jll11) at the bond plane. The other sample was a plastic (lucite) disk containll:tg a circular copper cylinder inclusion measuring 155 ~min
diameter and 140 Jll11 in length. As shown schematically in Fig.3, the data were collected in a water bath with a wide-band piezoelectric transducer whose nominal center frequency is 10 MHz. The same transducer was used to transmit the longitudinal impulsive incident wave and to receive the longitudinal response. Based on the Born approximation, the impulse response was integrated twice along s to obtain the ramp response. Due to the presence of noise and finite frequency bandwidth distortion, the double integration was achieved by means of double division in the Fourier domain together with polynomial-fit low-frequency extrapolation [2]. Then, dividing the ramp response by its integral, the experimental "normalized area function" was obtained.
In
order to minimize the interference by the creeping waves [2], we calculated the integral of the ramp response by integrating the front part fo the ramp response between the peak and the first zero-crossing prior to the peak and then multiplied the result by two. (Here, prior knowledge of the symmetry of the target was used.) The normalized area functions were then used in the reconstruction of the vertical thickness function (a two-dimensional image displayed with the aid of gray-scale) of the flaws.In the first example, the 2-to-1 spheroidal void in titanium (wave speed
=
0.634cm/~sec ), the normalized frequency range of the transducer was found to be ka = 0.8 to 6. 7 where a = 400 ~m. The view-angles (in the solid) used in the experiment are illustrated in Fig.4. Because of the size and shape of the specimens, a full 27t aperture was not available; data were obtained from ~ = 0° to 90° in steps of 5° in the viewing plane. For each angle, the normalized area function was computed. The part between the first zero-crossing and the peak of these normalized area functions was found to agree with the Born prediction except at ~
=
900.
At the9QO
view-angle, the experimental data were poor because of two reasons. First, the sound waves were scattered from the oblate spheroid in an "edge-on" configuration which led to a poor signal-to-noise ratio (SNR); secondly, the sound beam was travelling along an imperfect diffsion bond plane of the titanium sample and the grain noise interference caused further distortion of the signal. Making use of the four-fold symmetry of the flaw, these data were copied into the other three quadrants. These 72 normalized area functions were then used as inputs to the filter of backprojection algorithm [10]; the resultant image is depicted in Fig.5a. Here again the image has been rotated bygoo
to account for thegoo
rotation described earlier. The outer patch beyond the concentric ellipses of the image is probably due to the creeping waves. Comparing Fig.5a with the exact results in Fig.Sb, it appears that the central portion of the vertical thickness function between the 40% points of the peak value shows good agreement with the Born prediction. Beyond that the agreement is degraded by the presence of creeping waves. It should be pointed out that the ellipses in Fig.5a exhibit the correct aspect ratio of 2-to-1.--::::···"'.7-•"''"_ ... .
•'
···
..
;---~-
-_
_
...
~
"-
'-...
-
.,
..
_.,./-C
-:....:---s
~.c
...
J __
[image:4.482.94.395.489.619.2]a - ' x c.4 PIXeLS. l PI XeL b X 64 PIXELS. l PIXEL
Fig. 5 Vertical thickness functions of the spheroidal void (a) reconstructed from experimental data (b) exact results.
[image:5.482.64.427.166.302.2] [image:5.482.184.309.365.472.2]64 x 64 PIXELS, 1 PIXEL = 6.64 MICRONS a 64 x 64 PIXELS, 1 PIXEL = 6.64 MICRONS
b
Fig. 7 Vertical thickness functions of the circular cylinder (a) reconstructed from experimental data and (b) exact results.
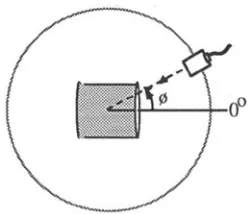
In the second example, a circular cylinder copper wire with a diameter of 155 j.lm and a length of 140 J.lDl was imbedded in lucite (wave speed= 0.272 cm/J.lsec). The pulse-echo scattering configuration was such that the waves encountered a "lying-down" cylinder as shown in Fig.6. In this case, the ka range was found to be from 0.3 to 2.7 where a= 70 J.lm, which obviously was not high enough for the sound waves to "see" the sharp corner. Thus, the resultant experimental (normalized) area functions resembled the area functions of a sphere [2].
Similar to the oblate spheroid case, 19 (normalized) area functions from 111 = 0° to 900 were collected and copied into the other three quadrants so that a total of72 (normalized) area functions were used as inputs to the filter of backprojection algorithm [10]. The reconstructed image is depicted in Fig.7a where the exact image is given in Fig.7b. Even with insufficient ka range and despite the interference of creeping waves, this image exhibits the correct aspect ratio of the flaw.
Limited aperture reconstruction
[image:6.482.61.426.39.172.2]80 80
70 70
60 60
50
40
30
20 20
10 10
I
10 20 30 40 50 60 70 80
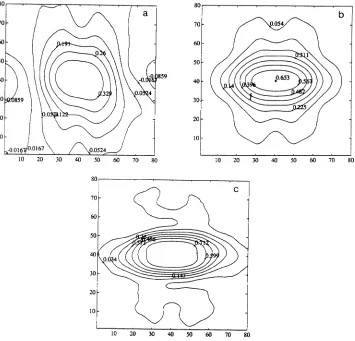
Fig. 8 Contour plots of the vertical thickness function of the spheroidal void (a) with limited aperture (b) with full aperture (c) coupled with the Born area functions.
lit-region (aperture)
dark-region
..A.,_
experimental (nonnalized) area functions~zeros or estimated (nonnalized) area functions
[image:7.482.66.421.35.376.2] [image:7.482.139.342.452.608.2]CONCLUSION
In this present paper we have shown that the (normalized) area function based on the Born approximation offers a simple connection between the ultrasonic scattering response and the monochromatic ray sum in X-ray
cr.
Because of this simple association, we can apply the ultrasonic signals in the computationally direct and efficient parallel-beam X-ray Cf algorithm to reproduce the vertical thickness function of an ultrasonic scatterer. With theoretical data, we have found that this method works very well. Even when experimentaldata were used with a limited frequency range and creeping waves, it still seemed to produce satisfactory results for objects with a continuously smooth surface. For objects with sharp features like corners, a range of normalized frequency (ka) that is high enough to reveal the corner is required. Without a sufficient ka range, it yields an image for an imaginary object whose surface is a smooth convex hull to the original object. In the experimental
implementation of this· method, a wide range of ka remains the most important requirement for producing distortion-free images. A large ka range helps the accurate determination of the zero-of-time at the centroid of a flaw and hence the area function. Continued efforts striving for better frequency bandwidth of the transducer c~uitry will benefit the application of this ultrasonic tomographic method. Even with adequate bandwidth, there still remain the fundamental problem of dealing with the creeping waves present in the ultrasonic signals. Finally, we have proposed a method to improve image quality due to limited aperture distortion and some preliminary results are demonstrated.
ACKNOWLEDGEMENTS
We would like to thank Mr. R. K. Powell for generating the contour plots. This work is sponsored by the U.S. Department of Energy, the Director of Energy Research, Office of Basic Energy Sciences and is performed at the Ames Laboratory. Ames Laboratory is operated for the U.S. Department of Energy by Iowa State University under Contract No. W-7405-ENG-82.
REFERENCES
1. J. H. Rose and J. M. Richardson, J. Nondestruc. Eval .
.l.
45 (1982). 2. L. S. Koo, H. R. Shafiee, D. K. Hsu, S. J. Wormley, and D. 0. Thompson,submitted for publication.
3. D. L. Moffatt and E. M. Kennaugh, IEEE Trans. on Anten. and Prop. AP-13, 401 (1965).
4. J.D. Young, IEEE Trans. on Anten. and Prop. AP-24, 276 (1976).
5. Y. Das and W. M. Boerner, IEEE Trans. on Anten. and Prop. AP-26, 274 (1978). 6. S. J. Tsao, V. V. Varadan, V. K. Varadan, F. Cohen-Tenoudji, and B. R. Tittmann,
IEEE Ultrasonics Sym. Proc.
2.
975 (1984). 7. K. C. Tam, J. Nondestruc. Eval . .5,, 95 (1985).8. G. T. Herman, Ima~e Reconstruction From Projections- Fundamentals of Computerized TomoAPhY (Academic Press, New York, 1980).
9. D. Ludwig, Comm. on Pure and Appl. Math .
.12.
49 (1966).10. R. H. Huesman, G. T. Gullberg, W. L. Greenberg and T. F. Budinger, Donner Algorithms For Reconstruction Tomography, Lawrence Berkeley Lab., Univ. of Calif.,
Oct. 1977.