Article
Two-Dimensional Mathematical Modeling of the
Oxidative Coupling of Methane in a Membrane
Reactor
Wisitsree Wiyaratn1,*, Salamah Manundawee2, Amornchai Arpornwichanop2,
Suttichai Assabumrungrat2, Anucha Watanapa3, and Chidporn Worawimut4
1 Faculty of Industrial Education and Technology, King Mongkut’s University of Technology Thonburi,
Bangkok 10140, Thailand
2 Department of Chemical Engineering, Faculty of Engineering, Chulalongkorn University, Bangkok
10330, Thailand
3 Department of Production Technology Education,Faculty of Industrial Education and Technology, King
Mongkut’s University of Technology Thonburi, Bangkok 10140, Thailand
4 Learning Innovation and Technology,King Mongkut’s University of Technology Thonburi, Bangkok
10140, Thailand
*E-mail: [email protected]
Abstract. The oxidative coupling of methane (OCM) in a dense BSCFO membrane reactor (MR) was theoretically studied using a two-dimensional reactor model. The simulation results indicated that increasing the operating temperature results in increased CH4 conversion and decreased C2 selectivity. An increase in the methane feed flow rate
lowers the CH4 conversion but increases the C2 selectivity; however, the effect of the air
flow rate on the OCM membrane reactor exhibits an opposite trend. The optimum configuration of the dense BSCFO-MR to provide the best performance was 0.018 m in diameter and 0.2 m. in length at a GHSV of 19452.37 h-1 and temperature of 1073 K.
Under these optimal conditions, the CH4 conversion is 43.713 %, the C2 selectivity is
61.352 % and the C2 yield is 26.82 %.
Keywords: Oxidative coupling of methane, BSCFO membrane, two-dimensional model, theoretical analysis.
ENGINEERING JOURNAL Volume 20 Issue 1 Received 3 March 2015
1.
Introduction
Natural gas consists mainly of methane and other potential feedstocks for fuel and chemical synthesis. An oxidative coupling of methane (OCM) is an attractive process that converts methane into higher value-added C2 hydrocarbon products. The OCM has a long history, beginning with the pioneering work of
Keller and Bhasin [1]. Currently, the development and improvement of the OCM to obtain higher methane conversion and higher C2 hydrocarbons selectivity is receiving much attention from many researchers. The
reactor configuration is known to play an important role in producing high yield and high selectivity of ethylene production in the OCM reaction. Various types of reactors, such as fixed bed reactors, fluidized-bed reactors, moving fluidized-bed chromatographic reactors, and membrane reactors, have been reported [2–14]. Some of this structure poses instability in performance and difficulty in operation which is very crucial for industrial scale reactor even though they are very efficient in point of selectivity and yield [15]. Fixed bed reactor was studied on OCM process which was the easiest to design, scale up, and could be analyzed using mathematical model. Membrane reactor seems to be the most suitable reactor type compared with other reactors. Applications of a membrane reactor combining the separation and reaction into a single unit to control the oxygen concentration along the reactor were found to be promising for enhancing OCM performance and increasing the process economy [16]. Inorganic membranes for OCM process can be divided into 2 classes: porous and dense membranes. On the one hand, porous membranes exhibit high permeability but relatively low selectivity. On the other hand, dense membranes exhibit much better selectivity but lower permeability. Within the category of dense membranes, ionic oxygen conducting membranes (IOCM) offered the unique advantage to provide activated oxygen at its surface while preventing hydrocarbon losses to the trans-membrane side [10]. Especially the composition of reactor product stream such as type and quantity should be considered as an important factor for operating condition [15]. Correspondingly, the design of the membrane reactor using a two-dimensional mathematical model considering both the axial and radial directions was found to be more realistic and provides better prediction accuracy than the one-dimensional one. The need of the two-dimensional model becomes essential when a reactor with a large diameter is operated as the effect of radial dispersion becomes more pronounced. In the reactor design it is important to determine a location where the hot spot is severe so that the operation problem such as catalyst sintering can be avoided and suitable operating condition can be selected.Therefore, in this study, two-dimensional mathematical modeling of OCM to C2 hydrocarbons in a
membrane reactor operating under non-isothermal conditions was investigated using the COMSOL® Multiphysics Program. The model was useful for predicting the OCM performance under a dense Ba0.5Sr0.5Co0.8Fe0.2O3-δ (BSCFO) [12] membrane and the effect of the operating condition, such as the
methane flow rate, air flow rate and temperature, were investigated. Moreover, the performance comparison between Fixed-bed reactors (FBR) and Membrane reactors (MR) was considered. Finally, we focused on determining the optimum dimension of the MR to provide the good performance in the OCM process.
2.
Modeling of the OCM Membrane Reactor
2.1. Kinetic Model
Numerous kinetic reaction models have been presented to describe the performance of the OCM process over Na-W-Mn/SiO2. In this study, the kinetic mechanism and rate expression of the OCM reactions
proposed by Danespayeh et al. [14] over the Na-W-Mn/SiO2 catalyst is used. The properties of the catalyst
are presented in Table 1.
2.2. Reactor Model
The transport phenomena were coupled with the reaction kinetics to develop a reactor model. The two-dimensional flow field in a membrane reactor was coupled with the mass and heat transport to simulate the performance of the OCM process as well as the velocity, concentration and temperature profiles. The reactor dimension and condition used in the simulation are summarized in Table 2.
Table 2. Reactor dimension and conditions.
Condition Dimension
Membrane reactor
Length (m) 0.2
Tube diameter (m) 0.018
Shell diameter (m) 0.02
Temperature (K) 993-1173
Pressure (kPa) 101.325
Volumetric flow rate in shell (m3/s) 0.00004-0.00052
Volumetric flow rate in tube (m3/s) 0.00014-0.0007
2.2.1. Geometry and boundary condition
The membrane reactors considered in this study were double tubular reactors. The tube wall was a dense (BSCFO) membrane. The tube was filled with a bed of catalyst, and the outer shell was an impermeable wall. CH4 was fed into the reactor from the tube side, whereas a mixture of oxygen and nitrogen resembling
air composition were fed into the reactor from the shell side. All of the reactors were based on the following assumptions:
Two-dimensional mathematical model
Steady-state conditions
Ideal gas behavior was applied for all gas components.
Diffusivity in the catalyst bed was assumed to follow the Knudsen mechanism.
Membrane reactor resembled a shell and a tube heat exchanger.
2.2.2. Governing equations
Mass balance: the mass balance for each of the eight (Ci = CH4, O2, C2H4, C2H6, CO, CO2, H2, and H2O)
components can be written as follows.
(
)
(1)
The rate of production was calculated for each component from the stoichiometry of the reactions. Energy balance: the energy balance for the reactor can be written as follows.
(
)
(2)
The heat source in Eq. (2), including heat of reaction and heat flux, were computed by
∑
(3)
Momentum balance: the momentum balance for reactor describes the flow in the porous media. The equation extends Darcy’s law combination with the continuity equation:
(
)
(4)
The performance of the reactor was evaluated by the conversion of reactants as well as the selectivity and the yield of the products. The conversion is defined as the fraction of the reactant reacted to the reactant fed. For example, the conversion of methane is
CH4 conversion % =
(5)
C2 selectivity % =
(6)
while yield referred to the specific product formed per reactant fed.C2 yield % =
(7)
The flux equation of the dense Ba0.5Sr0.5Co0.8Fe0.2O3-δ membrane [12] is described in Eq (8). The
simulations were performed by using the COMSOL® program to determine a suitable model for the OCM
process.
The flux equation of Ba0.5Sr0.5Co0.8Fe0.2O3-δ (BSCFO) membrane can be expressed as
n( )
(
)
(8)
2.2.3. Numerical solution
The finite element method was proposed to formulate the PDE problem. The developed finite element model of the OCM membrane reactor was solved with quadratic finite element basis functions using a commercial finite element simulation environment, COMSOL. The software runs the finite element analysis together with meshing, which involves a partition of the geometry model into small units of simple shapes, and error control using a variety of numerical solvers. Three application modes were needed. The heat transfer mode was used to model conduction and convection. The mass transfer by convection and diffusion was used to show the concentration and transport of eight species of interest. The Brinkman equation was applied to describe the fluid flow.
2.2.4. Model validation
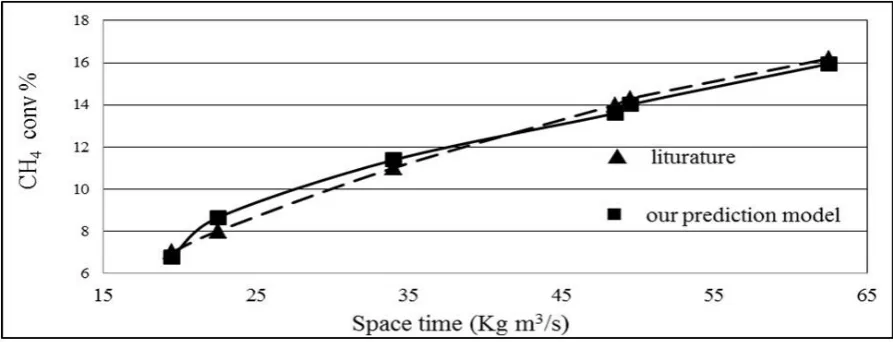
The validation of the kinetic model for Na-W-Mn/SiO2 catalyst was carried out first to ensure that the
mathematics models could well predict the OCM performances. The models used were two-dimensional plug flow model. Figure 1 shows the comparison of our results with literature reported by Daneshpayeh et al. (2009) for Na-W-Mn/SiO2 catalyst providing conversion of CH4 at space time in a range of 16.5 – 19 kg
m3/s, temperature at 1048 K. It can be seen that our simulation results agreed well with simulation data
from literature.
[image:4.595.74.521.481.652.2]3.
Results and Discussion
3.1. Membrane Reactor
3.1.1. Effect of the methane feed rate
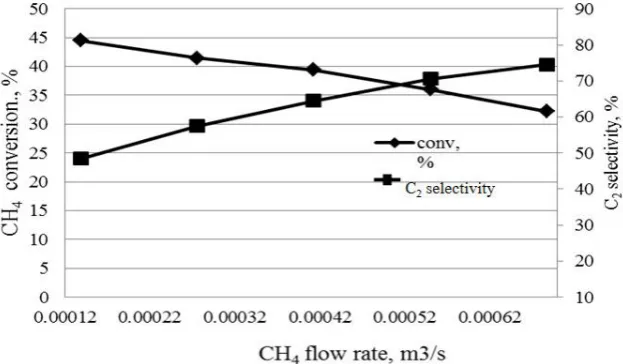
The effect of the methane feed flow rate in a range of 1.38×10⁻⁴ – 6.88×10⁻⁴ m3/s at a temperature of 993
K and an air flow rate of 2.8×10⁻⁴ m3/s on CH4 conversion,% and C2 selectivity,% are presented in Fig. 1.
CH4 conversion was decreased, whereas C2 selectivity was increased with the increase of methane feed flow
rate. Increasing the methane feed flow rate resulted in a lower contact time, and hence, the CH4 conversion
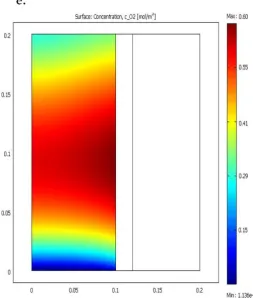
was decreased. In addition, the methane feed rate also affected the permeation of oxygen into the tube side. Figure 2 shows the O2 concentration profile at different methane feed flow rate. At a lower methane feed
flow rate (Figs. 2a and 2b), the oxygen-permeable membrane passed into the first part of the reactor. The membrane completed conversion at a position of permeation into tube side. However, at a higher methane feed rate (Figs. 2c–2e), the oxygen-permeable membrane passed into tube side in the same position as in the previous case, but it exhibited a lower conversion and was slower than the previous case, which was indicated by the higher oxygen flow rate along length of the reactor. Because of the higher methane feed flow rate, the methane feed rate taking the oxygen flow rate, which was permeated on the tube side, was higher as well. As a result, lower contact between methane and oxygen. This was to make CH4 conversion
[image:5.595.141.453.348.530.2]less.
Fig. 2. Effect of the CH4 feed rate on the CH4 conversion, % and the C2 selectivity, % (T =993 K, air
Fig. 3. Effect of the CH4 feed rate on the O2 concentration profile at the following CH4 feed rates: (a)
1.38×10⁻⁴, (b) 2.75×10⁻⁴ (c) 4.13×10⁻⁴, (d) 5.5×10⁻⁴, and (e) 6.88×10⁻⁴ m3/s.
3.1.2. Effect of the air feed rate
The effect of the air feed flow rate in the range of 0.4×10⁻⁴ – 5.2×10⁻³ m3/s at a temperature of 993 K and a
methane flow rate of 5.5×10⁻⁴ m3/s on the CH4 conversion and the C2 selectivity are presented in Fig. 3.
The CH4 conversion was increased whereas the C2 selectivity was decreased with the increase of the air feed
flow rate. When increasing the air feed rate, the flux of oxygen permeation increased due to the higher driving force of oxygen across the membrane; as a result, the CH4 conversion increases. The C2 selectivity
was decreasedbecause a higher amount of oxygen could react with the methyl radical and C2 product to
form carbon oxides.
Fig. 4. Effect of the air flow rate on the CH4 conversion and the C2 selectivity (T =993 K, CH4 flow rate
[image:7.595.140.454.558.740.2]3.1.3. Effect of feed temperature
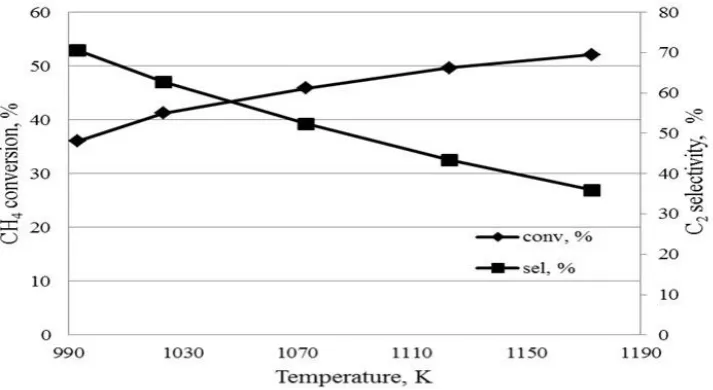
The effect of temperature in the range of 993 to 1173 K for an air feed rate of 2.8×10⁻⁴ m3/s and a methane
feed rate of 5.5×10⁻⁴ m3/s on the CH4 conversion and the C2 selectivity are presented in Fig. 4. The CH4
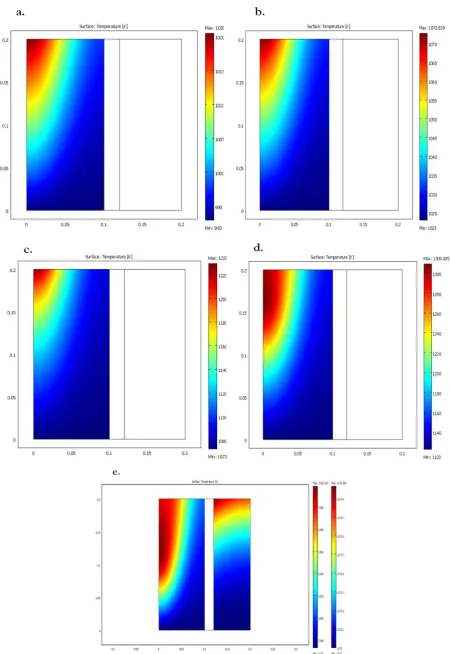
conversion was increased, whereas the C2 selectivity was decreased with the increased temperature. Figures
5a–5e show the temperature profiles at different feed temperatures. The results indicated that the hot spot temperature was always observed due to the accumulation of heat of reaction along the reactor. Figure 5e shows the temperature profiles for both the shell and the tube sides. The temperature increased gradually on the tube side from the inlet to the exit along reactor, especially at the center of the reactor, while the shell side temperature was slightly increased. The trend of the temperature on the tube side was higher than that on the shell side due to the heat released from exothermic reactions. However, at higher temperature (1173 K) the conditions were unfavorable for C2 yield. Apparently, hot spot formation occurred in the
[image:8.595.115.472.303.498.2]middle of the reactor, which suggests that the MR configuration from packed bed membrane reactor should be changed to a catalytic membrane reactor with a membrane tube coated with catalyst at the inner tube wall to prevent this hot spot problem.
Fig. 5. Effect of temperature on the CH4 conversion and the C2 selectivity (air flow rate = 2.8×10⁻⁴ m3/s,
3.2. Comparisons of the Fixed Bed and Membrane Reactors
In this section, the performance comparison between the FBR and the MR is considered based on the same physical dimensions and operating conditions; Na-W-Mn/SiO2 catalyst loading of 55.983 g, air flow rate of
2.8×10⁻⁴ m3/s in FBR (in MR, the flux of oxygen permeated in the tube side is equal to the amount of
oxygen that feeds into the FBR), methane flow rate of 8.16×10⁻⁴ m3/s and temperature of 1123 K. The
maximum yield was found to be 13.5 % for the FBR and 20.11 % for the MR. The main reason for this low performance of the FBR was because the methane and oxygen were fed together into the reactor. Although the CH4 conversion was high, it was likely to have further oxidation of C2 products to carbon oxides, which
reduces C2 selectivity. This behavior was different when operating in the membrane reactor. The oxygen
concentration in the reactor was controlled and distributed along the length of the membrane; as a result, the formation of C2 products was promoted over the formation of COx. The MR exhibits higher C2
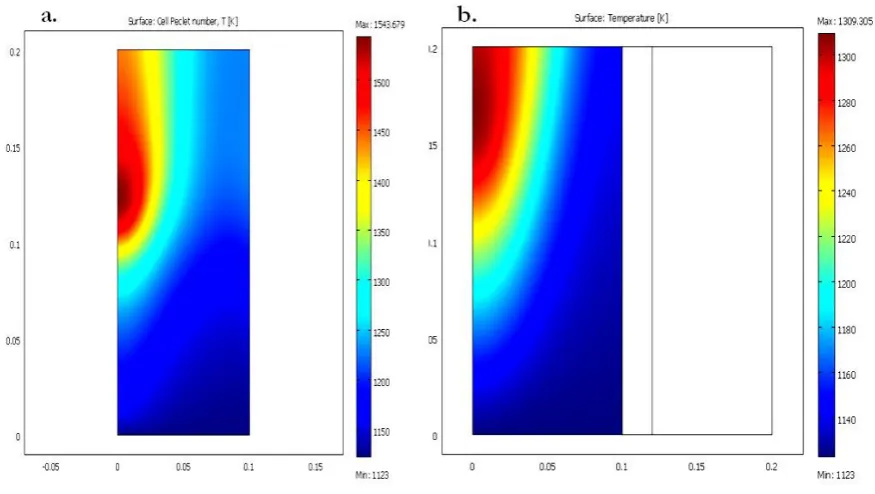
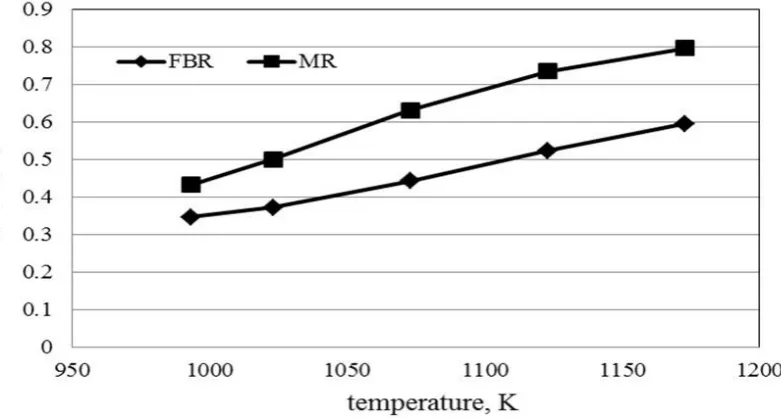
selectivity than the FBR. Figure 7 shows the different profiles of temperature in FBR and MR. It was obvious that the temperature increase in the FBR was higher than that of the MR. The maximum temperature in the reactor was 1543 K and 1309 K in the FBR and the MR, respectively. Moreover, Fig. 8 shows the temperature effect in the range of 993 to 1173 K on the C2H4/C2H6 ratio in the C2 products for
an air feed rate of 2.8×10⁻⁴ m3/s and a methane feed rate of 5.5×10⁻⁴ m3/s. The C2H4/C2H6 ratio increased
with increasing temperature and reached a value of 0.6 in the FBR and 0.8 in the MR at 1173 K. The C2H4/C2H6 ratio in the MR was much higher than that in the FBR, which was an advantage of the
membrane reactor. From the results in this section, the membrane reactor performance was found to be better than that of the fixed bed reactor. Therefore, in the next study, we focus in particular on the membrane reactor.
Fig. 7. Temperature profiles for different reactors: (a) FBR and (b) MR. ( air flow rate =1.6×10⁻⁴ m3/s,
[image:10.595.79.517.381.628.2]Fig. 8. Comparison of the C2H4/C2H6 ratio obtained in a FBR and a BSCFO MR over Na-W-Mn/SiO2
catalyst (air flow rate of 2.8×10⁻⁴ m3/s., CH4 flow rate of 5.5×10⁻⁴ m3/s).
3.3. Sizing of the Reactor
In this section, we focus on determining an optimum dimension of MR to provide the best performance in OCM process [16]. The simulations were performed using membrane reactors with different diameters, as summarized in Table 4. The GHSV was kept at the same value for all cases. Table 5 summarizes the different operating conditions used in the simulations of reactors with different sizes.
First, we focus on the characteristics of different diameters of the reactor at a GHSV of 38,904.54 1/h and a temperature of 993 K. Figure 8 shows the membrane area/volume for different diameters of the reactor. The membrane area/volume was observed to decrease, and therefore, oxygen permeation decreased with an increasing reactor diameter. The oxygen permeation had an influence on the reaction rate and the OCM performance. Moreover, the tube diameter affected the variation of the oxygen profile, such as axial and radial dispersion in the tube side, as shown in Fig. 9. For membrane reactors with a small diameter (Figs. 9a–9b), the oxygen permeation was high, especially near the feed inlet, and oxygen was present even at the center of the reactor. For medium diameters (Figs. 9c–9e), the oxygen could permeate through the membrane along the reactor length. The oxygen conversion was found to be lower than that of the small diameter case. In addition, the oxygen concentration in tube side was still high. Furthermore, for larger diameters (Figs. 9f–9g), the oxygen concentration varied significantly along both the axial and radial directions. The concentration of oxygen was not well-distributed throughout in the radius direction, as it was only present near the membrane area (tube wall).
Figure 10 shows the pressure drop over the catalyst bed for the reactors with different diameters. The figure shows that decreasing the reactor diameter causes an increased pressure drop. The difference in size of the membrane reactor obviously influenced the oxygen concentration within the reactor as well as the pressure drop across the catalyst bed.
Figure 11 shows the CH4 conversion and the C2 yield for different sizes of the reactor (Table 5) and for
different conditions (Table 6). From the simulations, the maximum CH4 conversion and C2 yield appeared
at the reactor diameter of 0.018 m (model c.), except when the GHSV was 58427.55 1/h at 993 K (Fig. 11a), in which case the maximum CH4 conversion and C2 yield occurs at the reactor diameter of 0.027 m (model
Once we determined the appropriate dimension of the reactor, more simulations were performed under various conditions to determine the best result. The performance of the OCM at different conditions is summarized in Table 7. The best performance was found at a GHSV of 38904.54 1/h and a temperature of 1073 K, offering the highest C2 yield of 26.82 %.
A comparison of our simulation results with the experimental results is shown in Table 8. For the same membrane type considered in our study, the OCM in a packed bed BSCFO membrane reactor using La-Sr/CaO catalyst reported by [12] and [17] achieved the best C2 yields of 18 % and 15 %, respectively. For
the same catalyst type as considered in our study, the OCM in a packed bed
Ba0.5Ce0.4Gd0.1Co0.8Fe0.2O3-δ (BCGCFO) membrane reactor using Na-W-Mn/SiO2 catalyst reported by
[18] achieved a C2 yield of 14.4 %. From all of the results in packed bed membrane reactors that used both
the same catalyst and the same membrane as used in our study, our simulation resulted in a higher yield than those reported in the literature. On the contrary, when compared with the result of the catalytic Ba0.5Ce0.4Gd0.1Co0.8Fe0.2O3-δ (BCGCFO) membrane reactor using Na-W-Mn/SiO2 catalyst reported by [18],
[image:12.595.201.400.293.345.2]their reported C2 yield of 34.7 % was better than our results.
Table 3. Comparison between two types of reactor at condition: T= 1123 K, P= 1 atm, air flow rate = 2.8×10⁻⁴ m3/s, methane flow rate= 8.16×10⁻⁴ m3/s).
Performance FBR MR (BSCFO ) CH4 conversion, % 38.46 37.58
C2 selectivity, % 35.25 57.23
[image:12.595.89.455.329.681.2]C2 yield, % 13.56 21.51
Table 4. Dimension of different sizes of membrane reactor.
Model rtube(m) Dimension rshell(m) h(m)
a. 0.0045 0.010 0.8
b. 0.006 0.013 0.45
c. 0.009 0.018 0.2
d. 0.0135 0.030 0.089
e. 0.018 0.040 0.05
f. 0.0225 0.050 0.032
Fig. 12. CH4 conversion,% and C2 yield,% for different tube diameters: (a) T= 993 K, GSHV =58427.55
[image:15.595.71.519.84.577.2]Table 5 Summary OCM performance on optimum reactor at different conditions.
Operating condition OCM performance
GHSV (1/h) T (K) CH4 conv, % C2 sel, % C2 yield, %
58427.55 993 24.051 77.81 18.720
38904.54 993 31.355 75.673 23.272
19452.27 993 36.361 69.412 25.283
38904.54 1073 38.132 65.630 25.026
38904.54 1173 48.285 54.467 26.231
38904.54 1223 52.465 49.653 26.050
38904.54 1273 57.820 43.373 25.087
19452.27 1073 43.713 61.352 26.818
19452.27 1173 50.34 52.973 26.667
[image:16.595.81.518.269.420.2]19452.27 1223 58.325 41.854 24.241
Table 6. Highest C2 yield reported for OCM in literature.
Catalyst Membrane Type of reactor Temperature (K) rate (mCH4 flow 3/s) yield, % C2 Reported by
Na-W-Mn/SiO2 BSCFO PBMR 1073 1.95×10
-1 26.82 This work
La-Sr/CaO BSCFO PBMR 1123 3.33×10⁻⁷ 15 Wang al.[12] et
La-Sr/CaO BSCFO PBMR 1223 1.41×10⁻⁶ 18 Oliver al.[10] et
Na-W-Mn/SiO2 BCGCFO PBMR 1123 7.5 ×10
-6 14.4 Bhatia et
al.[19]
Na-W-Mn/SiO2 BCGCFO CMR 1123 7.5×10
-6 34.7 Bhatia et
al.[19] *Ba0.5Ce0.4Gd0.1Co0.8Fe0.2O3-δ (BCGCFO)
4.
Conclusions
Two-dimensional mathematical modeling of the OCM in a dense BSCFO membrane reactor was investigated in this research. Various operating conditions, such as the methane flow rate, air flow rate and temperature, influence the performance of the OCM reaction. The temperature profiles of a FBR and a dense BSCFO- MR revealed that significant hot spot temperatures were observed for the FBR, unlike the case of the MR. At the optimum dimensions of a dense BSCFO- MR, the values of CH4 conversion of
43.713 %, C2 selectivity of 61.352 % and C2 yield of 26.82 % were obtained.
The performance of the OCM may be improved when changing the reactor configuration, such as a catalytic membrane reactor or fluidized bed reactor. The design of the OCM system utilizing a combination of a reactor and a separation unit with the OCM process to increase the C2 yield and performance of the
OCM process should be considered. Performing a simulation study using a three-dimensional model that accounts for hydrodynamics within the reactor is recommended for future work. This three-dimensional model should represent more realistic phenomena with better prediction accuracy.
Acknowledgements
[3] W. Kiatkittipong, T. Tagawa, S. Goto, S. Assabumrungrat, K. Silpasup, and P. Praserthdam, “Comparative study of oxidative coupling of methane modeling in various types of reactor,” Chemical Engineering Journal, vol. 115, pp. 63–71, 2005.
[4] K. Prodip, Z. Yan, and K. R. Ajay, “Multi-objective optimization of simulated countercurrent moving bed chromatographic reactor for oxidative coupling of methane,” Chemical Engineering Science, vol. 64, pp. 4137–4149, 2009.
[5] O. Louis, H. Stephane, M. Claude, and C. V. V. Andre, “Oxidative coupling of methane using catalyst modified dense perovskite membrane reactors,” Catalysis Today, vol. 142, pp. 34–41, 2009.
[6] M. R. Quddus, Y. Zhang, and A. K. Ray, “Multi-objective optimization in solid oxide fuel cell for oxidative coupling of methane,” Chemical Engineering Journal, vol. 165, pp. 639–648, 2010.
[7] M. K. S. Shahri and S. M. Alavi, “Kinetic studies of the oxidative coupling of methane over the Mn/Na2WO4/SiO2 catalyst,” Journal of Natural Gas Chemistry, vol. 18, pp. 25–34, 2009.
[8] Y. Simon, F. Baronne, and P. M. Marquaire, “Kinetic modeling of the oxidative coupling of methane,” Industrial & Engineering Chemistry Research, vol. 46, pp. 1914–1922, 2007.
[9] C. Y. Thien, A. R. Mohamed, and S. Bhatia, “Process optimization of oxidative coupling of methane for ethylene production using response surface methodology,” Journal of Chemical Technology and Biotechnology, vol. 82, pp. 81–91, 2007.
[10] L. Olivier, S. P. Haag, C. Mirodatos, and A. C. V. Veen, “Oxidative coupling of methane using catalyst modified dense perovskite membrane reactors,” Catalysis Today, vol. 142, pp. 34–41, 2009.
[11] Y. K. Kao, L. Lei, and, Y. S. Lin, “Optimum operation of oxidative coupling of methane in porous ceramic membrane reactors,” Catalysis Today, vol. 82, pp. 255–273, 2003.
[12] H. Wang, C. You, and W. Yung, “Oxygen permeation study in a tubular Ba0.5Sr0.5Co0.8Fe0.2O3-δ oxygen
permeable membrane,” Journal of Membrane Science, vol. 210, pp. 259–271, 2002.
[13] A. L. Shaula, A. A. Yaremchenko, V. V. Kharton, D. I. Logvinovich, E. N. Naumovich, A. V. Kovalevsky, J. R. Frade, and F. M. B. Marques, “Oxygen permeability of LaGaO3-based ceramic
membranes,” Journal of Membrane Science, vol. 221, pp. 69–77, 2003.
[14] M. Daneshpayeh, K. Abbasali, M. Navid, M. Yadolah, S. Rahmate, and T. Alireza, “Kinetic modeling of oxidative coupling of methane over Mn/Na2WO4/SiO2 catalyst,” Fuel Processing Technology, vol. 90,
pp. 403–410, 2009.
[15] R. M. de Brito Alves, C. A. O. Nascimento, and E. C. Biscaia Jr., “Robust integration of RTO and MPC,” in 10th International Symposium on Process Systems Engineering, Part A. Elsevier, British Library, 2009.
[16] H. Wang, C. You, and W. Yung, “Oxidative coup ing of methane in Ba0.5Sr0.5Co0.8Fe0.2O3-δ (BSCF) tubular membrane reactors,” Catalysis Today, vol. 104, pp. 160–167, 2005.
[17] Y. K. Kao, L. Lei, and Y. S. Lin, “A comparative simu ation study on oxidative coup ing of methane in fixed-bed and membrane reactors,” Industrial & Engineering Chemistry Research, vol. 36, pp. 3583–3593, 1997.
[18] H. Liu, X. Wang, D. Yung, R. Gao, Z. Wang, and J. Jung, “Sca e up and stabi ity test for oxidative coupling of methane over Na2WO4-Mn/SiO2 catalyst in a 200 ml fixed-bed reactor,” Natural Gas Chemistry, vol. 17, pp. 59–63, 2008.