promoting access to White Rose research papers
Universities of Leeds, Sheffield and York
http://eprints.whiterose.ac.uk/
This is an author produced version of a paper published in Drug Discovery Today.
White Rose Research Online URL for this paper: http://eprints.whiterose.ac.uk/3605/
Published paper
Similarity-Based Virtual Screening
Using 2D Fingerprints
Peter Willett
Krebs Institute for Biomolecular Research and Department of Information Studies, University of Sheffield, 211 Portobello, Sheffield S1 4DP, UK.
Tel: +44-114-2222633; fax: +44-114-2780300; email: [email protected]
Keywords Fingerprint; fragment substructure; molecular similarity; similarity searching;
virtual screening
Teaser This paper discusses the use of binary-encoded fragment substructures to scan
databases to find molecules that are structurally similar to a bioactive query compound.
Abstract This paper summarises recent work at the University of Sheffield on virtual
screening methods that use 2D fingerprint measures of structural similarity. A detailed comparison of a large number of similarity coefficients demonstrates that the well-known Tanimoto coefficient remains the method of choice for the computation of fingerprint-based similarity, despite possessing some inherent biases related to the sizes of the molecules that are being sought. Group fusion involves combining the results of similarity searches based on multiple reference structures and a single similarity measure. We demonstrate the effectiveness of this approach to screening, and also describe an approximate form of group fusion, turbo similarity searching, that can be used when just a single reference structure is available.
Introduction
Virtual screening (VS) is increasingly used as a cost-effective complement to high-throughput screening [1], and employs a range of computational methods to prioritise the selection and testing of large chemical datasets so as to ensure that those molecules that have the largest a priori probabilities of activity are assayed first in a lead discovery
programme [2-4]. There are two principal types of virtual screening system: the popular structure-based approaches, such as docking and de novo design, can be used when the
3D structure of the biological target is available; alternatively, the simpler, ligand-based approaches are applicable in the absence of such structural information. Examples of ligand-based approaches include: pharmacophore methods, which involve the identification of the pharmacophoric pattern common to a set of known actives and the use of this pattern in a subsequent 3D substructure search; machine learning methods, in which a classification rule is developed from a training-set containing known active and known inactive molecules; and the similarity methods that form the focus of this paper.
Thus, if the Principle holds, then a database-molecule that has not been tested for biological activity but that is structurally similar to a molecule that is known to exhibit the activity of interest (the so-called reference or target structure) then the
database-molecule is also likely to be active; moreover, this database-molecule is more likely to be active than another database-molecule that has a lesser degree of similarity to the reference structure. A simple VS strategy hence involves computing the similarity between the known reference structure and each of the molecules in a database, ranking the database-molecules in decreasing order of the computed similarities and then carrying out real screening on just the top-ranked database-molecules.
The ranking of a database in order of decreasing similarity was first described in two papers that were published in the mid-Eighties [6,7] and that both focused on the use of 2D fingerprints, i.e., binary strings encoding the presence or absence of substructural fragments [8,9], for the measurement of inter-molecular structural similarity. This approach was rapidly taken up and there is now a very large body of evidence that supports the use of fingerprint-based measures for VS [10-18]. It must be emphasised that many other types of structural representation have been suggested for the computation of molecular similarity, including physicochemical properties, chemical graphs, topological indices, 3D pharmacophore patterns and molecular fields inter alia
[19-22]. However, the simple 2D fingerprint continues to be the representation of choice for similarity-based VS, not only because of its computational efficiency but also because of its demonstrated effectiveness in the many comparative studies that have been carried out. Indeed, there is a continuing debate as to whether there is any benefit to be gained from the use of more sophisticated approaches to the computation of molecular similarity (see, e.g., [11,12,23-29]). Note that we focus here on the use of 2D fingerprints to compute measures of molecular similarity; there is also an extensive literature associated with their use for applications in molecular diversity and in the clustering of chemical databases (see, e.g., [8,9,30-34]).
The current importance of VS has led to a resurgence of interest in the use and further development of similarity measures based on 2D fingerprints, with much of the work being carried out by the group under Bajorath at the University of Washington (see, e.g., [35-39], by the group under Sheridan at Merck (see, e.g., [15,26,40-43]) and by the chemoinformatics research group in the University of Sheffield. This paper summarises recent work at Sheffield, focusing on the effects of varying the similarity coefficient that is used for searching, and of combining multiple database searches [44-51].
Comparison of Similarity Coefficients
there have been only limited studies of the effect of weighting on molecular similarity, and, as noted in the introduction, we focus here on one particular structural representation, the 2D fingerprint. Turning then to the similarity coefficient that is used for comparing fingerprints, the most popular is the Tanimoto coefficient. If two molecules have a and b bits set in their fragment bit-strings, with c of these bits being set
in both of the fingerprints, then the Tanimoto coefficient is defined to be
c b a
c
− + .
The Tanimoto coefficient gives values in the range of zero (no bits in common) to unity (all bits the same); it is also known as the Jaccard coefficient, and, when used to measure dissimilarity rather than similarity, as the Soergel coefficient [20]. The Tanimoto was used in some of the earliest studies of fingerprint-based similarity [7,10] and is now the coefficient of choice in both in-house and commercial software systems for chemical information management. Although the Tanimoto coefficient is widely used, Flower has noted that it typically yields low similarity values when the reference molecule in a similarity search has just a few bits set in its fingerprint [52]. This marked size-dependency was confirmed in later studies [53-55], and it has also been shown that the coefficient has an inherent bias towards certain similarity values [37]. These observations were the starting point for our comparative studies of similarity coefficients, as described below.
Many different disciplines require the ability to quantify the degree of similarity (or conversely, the distance or dissimilarity) between two objects, each characterised by some number of attributes or descriptors, and there is thus a very extensive literature describing similarity coefficients that can be used for this purpose (see, e.g., [56-58]). Although many of these are designed for use with continuous, real-valued data they can often be expressed in a form that makes them suitable for determining the similarities between pairs of binary records, such as 2D fingerprints [20]. The Tanimoto is one such coefficient but there are many others and Holliday et al. [44] carried out a comparison of
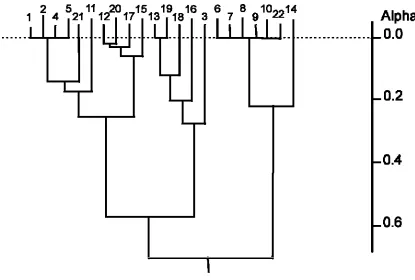
no less than 22 of these in searches of the NCI AIDS database (available from the National Cancer Institute at http://dtp.nci.nih.gov/) using Unity 2D fingerprints (available from Tripos Inc. at http://www.tripos.com). Examples of some of the coefficients that were used are listed in Table 1. The results of each search were ranked in decreasing similarity order and the rankings for two searches compared by counting the number of compounds in common in the top-ranked t structures; these numbers of
compounds-in-common were then input to an hierarchical agglomerative clustering procedure (as first suggested by Hubálek [56]). The procedure was repeated using different values for t,
clustering of search outputs shown in Figure 1. Similar results were obtained in additional experiments using other databases and other types of 2D fingerprint [46].
Combination of Rankings Using Similarity Fusion
The comparisons described by Holliday et al. [44] and by Salim et al. [46] suggest that some of the available coefficients quantify different types of structural resemblance. It hence seems not unreasonable to suggest that enhanced VS performance might result from the use of multiple similarity coefficients, rather than just a single one as is normally the case. This has led us to consider the use of data fusion methods for
combining the results of database searches that use a common reference structure but that use different similarity coefficients.
Data fusion was first developed for use in signal processing and involves combining inputs from multiple sensors [59]; it is now used in a range of application domains [60], with the application to database searching being first identified in the context of textual information retrieval (see, e.g., [61,62]). The use of data fusion for VS is shown in Box 1, where a user-defined reference structure is searched against a database using several different similarity measures, an approach we refer to as similarity fusion; an analogous
approach, called consensus scoring, can be used to combine the results of different search
algorithms and/or scoring functions for ligand-protein docking [63,64]. Typical data-fusion rules include the maximum, the minimum and the sum of the rank positions, P(I,J), allocated to each database-molecule J by each of the similarity measures; in our experiments, we have found that the sum of the rank positions normally gives the best results. The similarity scores, S(I,J), can be used instead of the rank positions that are derived from them; the latter approach involves some loss of information but provides a form of standardisation for the different magnitudes and the different distributions of the scores resulting from different similarity measures [65,66].
Early studies of similarity fusion by Kearsley et al. [40] and by Ginn et al. [65,67]
showed that improvements in screening performance could be achieved when multiple structure representations were used, rather than just a single representation. Our studies have sought to determine whether comparable increases in performance could be achieved using different types of similarity coefficient. We selected 13 coefficients (including all of those in Figure 1) from the 22 studied in the previous comparison, chosen as being representative of the clusters of related coefficients that we had identified as yielding very similar database rankings when used for VS. A series of searches was carried out on the MDL Drug Data Report database (MDDR, available from MDL Information Systems Inc. at http://www.mdli.com) for molecules belonging to seven bioactivity classes (5HT4 agonists, adrenergic β, dopamine agonists, ACE inhibitors, HIV-1 protease inhibitors, benzodiazepine agonists, and lactamase inhibitors) and three different types of 2D fingerprint. Specifically, fused searches were carried out, as shown in Box 1, using all of the IC13 possible combinations for I=1-13 coefficients. The fused
just a single similarity coefficient (i.e., I=1 in the formula for the number of combinations). The results indicate that a good combination of the right number (typically two to four) of coefficients can improve screening performances over searches using a single coefficient and, in particular, over the industry-standard Tanimoto coefficient. However, and unfortunately, there is no one combination which performs equally well on all active classes: indeed, the best-performing combination for one type of activity class often performs poorly in searches for a different type of bioactive molecule. For example, the Tanimoto and Russell-Rao coefficients appeared in many of the best-performing combinations in searches for 5HT4 and benzodiazepine agonists, but in none of the best-performing combinations in searches for dopamine agonists and ACE inhibitors [46].
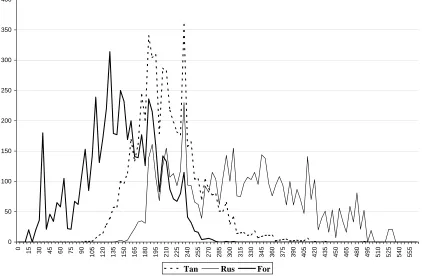
It was disappointing to find that it is not consistently possible to identify some single combination that can be used to boost screening performance in all circumstances. However, this finding led us to seek reasons for the inconsistent behaviour, taking as our starting point a consideration of the sizes of the molecules involved. Specifically, it was noted that there was a marked preference for certain coefficients to perform well when searching for active molecules of a particular size (as reflected in the numbers of bits set in their fingerprints) but to perform less well when the sought molecules were of a different size. As examples of this inherent bias, the Russell-Rao coefficient appeared in many of the best combinations involving larger active molecules while the Forbes coefficient appeared in many of the best combinations involving smaller active molecules. This behaviour is illustrated in Figure 2, which demonstrates the effect of size in searches for 5HT4 agonists averaged over 21 different reference structures. The figure shows the distribution of the numbers of bits set in the top 5% of the ranked MDDR database in searches using the Tanimoto, Forbes and Russell-Rao coefficients. It will be seen that the three coefficients retrieve markedly different sizes of molecule: the Forbes (or Russell-Rao) coefficient has a marked preference for small (or large) molecules whilst the Tanimoto coefficient tends to retrieve molecules from the centre of the size distribution. We have noted previously the effect of molecular size on the performance of the Tanimoto coefficient; this study demonstrated that such size-dependency was a characteristic not just of the Tanimoto but also of other similarity coefficients that might be considered for fingerprint-based VS.
Later work developed a mathematical model relating a coefficient’s degree of bias to the relative sizes (i.e., numbers of bits) of a reference molecule and the database-molecules with which it was being compared [45]. This study also showed that analogous size effects can come into play in algorithms for dissimilarity-based compound selection, which seek to identify molecules that are as dissimilar as possible (whereas VS normally seeks molecules that are as similar as possible) [31,32,34]. For example, it was possible to rationalise previous reports of the tendency of the Tanimoto coefficient to yield structurally diverse database-subsets containing large numbers of small molecules.
unsuccessful, in the sense that it has not been possible to identify a coefficient (or coefficients) with a consistently better level of performance. That said, improvements in VS performance are obtainable, especially when information is available as to the sizes of the molecules that are being sought; in the absence of such information, our extended studies suggest that the Tanimoto remains the coefficient of choice.
Combination of Rankings Using Group Fusion
As discussed thus far, and as summarised in Box 1, data fusion involves combining the rankings (or similarities) that result from searching a database with a single reference structure but with multiple similarity measures. There is, however, an alternative approach to data fusion that was first suggested by Xue et al. [38] and by Schuffenhauer et al. [68]. This approach, which we refer to as group fusion, can be used when several,
structurally-diverse reference structures are available, as may be the case from analysis of published competitor compounds or from the hits in an HTS experiment. The implementation of group fusion is described in Box 2; this is analogous to Box 1, but with two key differences: the reference molecule is allowed to vary and the similarity measure is kept constant; the fusion here involves similarity scores, rather than rank positions, since experiments showed that better results were obtained from combining the similarity scores associated with the molecules in a database, rather than the rank positions associated with those scores (whereas the rank positions tend to perform better for similarity fusion) [49]. In all of our experiments, the measure was based on the Tanimoto coefficient and a 2D fingerprint.
Hert et al. [49] compared several different approaches to VS when a small number of actives, ten in their experiments, are available for analysis, and concluded that the group fusion procedure shown in Box 2 provided a high level of search effectiveness in simulated VS experiments with the MDDR database. These experiments used the so-called MAX fusion rule: if database molecule J has a similarity score of S(I,J) with reference structure I then the fused score is simply the largest of all the scores {S(I,J)}.
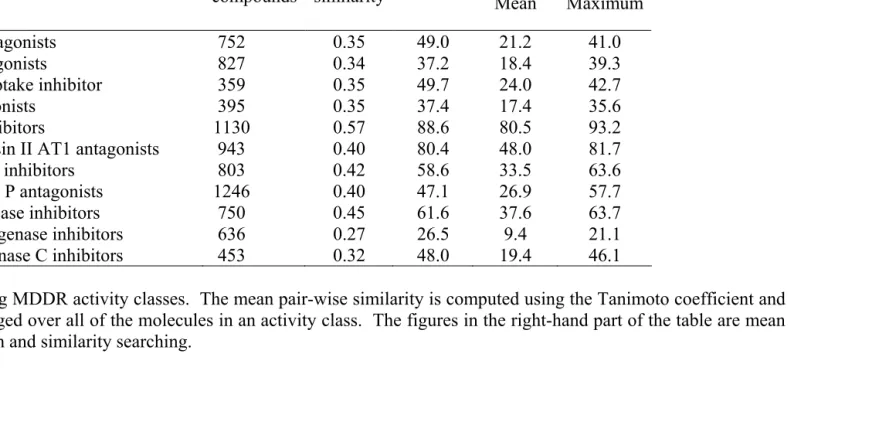
Table 2 summarises the results of MDDR searches for sets of ten, randomly chosen active reference structures; the results here are mean values averaged over ten such sets for each of the eleven activity classes that were chosen for use in the experiments. The table lists the eleven activity classes, the numbers of active molecules and the mean pair-wise similarity for each class (the latter approximating to the degree of structural diversity in the class) and the recall for searches that retrieved the top-5% of the
database. Assume that there is a total of N molecules in the database with the activity of
interest, and that n of these actives are retrieved when a threshold is applied to the ranked
database to retrieve the top-ranked molecules; then the recall is defined to be n/N, i.e., the
homogeneous (e.g., renin and HIV-1 protease inhibitors) while others are structurally diverse (e.g., cyclooxygenase and protein kinase C inhibitors).
The benefits that can be obtained from using multiple reference structures, rather than the single reference structures that characterise conventional similarity searching, were quantified by using every single active molecule in each of the chosen activity classes as the reference structure, and then recording the mean and the maximum recall for these searches, as detailed in the right-hand part of Table 2. The values listed under Mean correspond to the performance that might be expected using a single reference structure and are clearly much lower than the figures for group fusion: in fact, the use of ten actives, rather than just one, typically results in an increase of over two-thirds in the number of actives retrieved. Consider now the figures in Table 2 for the best possible single similarity search, i.e., the figures listed under Maximum. These represent the best single similarity searches possible from the many hundreds of individual bioactive molecules, and it will be seen that they are broadly comparable with those obtained using group fusion: group fusion gives a better average level of performance than does the best-possible similarity search for five of the activity classes, with the converse applying for the other six classes. On average, therefore, picking any ten active reference structures and combining them using group fusion will enable searches to be carried out that are comparable to even the very best conventional similarity search that is possible using a single reference structure. This is a striking result, and one that strongly supports the use of multiple reference structures, if available, for VS.
Inspection of the table shows that the absolute performance of group fusion tends to increase as the self-similarity of the active molecules increases. The correlation with intra-class similarity is not unexpected; what is of importance here is that good screening is obtained even with quite diverse activity classes (such as the protein kinase C inhibitors, the cyclooxygenase inhibitors and the D2 agonists), where conventional similarity searching performs very poorly. It is for these diverse datasets, therefore, that the benefits of group fusion are most evident, when compared to conventional VS. The relationship between relative performance and diversity was analysed in detail by Whittle
et al. [48] and by Hert et al. [51], using activity classes with a wide range of intra-class
similarities. This work demonstrated very clearly that the benefits of group fusion are greatest when the sought actives are structurally diverse; conventional similarity searching or similarity fusion, conversely, are most effective when the actives are strongly clustered in structural space. The two approaches to data fusion would thus appear to be complementary in character.
approach described here would seem to provide a useful addition to the computational tools available for compound selection.
Turbo Similarity Searching
Most recently, the work described above on VS using multiple reference structures has led us to devise a novel, but very simple, way of enhancing the effectiveness of similarity-based VS when just a single reference structure is available [50]. We refer to this approach as turbo similarity searching; a turbocharger increases the power of an
engine by using the engine’s exhaust gases, and turbo similarity searching seeks to increase the power of a search engine procedure by using the reference structure’s nearest neighbours. Turbo similarity searching is based on the general applicability of the similar property principle, which implies that the nearest neighbours of a reference structure possessing some particular biological activity of interest are also likely to possess that activity. This being so, let us assume not just that these nearest neighbours are likely to
be active but that they actually are active; we can then use group fusion (as described
above) to combine the results of similarity searches that use these presumed-active nearest neighbours as the reference structures. The overall search strategy is summarised in Box 3.
The effectiveness of turbo similarity searching was studied using the MDDR datasets described in Table 2, and using both similarity and turbo similarity searches based on each and every one of the 8294 active molecules in the eleven activity classes. In these experiments, the 2D fingerprints were those based on circular substructures in the Pipeline Pilot software (available from Scitegic Inc. at http://www.scitegic.com), and the similarity coefficient was again the Tanimoto. Some of the search results are listed in Table 3, where it will be seen that turbo similarity searching is nearly always superior to similarity searching in its ability to identify active molecules, with some of the increases in performance being really quite marked.
It is perhaps surprising that the best results are generally obtained with the largest number of nearest neighbours, since the more that are used, the greater the number of inactive molecules that are likely to be included in the fusion, i.e., it is less and less likely that the nearest neighbours will be true actives. However, the fact that the average recall does increase, even with 100 nearest neighbours, means that even these molecules continue to provide useful structural information. At still larger numbers of nearest neighbours (200 in our experiments with these data), performance does flatten-off and then starts to decrease [50].
nearest-neighbour molecules still contain sufficient relevant substructures in common with the reference structure to enable the identification of further active molecules. The upper-bound searches (i.e., using the original reference structure and the top-ranked true actives in the group-fusion step) demonstrate the very high level of performance obtainable with full knowledge of the actives. Thus, when a turbo search is carried out, the true actives amongst the nearest neighbours increase performance, whilst the true inactives have little effect, yielding the overall enhancement in performance evident in Table 3.
Conclusions
Similarity searching using 2D fingerprints is one of the simplest VS tools and is thus widely used in the early stages of lead-discovery programmes, when only limited SAR and structural data are available. Its principal function is to identify a few actives that can then form the basis for more detailed VS studies that employ more sophisticated techniques, with by far the most common being pharmacophore mapping and/or docking, as exemplified in Kubinyi’s recent, extensive review of success stories in computer-aided drug discovery [74].
In this paper, we have summarised the principal results of a series of studies that sought to enhance the effectiveness of current systems for similarity-based VS. These studies have shown that: the well-established Tanimoto is the coefficient of choice for computing molecular similarities unless there is specific information about the sizes of the molecules required for testing; that similarity fusion and group fusion provide simple, complementary ways of combining multiple sources of similarity information; and that it is possible to increase search performance by the use of a second-stage search based on the nearest neighbours resulting from an initial similarity-based ranking of the database. We believe that these techniques provide simple and effective ways of enhancing the performance of current systems for similarity-based screening.
Acknowledgements. We thank the following: the Government of Malaysia, the Novartis Institutes for BioMedical Research, and Pfizer Inc. for funding; and Daylight Chemical Information Systems Inc., Digital Chemistry Ltd., MDL Information Systems Inc., the Royal Society, Scitegic Inc., Tripos Inc. and the Wolfson Foundation for data, software and laboratory support.
References
1 Stahura, F.L. and Bajorath, J. (2004) Virtual screening methods that complement high-throughput screening. Combinatorial Chemistry and High-Throughput Screening 7, 259-269
2 Walters, W.P. et al. (1998) Virtual screening - an overview. Drug Discovery Today 3, 160-178 3 Böhm, H.-J. and Schneider, G., eds (2000) Virtual Screening for Bioactive Molecules.,
Wiley-VCH
4 Klebe, G., ed. (2000) Virtual Screening: an Alternative or Complement to High Throughput Screening, Kluwer
6 Carhart, R.E. et al. (1985) Atom pairs as molecular-features in structure activity studies - definition and applications. Journal of Chemical Information and Computer Sciences 25, 64-73 7 Willett, P. et al. (1986) Implementation of nearest-neighbour searching in an online chemical
structure search system. Journal of Chemical Information and Computer Sciences 26, 36-41 8 Leach, A.R. and Gillet, V.J. (2003) An Introduction to Chemoinformatics, Kluwer
9 Gasteiger, J. and Engel, T., eds (2003) Chemoinformatics: A Textbook, Wiley-VCH
10 Willett, P. and Winterman, V. (1986) A comparison of some measures of inter-molecular structural similarity. Quantitative Structure-Activity Relationships 5, 18-25
11 Brown, R.D. and Martin, Y.C. (1996) Use of structure-activity data to compare structure-based clustering methods and descriptors for use in compound selection. Journal of Chemical Information and Computer Sciences 36, 572-584
12 Brown, R.D. and Martin, Y.C. (1997) The information content of 2D and 3D structural descriptors relevant to ligand-receptor binding. Journal of Chemical Information and Computer Sciences 37, 1-9
13 Martin, Y.C. et al. (2002) Do structurally similar molecules have similar biological activities? Journal of Medicinal Chemistry 45, 4350-4358
14 Chen, X. and Reynolds, C.H. (2002) Performance of similarity measures in 2D fragment-based similarity searching: comparison of structural descriptors and similarity coefficients. Journal of Chemical Information and Computer Sciences 42, 1407-1414
15 Sheridan, R.P. et al. (2004) Similarity to molecules in the training set is a good discriminator for prediction accuracy in QSAR. Journal of Chemical Information and Computer Sciences 44, 1912-1928
16 Shanmugasundaram, V. et al. (2005) Hit-directed nearest-neighbor searching. Journal of Medicinal Chemistry 48, 240-248
17 He, L. and Jurs, P.C. (2005) Assessing the reliability of a QSAR model's predictions. Journal of Molecular Graphics and Modelling 23, 503-523
18 Zhang, Q. and Muegge, I. (2006) Scaffold hopping through virtual screening using 2D and 3D similarity descriptors: ranking, voting, and consensus scoring Journal of Medicinal Chemistry 49, 1536-1548
19 Dean, P.M., ed. (1994) Molecular Similarity in Drug Design, Chapman and Hall
20 Willett, P. et al. (1998) Chemical similarity searching. Journal of Chemical Information and Computer Sciences 38 (6), 983-996
21 Nikolova, N. and Jaworska, J. (2003) Approaches to measure chemical similarity - a review. Quantitative Structure-Activity Relationships and Combinatorial Science 22, 1006-1026
22 Bender, A. and Glen, R.C. (2004) Molecular similarity: a key technique in molecular informatics. Organic and Biomolecular Chemistry 2, 3204-3218
23 Matter, H. (1997) Selecting optimally diverse compounds from structure databases: a validation study of two-dimensional and three-dimensional molecular descriptors. Journal of Medicinal Chemistry 40, 1219-1229
24 Schuffenhauer, A. et al. (2000) Similarity searching in files of three-dimensional chemical structures: Analysis of the BIOSTER database using two-dimensional fingerprints and molecular field descriptors. Journal of Chemical Information and Computer Sciences 40, 295-307
25 Makara, G.M. (2001) Measuring molecular similarity and diversity: total pharmacophore diversity. Journal of Medicinal Chemistry 44, 3563-3571
26 Sheridan, R.P. and Kearsley, S.K. (2002) Why do we need so many chemical similarity search methods? Drug Discovery Today 7, 903-911
27 Cruciani, G. et al. (2002) Suitability of molecular descriptors for database mining. A comparative analysis. Journal of Medicinal Chemistry 45, 2685-2694
28 Jenkins, J.L. et al. (2004) A 3D similarity method for scaffold hopping from known drugs or natural ligands to new chemotypes. Journal of Medicinal Chemistry 47, 6144-6159
29 Cramer, R.D. et al. (2004) "Lead hopping". Validation of topomer similarity as a superior predictor of similar biological activities. Journal of Medicinal Chemistry 47, 6777-6791
30 Willett, P. (1987) Similarity and Clustering in Chemical Information Systems, Research Studies Press
32 Ghose, A.K. and Viswanadhan, V.N., eds (2001) Combinatorial Library Design and Evaluation: Principles, Software Tools and Applications in Drug Discovery, Marcel Dekker
33 Downs, G.M. and Barnard, J.M. (2002) Clustering methods and their uses in computational chemistry. Reviews in Computational Chemistry 18, 1-40
34 Gillet, V.J. and Willett, P. (2006, in the press) Compound selection using measures of similarity and dissimilarity. In Comprehensive Medicinal Chemistry
35 Stahura, F.L. and Bajorath, J. (2002) Bio- and chemo-informatics beyond data management: crucial challenges and future opportunities. Drug Discovery Today 7 (11), S41-S47
36 Bajorath, J. (2002) Integration of virtual and high-throughput screening. Nature Reviews Drug Discovery 1, 882-894
37 Godden, J.W. et al. (2000) Combinatorial preferences affect molecular similarity/diversity calculations using binary fingerprints and Tanimoto coefficients. Journal of Chemical Information and Computer Sciences 40, 163-166
38 Xue, L. et al. (2001) Fingerprint scaling increases the probability of identifying molecules with similar activity in virtual screening calculations. Journal of Chemical Information and Computer Sciences 41, 746-753
39 Godden, J.W. et al. (2006) Anatomy of fingerprint search calculations on structurally diverse sets of active compounds. Journal of Chemical Information and Modelling 45, 1812-1819
40 Kearsley, S.K. et al. (1996) Chemical similarity using physiochemical property descriptors. Journal of Chemical Information and Computer Sciences 36, 118-127
41 Sheridan, R.P. et al. (1996) Chemical similarity using geometric atom pair descriptors. Journal of Chemical Information and Computer Sciences 36, 128-136
42 Sheridan, R.P. (2000) The centroid approximation for mixtures: calculating similarity and deriving structure-activity relationships. Journal of Chemical Information and Computer Sciences 40, 1456-1469
43 Sheridan, R.P. (2002) The most common chemical replacements in drug-like compounds. Journal of Chemical Information and Computer Sciences 42, 103-108
44 Holliday, J.D. et al. (2002) Grouping of coefficients for the calculation of inter-molecular similarity and dissimilarity using 2D fragment bit-strings. Combinatorial Chemistry and High-Throughput Screening 5, 155-166
45 Holliday, J.D. et al. (2003) Analysis and display of the size dependence of chemical similarity coefficients. Journal of Chemical Information and Computer Sciences 43, 819-828
46 Salim, N. et al. (2003) Combination of fingerprint-based similarity coefficients using data fusion. Journal of Chemical Information and Computer Sciences 43, 435-442
47 Hert, J. et al. (2004) Comparison of topological descriptors for similarity-based virtual screening using multiple bioactive reference structures. Organic and Biomolecular Chemistry 2, 3256-3266 48 Whittle, M. et al. (2004) Enhancing the effectiveness of virtual screening by fusing nearest
neighbor lists: A comparison of similarity coefficients. Journal of Chemical Information and Computer Sciences 44, 1840-1848
49 Hert, J. et al. (2004) Comparison of fingerprint-based methods for virtual screening using multiple bioactive reference structures. Journal of Chemical Information and Computer Sciences 44, 1177-1185
50 Hert, J. et al. (2005) Enhancing the effectiveness of similarity-based virtual screening using nearest-neighbour information. Journal of Medicinal Chemistry 48, 7049-7054
51 Hert, J. et al. (2006) New methods for ligand-based virtual screening: use of data-fusion and machine-learning techniques to enhance the effectiveness of similarity searching Journal of Chemical Information and Modelling 46, 462-470
52 Flower, D.R. (1988) On the properties of bit string based measures of chemical similarity. Journal of Chemical Information and Computer Sciences 38, 379-386
53 Lajiness, M. (1990) Molecular similarity-based methods for selecting compounds for screening. In Computational Chemical Graph Theory (Rouvray, D., ed.), pp. 299-316, Nova Science Publishers 54 Dixon, S.L. and Koehler, R.T. (1999) The hidden component of size in two-dimensional fragment
descriptors: side effects on sampling in bioactive libraries. Journal of Medicinal Chemistry 42, 2887-2900
56 Hubálek, Z. (1982) Coefficients of association and similarity, based on binary (presence-absence) data: an evaluation. Biological Reviews of the Cambridge Philosophical Society 57, 669-689 57 Gower, J.C. and Legendre, P. (1986) Metric and Euclidean properties of dissimilarity coefficients.
Journal of Classification 5, 5-48
58 Everitt, B.S. et al. (2001) Cluster Analysis, Edward Arnold
59 Hall, D.L. (1992) Mathematical Techniques in Multisensor Data Fusion, Artech House
60 Klein, L.A. (1999) Sensor and Data Fusion Concepts and Applications, SPIE Optical Engineering Press
61 Belkin, N.J. et al. (1995) Combining the evidence of multiple query representations for information retrieval. Information Processing and Management 31, 431-448
62 Hsu, D.F. and Taksa, I. (2005) Comparing rank and score combination methods for data fusion in information retrieval. Information Retrieval 8, 449-480
63 Charifsen, P.S. et al. (1999) Consensus scoring: a method for obtaining improved hit rates from docking databases of three-dimensional structures into proteins. Journal of Medicinal Chemistry 42, 5100-5109
64 Clark, R.D. et al. (2002) Consensus scoring for ligand/protein interactions. Journal of Molecular Graphics and Modelling 20, 281-295
65 Ginn, C.M.R. et al. (2000) Combination of molecular similarity measures using data fusion. Perspectives in Drug Discovery and Design 20, 1-16
66 Wang, R. and Wang, S. (2001) How does consensus scoring work for virtual library screening? An idealized computer experiment. Journal of Chemical Information and Computer Sciences 41, 1422-1426
67 Ginn, C.M.R. et al. (1997) Similarity searching in files of three-dimensional chemical structures: evaluation of the EVA descriptor and combination of rankings using data fusion. Journal of Chemical Information and Computer Sciences 37, 23-37
68 Schuffenhauer, A. et al. (2003) Similarity metrics for ligands reflecting the similarity of the target proteins. Journal of Chemical Information and Computer Sciences 43, 391-405
69 Patel, Y. et al. (2002) A comparison of the pharmacophore identification programs: Catalyst, DISCO and GASP. Journal of Computer-Aided Molecular Design 16, 653-681
70 Warr, W.A. and Willett, P. (1997) The principles and practice of 3D database searching. In Designing Bioactive Molecules: Three-Dimensional Techniques and Applications (Martin, Y.C. and Willett, P., eds.), pp. 73-95, American Chemical Society
71 Cramer, R.D. et al. (1974) Substructural analysis. A novel approach to the problem of drug design. Journal of Medicinal Chemistry 17, 533-535
72 Chen, X. et al. (1998) Recursive partitioning analysis of a large structure-activity data set using three-dimensional descriptors. Journal of Chemical Information and Computer Sciences 38, 1054-1062
73 Harper, G. et al. (2001) Prediction of biological activity for high-throughput screening using binary kernel discrimination Journal of Chemical Information and Computer Sciences 41, 1295-1300
Coefficient Expression
c b a
c
− + Tanimoto
ab c
Cosine
c b
a+ −2
Hamming
m c
Russell-Rao
ab cm
[image:14.612.94.317.107.345.2]Forbes
Table 1. Similarity coefficients for use with 2D fingerprints. Assume that two
molecules, A and B, are represented by binary fingerprints containing a total of m bits;
assume further that a (or b) of the bits are set to one in the fingerprint for A (or B) and
that c of the bits are set to one in both of the fingerprints (i.e., the logical AND of the two
Similarity searching
Activity class name Number of active
compounds
Mean pair-wise similarity
Group fusion
Mean Maximum
5HT3 antagonists 752 0.35 49.0 21.2 41.0
5HT1A agonists 827 0.34 37.2 18.4 39.3
5HT Reuptake inhibitor 359 0.35 49.7 24.0 42.7
D2 antagonists 395 0.35 37.4 17.4 35.6
Renin inhibitors 1130 0.57 88.6 80.5 93.2
Angiotensin II AT1 antagonists 943 0.40 80.4 48.0 81.7
Thrombin inhibitors 803 0.42 58.6 33.5 63.6
Substance P antagonists 1246 0.40 47.1 26.9 57.7
HIV protease inhibitors 750 0.45 61.6 37.6 63.7
Cyclooxygenase inhibitors 636 0.27 26.5 9.4 21.1
[image:15.612.164.637.128.339.2]Protein kinase C inhibitors 453 0.32 48.0 19.4 46.1
Table 2. Simulated VS using MDDR activity classes. The mean pair-wise similarity is computed using the Tanimoto coefficient and
Turbo similarity searching Top-100 inactive NNs
Activity class Similarity
searching
10 NNs 20 NNs 100 NNs
Reference and top-100 active
NNs
5HT3 antagonists 31.7 36.8 38.6 44.0 65.7 32.1
5HT1A agonists 26.3 29.6 31.8 36.2 55.3 31.9
5HT reuptake inhibitors 21.6 24.0 23.8 24.1 62.8 21.7
D2 antagonists 25.1 26.9 27.5 30.3 68.6 28.8
Renin inhibitors 90.4 92.1 93.1 94.7 96.6 89.8
Angiotensin II AT1 antagonists 77.4 83.5 86.7 92.0 95.2 92.2
Thrombin inhibitors 44.5 47.1 48.3 50.7 71.6 33.9
Substance P antagonists 28.6 31.7 32.2 34.1 53.8 15.8
HIV protease inhibitors 51.6 52.6 53.3 55.2 76.1 49.0
Cyclooxygenase inhibitors 13.7 15.0 15.3 14.4 49.2 12.0
Protein kinase C inhibitors 21.0 21.1 21.1 20.6 58.1 18.3
[image:16.612.107.691.127.354.2]Average over all classes 39.2 41.9 42.9 45.1 68.4 38.7
Table 3. Simulated VS using MDDR activity classes. Mean recall at 5% for similarity searching with just a single reference
Figure 1. Typical clustering of similarity coefficients using the group average hierarchic
0 50 100 150 200 250 300 350 400
0 15 30 45 60 75 90
[image:18.612.96.518.84.360.2]105 120 135 150 165 180 195 210 225 240 255 270 285 300 315 330 345 360 375 390 405 420 435 450 465 480 495 510 525 540 555 Tan Rus For
Figure 2. Distribution of number of bits set in the top-ranked 5% of the molecules,
averaged over 21 searches of a subset of the MDL Drug Data report database for 5HT4 agonists. The molecules are characterised by Unity 2D fingerprints and the searches use the Tanimoto, Russell-Rao and Forbes coefficients. Reprinted with permission from Salim, N. et al. (2003) Combination of fingerprint-based similarity coefficients using data fusion. Journal of Chemical Information and Computer Sciences 43, 435-442. Copyright
For each similarity measure, I
Compute the similarity, S(I,J), between R and each database-molecule J Rank the database in decreasing order of the similarity scores
Note the rank position, P(I,J) corresponding to S(I,J) for each database-molecule Combine the set of rank positions {P(I,J)} for each molecule J to give a new fused score Rank the database in decreasing order of the fused scores.
Box 1. Combination of multiple database rankings using a fixed reference structure, R,
and using similarity fusion of rank positions.
For each reference molecule, I
Compute the similarity, S(I,J), between I and each database-molecule J Combine the set of similarities {S(I,J)} for each molecule J to give a new fused score Rank the database in decreasing order of the fused scores.
Box 2. Combination of multiple database rankings using group fusion of similarity
scores.
Compute the similarity, S(R,J), between the reference structure Rand each database-moleculeJ
Identify the nearest neighbours of R For each such nearest neighbour, I
Compute the similarity, S(I,J), between I and each database-molecule J
Combine the set of similarities {S(R,J),{S(I,J)}} for each molecule J to give a new fused score
Rank the database in decreasing order of the fused scores