This is a repository copy of The differing perspectives of road users and service providers .
White Rose Research Online URL for this paper: http://eprints.whiterose.ac.uk/2005/
Article:
Bonsall, P.W., Beale, J.R., Paulley, N. et al. (1 more author) (2005) The differing
perspectives of road users and service providers. Transport Policy, 12 (4). pp. 334-344. ISSN 0967-070X
https://doi.org/10.1016/j.tranpol.2005.05.001
[email protected] https://eprints.whiterose.ac.uk/ Reuse
See Attached Takedown
If you consider content in White Rose Research Online to be in breach of UK law, please notify us by
White Rose Research Online
http://eprints.whiterose.ac.uk/Institute of Transport Studies University of Leeds
This is an author produced version of a paper published in Transport Policy. This paper has been peer-reviewed but does not include final publisher
proof-corrections or journal pagination.
White Rose Research Online URL for this paper: http://eprints.whiterose.ac.uk/2005/
Published paper
Bonsall, P.W.; Beale, J.R.; Paulley, N.; Pedler, A. (2005) The differing perspectives of road users and service providers. Transport Policy, 12(4), pp.334-344.
THE DIFFERING PERSPECTIVES OF ROAD USERS AND SERVICE PROVIDERS
Peter Bonsall1, Jo Beale2, Neil Paulley3 and Annette Pedler3
Proof version of paper published in
Transport Policy, Volume 12 (4), pp 334-344, July 2005
1
Institute for Transport Studies, University of Leeds, Leeds, LS2 9JT, [email protected]
2
now at Cardiff Business School, Aberconway Building, Colum Drive, Cardiff CF10 3EU, UK
3
TRL, Crowthorne House, Nine Mile Ride, Wokingham, Berks, RG40 3GA , UK.
Corresponding Author is Peter Bonsall , [email protected] 0113 3435335
ABSTRACT
A survey of almost 3000 people gathered evidence on people’s experiences of problems on Britain’s roads, their level of support for potential solutions, and on the different perspectives of transport professionals. An assessment was made of the steps required to reduce gaps between users’ expectations and their current experience. Questions raised by the findings include: the likelihood that current policy priorities are influenced by inaccurate assumptions about what the public would find
acceptable; the potentially misleading impressions created by vicarious opinions; the need to re-weight survey responses to correct for differential response rates; and the role of public opinion, media pressure and professional judgement in the political decision-making process.
ACKNOWLEDGEMENTS
The authors would like to thank the Rees Jeffreys Road Fund for funding this study and individual members of the steering group for their useful comments and
1. INTRODUCTION
1.1. Background
The UK Government’s Ten Year Plan for transport (DETR, 2000) constituted an ambitious programme of investment (over £180 billion), which sought to improve the conditions for all users of Britain’s roads. Its development was undertaken in the light of a number of previous policy ‘visions’, including the Transport White Paper (DETR, 1998). These visions had been developed during the 1990s following the involvement of politicians, professionals and the public in a series of consultations. The White Paper built on the idea that there was a consensus on the nature of the problems and on the appropriate way forward (Goodwin et al, 1991). The Ten Year Plan identified several key challenges and highlighted improvements that would help alleviate many of the problems with the British transport system.
By 2001/2 it was becoming clear that progress towards some of the targets was
somewhat halting and criticism of the Ten Year Plan was becoming more voluble. The criticisms included arguments relating to the definition or vagueness of some of the targets (Goodwin, 2001; House of Commons Transport Committee, 2002), a concern that progress towards some targets was disappointing (CfIT, 2002), an unease that key policies might not be deliverable (Glaister, 2001) and, of particular relevance to this paper, a concern that some of the aspirations of the Plan might be out of step with public opinion. Cracks had begun to appear in the consensus which had been proclaimed in the White Paper.
It was against this background that the Rees Jeffreys Road Fund commissioned ITS and TRL to study the extent to which existing transport policies and investments reflect the aspirations of road users. The investigation, entitled ‘Enhancing the road travel experience’, was to gather evidence on people’s experiences and expectations of their travel by road, whether as drivers, passengers, pedestrians or cyclists; to establish how well transport professionals understand and meet these expectations; to identify any gaps between users’ expectations and their current experience; and to determine what steps can be taken in order to reduce those gaps. The intention was to identify potential solutions, examine the barriers to their implementation, and to identify research or development required to overcome those barriers. The project was to comprise of four core elements – a comprehensive literature review, new surveys, a review of the barriers to implementing solutions and research needs, and a workshop attended by the sponsors and other transport professionals.
1.2 Previous work
A review of past surveys, which is reported more fully elsewhere (Pedler et al, 2002), was conducted to identify existing evidence on UK citizens’ experiences of, and aspirations for, road travel. A subsequent review, by Huang et al (2004), has focussed on the international literature.
that, while car ownership in the UK is currently below the European average (AA, 2000), most people are now highly dependent on car travel (Anable, 2005). It is suggested that Britain has become a congestion-expectant and congestion-tolerant society, with motorists routinely allowing for delays and becoming increasingly resistant to increases in the cost of motoring (RAC, 2002). The negative aspects of car travel are perceived as ‘infinitely preferable to the public transport on offer’ (The Guardian, 16/9/02); the AA’s Great British Motorist Survey (2000) showed that more that four fifths of motorists never use buses or coaches, and three quarters never use rail or the underground. A similar proportion would find it very difficult to adjust to a lifestyle without the car (AA, 2000). The CfIT report on traveller attitudes (CfIT, 2001) is one of the relatively few studies to examine the attitudes of public transport users, pedestrians and cyclists as well as car users. It reports that half of the
population say that they would travel less by car if the local bus services were better, a third if local rail services were better, and a quarter if local conditions for walking were better. It also reported that nearly half the population say that they would cycle more if the roads were safer.
Surveys have suggested a general dissatisfaction with the price, safety and reliability of public transport and a tendency to exaggerate problems with staff attitudes, frequency, availability of seats and cleanliness of vehicles. Peoples’ attitudes to cycling are varied and often relate to lifestyle, life stage, environmental factors and societal norms, but in general the low status of cycling is a major dissuasive factor for many adults (Finch and Morgan, 1995). Aspects most often perceived as a problem by non-cyclists were the weather, traffic on the route, lack of cycle routes or lanes, and danger from motor vehicles (Davies et al, 1997). The limited literature relating specifically to peoples’ perceptions of walking identify traffic, uneven/narrow pavements and lack of crossing facilities as major problems for pedestrians (eg HMSO, 1987). Other problems perceived in the pedestrian environment include crowded pavements, hills, kerbs and steps. The key aspiration of the public regarding walking appears to be safety and the creation of quality walking environments
(Sharples and Fletcher, 2000; DETR, 1999).
In terms of freight, the perceptions of both freight operators and freight drivers are important, although freight drivers’ opinions seem to have been largely ignored in the literature. Congestion, especially during peak hours, is perceived as the key problem for freight drivers, and is the second major concern for freight operators after diesel duty. Truck drivers support road network improvements and off-peak truck deliveries while the freight industry are generally supportive of actions to reduce congestion such as kerbside loading and unloading facilities (another aspect perceived as inadequate), more night deliveries and priority schemes for freight (Lex Transfleet, 2002).
1.3. Research gaps revealed by the review of past surveys
questions, in sample construction, and in the extent to which corrections have been made to reflect response biases. Unfortunately, but not atypically (Bonsall, 2004), it can be rather difficult to discover the precise phrasing of questions or details of the sampling or re-weighting procedures. It was therefore concluded that, in this new work, particular effort should be devoted to exploring the effect of the precise wording of the question and of re-weighting to overcome response biases. A particular issue in question phrasing was whether people should be asked about problems which they experience themselves or whether it is acceptable to seek, as did the HMSO(1987) survey conducted by MORI, to ask about problems which they believe to be important. The importance of this distinction has been noted in previous research in other fields (Festinger, 1954; Taylor et al, 1986; Taylor and Lobel, 1989; Goethals et al, 1991). A particular issue in the re-weighting of results is the need to correct for any tendency to under-represent the attitudes of groups who are less likely to respond to surveys.
In addition to these “technical” issues, the literature review revealed the need to fill certain gaps in the coverage of previous surveys – notably of the problems perceived by drivers and operators in the bus and freight industry, the ranking of problems and priorities by service providers, and to provide a comparison between the opinions of professionals involved in the provision of road transport infrastructure and those of the general public.
2. STUDY METHODOLOGY
Four questionnaires were designed to gather information on the experiences and opinions of road users (the general public, freight and bus drivers) and of service providers (local and national government and its agents).
2.1. The general public survey
This survey, which was designed and implemented by ITS, aimed to identify the problems people perceive as being the most serious on Britain’s roads (both for themselves and for users in general), to establish which remedial measures receive most support and by whom, and to seek explanations for any differences in
perceptions and aspirations.
Prior to designing the questionnaire, a series of focus groups, telephone interviews and face-to-face interviews were conducted with 72 members of the public to explore users’ assessment of and aspirations for travel by road, and to identify and confirm the key public concerns about road travel. Following in-depth qualitative analysis of people’s responses, a questionnaire was designed and extensively piloted using different questions, phrasings and layouts (see
http://www.its.leeds.ac.uk/projects/roaduserattitudes/ for the final version). In addition to collecting information about the respondent and their use of the road network, the final questionnaire included questions on:
• their perception of problems affecting users of the road network;
• their attitude to various potential solutions to those problems (the list of solutions included all those which had received significant levels support during the piloting but, in order to keep the length of the questionnaire within reasonable limits, those which had received near universal support, or for which the level of support could be deduced from it appearing as a high-ranked problem, were excluded (as an example of the latter; if ‘high cost of travel’ were to be a high ranked problem, it could be deduced that ‘reduce cost of travel’ would receive significant support).
The aim was to conduct the survey in locations of the UK which, between them, would cover a wide range of areas in terms of settlement pattern, road network configuration and economic conditions. After considering a number of possibilities, nine areas were selected: the London boroughs of Croydon and Clapham; the cities of Leeds, Cardiff, Leicester, Norwich and Exeter; the area around Ayr; and various locations in Powys.
Fourteen thousand names were randomly selected from the electoral rolls of wards in the nine areas. The questionnaires, together with a letter explaining the purpose of the survey and offering a £200 prize draw among those who completed the questionnaire, were sent to named individuals between April and June 2003. This produced 2695 completed questionnaires - an overall response rate of 19.4%. This response rate was quite good for a survey of this type but obviously raises the issue of the
representativeness of the responding sample.
The demographic profile and travel characteristics of the responding sample are reported elsewhere (Beale and Bonsall, 2004) but it is important at this stage to note that the profile of the respondents was representative of the UK population as a whole except in respect of their car availability (89.9% of respondents had access to a car whereas the UK figure in the 2001 Census is 72.6%) and educational background (34.8% of respondents were educated to degree level whereas the 2001 Census shows the UK figure to be 19.6%). In order to correct for the over-representation of people with cars available and of graduates, the survey results were re-weighted1 to reflect the UK population as a whole.
2.2. Survey of transport professionals
1
A dummy regression was used to establish, for the answer to each question, the marginal contribution associated with car availability and with being a graduate and then applying the resulting coefficients to a new population which reflected the UK population in terms of its car availability and proportion of graduates. The number of people in each cell in a 2x2 matrix of car availability (0,1) x graduate (0,1) for the UK as a whole was estimated from joint probabilities derived from the responding population which were adjusted, using Furness iteration, to match 2001 Census control totals. The responses of people in each cell of the matrix were estimated for each question using the appropriate regression coefficients, and the mean value for each question for the entire UK population was then estimated by allowing for the proportion of people in each cell.
This survey aimed to gather the necessary information to draw a comparison between the opinions of professionals and end users. To achieve this, it sought transport professionals’ perception of:
• problems experienced by road users;
• their employers’ support for specified solutions;
• their personal support for solutions to problems on Britain’s roads; and • their perception of barriers to implementing these solutions.
To make accurate comparisons between the opinions of transport professionals and those of the public, the same list of problems and remedial measures was used in the professionals’ survey as had been used in the public survey.
The sample was drawn by TRL using a broad definition of ‘transport professionals’. Of the eighty-five questionnaires sent out during December 2003 to twenty-one transport organisations, twenty-four questionnaires were returned from employees of local authorities, five from employees of national government and two from
employees of transport research bodies. The overall response rate was 36.7%. This is a relatively small sample but there is no a priori reason to believe that it is not
representative.
2.3. Surveys of drivers and operators in the freight and bus industries
The objectives of these surveys were to:
• identify any gaps between expectation and experience of road travel attributes in the freight and bus industries;
• establish the importance of different characteristics of the road network for enhancing road freight and bus travel; and
• highlight the priorities for improvement in the road network
The questionnaires, developed by TRL, contained both qualitative and quantitative elements. The qualitative component was used to collect detailed opinions from respondents. The quantitative element was based on the SERVQUAL instrument (Parasuraman et al 1985,1988), which is a broad based instrument of quality evaluation that can be applied across a range of service industries. It requires respondents to rate five aspects of service (tangibility, reliability, responsiveness, assurance and empathy). Data was collected from 16 freight drivers, 2 freight
operators, 12 bus drivers and 6 bus operators either face-to-face, over the phone or by a self-completion questionnaire, whichever method was appropriate given the location and shift patterns of the respondent.
2.4. The workshop and analysis of policy implications
Initiatives were identified which might help reduce each of the problems which had been identified by the road users. Particular emphasis was placed, during the workshop and in the subsequent analysis, on the political, financial, operational, technical and attitudinal barriers to the implementation of solutions.
3. SURVEY RESULTS
This section reports the main perceived problems and most preferred remedial measures as identified by each of the sample groups. More detailed analyses of these results can be found in other reports from this project (Pedler and Tual, 2003; Beale and Bonsall, 2003, 2004). The results from the survey of the general public are based on a large sample (2695) and have been re-weighted to correct for non-response bias. The results from the survey of transport professionals, and of freight/bus operators and drivers, are based on much smaller samples and cannot be assumed to be fully representative.
3.1. Perceived problems
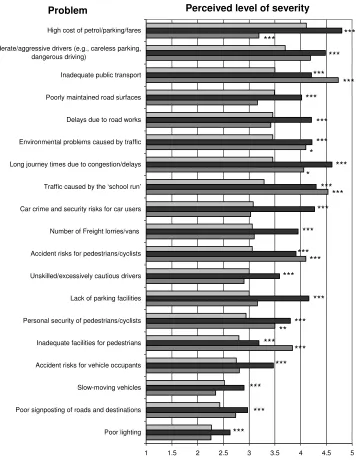
Figure 1 charts the perception of problems by the public (distinguishing between their perception of the problems which affect them personally and those affecting road users in general) and by transport professionals. Respondents had been asked to indicate whether the issue was 1 “not a problem”, 2 “minor problem”, 3 ”significant problem - sometimes”, 4 “significant problem - most of time”, 5 “very significant problem - sometimes”, or 6 “very significant problem - most of time”.
The problems perceived by the general public as being the most serious from their own experience were, in descending order after re-weighting to reflect the
characteristics of the UK population: the high cost of travel; inconsiderate/aggressive drivers; inadequate public transport; poorly maintained road surfaces; and, in equal fifth place congestion/delays, environmental problems and delays due to road works. The problems they perceived as being the most serious ‘for users of Britain’s roads’ were, again in descending order and after re-weighting: the high cost of travel, congestion/delays, inconsiderate/aggressive drivers, traffic caused by the school run, and car crime.
Detailed analysis, not shown in Figure 1 but reported elsewhere (Beale and Bonsall, 2003, 2004), revealed that the perception of problems appeared to vary depending on the respondents’ gender, age, car availability, residential location and educational background. Females tended to report experiencing problems with issues relating to safety and personal security whereas males claimed particular problems with issues that impede progress on the road. Respondents under 40 tended to report experiencing more problems than those over 60 but the over 60s were more likely to report
problems with aspects, such as excessive freight vehicles, poor road surfaces, poor lighting and poor signposting, that make driving difficult. Non-car drivers,
experiencing fewer problems than non-graduates but they actually reported more problems with environmental issues and inadequate public transport. These differences are important and highlight the importance of working with a sample which is, or has been re-weighted to become, representative of the target population.
The sample of transport professionals considered that the main problems for road users were inadequate public transport, traffic caused by the ‘school run’,
[image:10.595.139.495.255.717.2]inconsiderate/aggressive drivers, environmental problems caused by traffic, accident risks for pedestrians/cyclists and long journey times due to congestion or delays.
Figure 1: Perception of problems on UK roads by the public and transport professionals
1 1.5 2 2.5 3 3.5 4 4.5 5
Poor lighting Poor signposting of roads and destinations Slow-moving vehicles Accident risks for vehicle occupants Inadequate facilities for pedestrians Personal security of pedestrians/cyclists Lack of parking facilities Unskilled/excessively cautious drivers Accident risks for pedestrians/cyclists Number of Freight lorries/vans Car crime and security risks for car users Traffic caused by the ‘school run’ Long journey times due to congestion/delays Environmental problems caused by traffic Delays due to road works Poorly maintained road surfaces Inadequate public transport Inconsiderate/aggressive drivers (e.g., careless parking,
dangerous driving)
High cost of petrol/parking/fares
Problem Perceived level of severity
Public (for you personally) Public (for users in general) Transport professional *** *** *** *** *** *** *** *** * *** * *** *** *** *** *** *** *** *** *** ** *** *** *** *** *** ***
The main problems perceived by the small sample of freight operators and drivers were: congestion, poor maintenance and lack of parking facilities for freight vehicles, while bus industry personnel reported that the main problems were congestion, the urban network being unsuitable for buses, inappropriate land-use layout and poor pedestrian access.
Differences between the perceptions of problems by the different groups are highlighted and discussed in section 4.1.
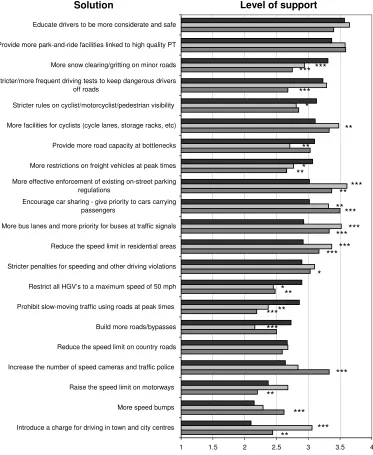
3.2. Solutions
Figure 2 shows the level of support for each of a series of remedial measures that was forthcoming from the public, from transport professionals and, based on the opinions of transport professionals employed in the public sector, from national and local government. Respondents were asked to indicate whether they would 1 “strongly oppose”, 2 “not support”, 3 “support”, or 4 “strongly support” twenty-one remedial measures aimed at reducing problems on Britain’s roads.
Before drawing conclusions from the results in Figure 2, it is important to recall that a number of remedial measures which the pilot surveys had shown to be
overwhelmingly popular with the general public were excluded from the
questionnaire in order to reduce respondent burden. They were: Carry out road works during off-peak times; Ensure better layout of road works to minimise obstruction; Encourage shop deliveries to be made at night; Transport more freight by rail; and Provide more funds to improve the quality and capacity of buses and trains. It can be assumed that these measures would retain their predominance and they should be considered as highly popular solutions although they do not appear in Figure 2. It is similarly important to note that, on the basis of results shown in Figure 1, it can be deduced that the public would give high levels of support to measures which managed to: Decrease the cost of driving; Reduce the price of public transport; Increase the number of parking spaces; and, to a slightly lesser extent, Improve facilities for pedestrians.
Figure 2 shows that the other measures receiving high levels of support from the general public were: Educate drivers to be more considerate and safe; Provide more park-and-ride facilities linked to high quality public transport; and Introduce more snow clearing/gritting on minor roads. Contrary to popular media portrayals, these new results suggest that there is a reasonable amount of public support for car
management and control measures. Interventions receiving a mean value greater than 2.5 (thus, on balance, receiving support) include stricter/more frequent driving tests to keep dangerous drivers off the roads, more effective enforcement of existing on-street parking regulations, stricter penalties for speeding and other driving violations and increasing the number of speed cameras and traffic police. Interestingly, one measure which is often portrayed as receiving public support, raising the speed limit on
motorways, did not reach the 2.5 point.
restrictions on slow-moving traffic while their rural-dwelling counterparts would welcome more snow clearing/gritting on minor roads (see Beale & Bonsall, 2003 or 2004, for further details of these findings).
Figure 2: Level of support the public, transport professionals and transport organisations gave for different solutions
1 1.5 2 2.5 3 3.5 4
Introduce a charge for driving in town and city centres More speed bumps Raise the speed limit on motorways Increase the number of speed cameras and traffic police Reduce the speed limit on country roads Build more roads/bypasses Prohibit slow-moving traffic using roads at peak times Restrict all HGV’s to a maximum speed of 50 mph Stricter penalties for speeding and other driving violations Reduce the speed limit in residential areas More bus lanes and more priority for buses at traffic signals Encourage car sharing - give priority to cars carrying
passengers
More effective enforcement of existing on-street parking regulations
More restrictions on freight vehicles at peak times Provide more road capacity at bottlenecks More facilities for cyclists (cycle lanes, storage racks, etc) Stricter rules on cyclist/motorcyclist/pedestrian visibility Stricter/more frequent driving tests to keep dangerous drivers
off roads
More snow clearing/gritting on minor roads Provide more park-and-ride facilities linked to high quality PT Educate drivers to be more considerate and safe
Solution Level of support
Public (for you personally ) Transport Professionals Transport Organisations *** *** *** * ** ** *** *** ** *** ** ****** *** *** * *** ***** *** *** ** *** *** **
Significantly different ( * at p <0.05; ** at p <0.01; *** at p <0.001) from importance score given by public("for you personally") using related T test.
Sample sizes: 2695 members of the public; 31 transport professionals and 31 transport organisations
public transport; Provide more bus lanes and more priority to buses at signals; and Provide more facilities for cyclists.
The solutions that transport professionals thought would be most supported by their employers were: Provide more park-and-ride facilities linked to high quality public transport; Encourage car sharing; Educate drivers to be more considerate and safe; Provide more effective enforcement of on-street parking regulations; Provide more bus lanes and more priority to buses at signals; Provide more facilities for cyclists; and Increase the number of speed cameras and traffic police.
The solutions receiving particular support from the small sample of freight operators and drivers were: building more/better roads (particularly local access roads); providing better advance warning of congestion; planning road maintenance more effectively; improving parking facilities for freight; and providing more priority for freight vehicles. Bus industry personnel said they would welcome more bus priority, more facilities for bus users, and greater involvement of the bus industry in the planning of road networks and layouts.
4. DISCUSSION
4.1. Differences between the different sample groups
The four surveys each provide different perspectives on the seriousness of problems on Britain’s roads and on what might be done to overcome them. To some extent the differences are as expected: the freight industry is worried about congestion and lack of parking facilities for freight and would welcome more roads; the bus industry is concerned about the lack of provision for buses and would like more encouragement of bus use and to become more involved in infrastructure and planning; the general public are worried about the high cost of transport and inadequate public transport; and professionals are concerned with congestion and environmental problems and favour the use of demand management solutions. Nonetheless, the differences, many of which are significant, do raise important questions regarding whose opinions count or should count when developing policies, and the extent to which road policy should reflect road users’ wishes. These questions are, of course, essentially political but, even though political decision makers have a duty to lead rather than follow, problems are likely to arise if they, or their advisors, misinterpret road user opinion.
4.1.1. Differences among the general public
pattern whereby people’s over-estimation of the seriousness of problems was
particularly marked for issues, such as car crime, congestion, and the school run, that tend to receive a lot of media coverage. Since people tend to form opinions about the experiences of others on the basis of what they see, read or hear in the mass media (Rule and Ferguson, 1986; Silverstein et al, 1986), and since the views expressed in the media tend to reflect the fact that bad news sells better than good, there will be a tendency for people to believe that other people are worse off than they really are. Such bad news is also likely to stick in people’s minds given the tendency to recall negative rather than positive information (Robinson-Riegler and Winton, 1996). It is clearly important to consider the powerful influence of the media when interpreting survey data of this kind and perhaps to consider how to correct for it.
The survey among the general public revealed differences in the opinions of different types of people. Significant differences were associated with factors such as gender, age, car ownership, residential location and educational background. To some extent these differences simply reflect the different incidence of problems in different communities but they also seem to reflect different value systems – for example, although graduates tend to have higher incomes and car availability than non-graduates, it is the graduates who express greatest concern about inadequate public transport. These findings show that it would be inappropriate to assume a national consensus on problems and solutions. They also emphasise the importance of re-weighting the raw data to ensure that it is representative of the population whose views are being canvassed.
The analysis revealed the particular importance of re-weighting the sample to make it representative in respect of the respondents’ educational background. This correction is necessitated by the combination of two tendencies; the fact that more educated people are more likely to reply to surveys (Rosenthal and Rosnow, 1975; Green, 1996) and the tendency (Beale and Bonsall, 2004) for such people to have greater concern for environmental problems and inadequate public transport. In combination, these two tendencies will over-represent the public concern for such societal issues. No previous surveys of transport attitudes seem to have corrected for this effect.
4.1.2. Differences between the concerns of transport professionals and those of the general public.
As illustrated in Figure 1, the views expressed by the sample of transport
The transport professionals’ different rating of problems may reflect their belief that the public’s opinion is not a reliable guide to the ‘real’ importance of different issues. However, given that the professionals were asked to rate the importance of each issue ‘for users of Britain’s roads’, the differences should perhaps be a source of some concern. The differences are particularly worrying if, as the evidence above suggests, their model of public opinion may have been unduly influenced by media campaigns, by current policy priorities, or by survey results which have not been adjusted to remove the over-representation of educated opinion.
4.1.3 Differences between the general public’s opinion on solutions, those of transport professionals, and those ascribed to government.
As can be seen in Figure 2, the general public’s prioritisation of some solutions tended to differ markedly from those of the sample of transport professionals. The public gave much less support than did the professionals to measures which would target or restrict car use or which were designed to promote alternatives to car use; the solution producing the greatest divergence of opinion was the introduction of a charge for driving in town and city centres, but others which received significantly more support (at p<0.001) from the professionals than from the general public included increased bus priority, more effective parking enforcement, encourage car sharing, more facilities for cyclists and reduced speed limits in residential areas. On the other hand, building more roads, more slow clearing, providing more road capacity at
bottlenecks, more restrictions on freight and slow-moving vehicles and stricter rules on cyclist/motorcyclist/pedestrian visibility received significantly more support (some at p<0.001, all at p<0.05) from the public than from the professionals. It seems that the professionals tend to favour measures that restrict and control car use while, in comparison, the public would welcome interventions that facilitate car use.
The transport professionals generally ascribe similar levels of support to the
government organisations which employ them as they report on their own behalf, but it is interesting to examine the six cases where they expected the level of government support to be significantly lower, or higher, than their own. They expected
Figure 2 shows considerable support for some solutions from all three groups;
educating drivers to be more considerate and safe; stricter penalties for speeding and other driving violations; reducing the speed limit on country roads; and providing more park-and-ride facilities linked to high quality public transport all received universal support and so lack of support cannot be suggested as a reason for lack of action on these solutions. Interestingly introducing more speed bumps and raising the speed limit on motorways attracted relatively little support from the public or the sample of professionals even though speed bumps have, until recently, been fairly high on local authority agendas and an increase in motorway speed limits is being widely canvassed.
4.2 Barriers to implementing solutions and priorities
The analysis highlighted forty-seven solutions that could help reduce the problems identified by the survey respondents. Space restrictions preclude a detailed discussion of all these solutions or of all the potential political, financial, operational or technical barriers to their implementation. Attention should be drawn, however, to the
predictable problem of limited finance, the increasingly serious problems due to the shortage of suitably qualified personnel and the institutional barriers occasioned by the structure of local authorities and the public transport sector (see Beale et al, 2004, for fuller discussion of these).
This section focuses instead on the political decision to rule-out or down-play solutions which are thought to be unacceptable to the public – the so called public acceptance barrier. Despite receiving widespread support among transport
professionals, the public are generally opposed to the introduction of a charge to drive in town and city centres. Indeed, in view of the public concern over existing “high costs” of travel, any attempt to increase the cost of car journeys is likely to be politically difficult – as witnessed by the recent referendum in Edinburgh which rejected the proposed introduction of road charging in that city. The government’s recognition of the unpopularity of price increases has led them to emphasise (e.g. DfT, 2004), that the introduction of a national distance-based road charge is only being considered in conjunction with a reduction in other motoring costs.
The survey results suggest a reasonable level of public support for traffic management and control measures such as stricter penalties for speeding and other driving
the mistaken impression that the public would not support them. One of the key challenges for transport policy makers may be to encourage the media to portray a more accurate reflection of public concerns and aspirations, to help reduce this misperceived public resistance to the stricter enforcement of traffic regulations.
Educating drivers to be more considerate and safe was well supported by all sample groups, which again begs the question why more is not being done to promote this intervention. Current policy towards inconsiderate and dangerous driving has been constrained by a fear that the public would not support the necessary measures. Although the survey results suggest that many people would support such measures, the fact that few drivers currently opt for additional driver training must give some cause for reflection; perhaps, when they indicated support for this measure,
respondents were imagining that it would only apply to other people! It is likely that the people most in need of the additional training might be among the least likely to volunteer for it. Thus, despite the level of support apparent from the survey, a question mark clearly hangs over the effectiveness of education and training for drivers that are determined to drive aggressively.
5. CONCLUSIONS AND IMPLICATIONS.
The survey results suggest that there are discrepancies between what the public consider to be the problems “for users of Britain’s roads” and “for themselves personally” and that, if one relies on the former (“vicarious”) opinions, the
seriousness of problems will tend to be exaggerated. The surveys also highlight some significant differences between end users and a sample of service providers in the perception and ranking of problems. These findings raise questions regarding whose opinions should count when road policies and priorities are being devised. Although the public, as end users, might expect their opinions to prevail, it can obviously be argued that government has a duty to determine policy in the best interests of the public and should not be unduly swayed by public opinion which is notoriously labile, difficult to measure and probably influenced by the agenda set by the media and powerful interest groups.
effective line of policy under the mistaken impression that it would not get public support.
This study has suggested two main reasons why politicians may have an inaccurate impression of public concern about transport problems and of the level of public support for potential solutions. The first is that, unless appropriate corrections have been made, the views of less educated, less vocal and less affluent groups will be under-represented in opinion surveys. The second is that the issues and concerns championed by the popular media assume, in the minds of politicians and public alike, more importance than is justified by people’s personal experience or opinions. These two tendencies will, to some extent, tend to cancel each other out because the
opinions of the educated elite are often at odds with popular journalism, but it would be naive to expect that the net distortion will always be insignificant and wrong to use this as an excuse to ignore the underlying issues.
REFERENCES
AA (2000) The Great British Motorist: Lessons from European transport and travel, http://www.aanewsroom.com/aamotoringtrust/pdf/GB_Motorist_2000.pdf
Anable J (2005) ‘Complacent car addicts’ or ‘aspiring environmentalists’? Identifying travel behaviour segments using attitude theory. Transport Policy
Journal, 12 (1) 11-22
Beale, J. and Bonsall, P.W. (2003) Enhancing the road travel experience: Survey of road users’ attitudes, Unpublished report submitted to Rees Jeffreys Road Fund, November 2003.
Beale, J. and Bonsall, P.W. (2004) What do people really want from Britain’s’ roads? Proceedings of Transport Practitioner’s Conference, Birmingham, July 2004, PTRC
Beale, J., Bonsall, P., Pedler, A. and Paulley, N. (2004) Enhancing the road travel experience: Summary Report., Unpublished report submitted to Rees Jeffreys Road Fund, June 2004.
Bonsall (2004) Quality Surveys, Paper presented at the seventh International Conference on Survey Methods in Transport, Costa Rica, August 2004, To be published by Elsevier.
CfIT (2001) Public attitudes to transport in England. Report available on http://www.cfit.gov.uk/reports/mori2001/pdf/mori2001.pdf
Davies, D.G., Halliday, M.E., Mayes, M and Pocock, R.L. (1997) Attitudes to cycling: a qualitative study and conceptual framework, TRL Report 266.
DETR (1998) A new deal for transport: Better for Everyone, White Paper issued by the Stationery Office, London.
DETR (1999) Personal Security Issues in Pedestrian Journeys, HMSO, London
DETR, (2000) Transport 2010: The Ten Year Plan, DETR, London.
DfT, (2004) The Future of Transport- a network for 2030, White Paper issued by the Stationery Office, London.
Festinger, L. (1954). A theory of social comparison processes, Human Relations, 7 117-140.
Finch, H. and Morgan, J.M. (1985) Attitudes to cycling, TRL Research Report RR14, TRL, Crowthorne, Berkshire
Goethals, G.R., Messick, D.M., and Allison, S.T. (1991) The uniqueness bias: Studies of constructive social comparison. In J. Suls & T.A. Wills (Eds.) Social comparison:
Contemporary theory and research (pp.149-176), Erlbaum, Hillsdale, NJ.
Goodwin, P. (2001) Running to stand still? An analysis of the Ten Year Plan for Transport, Council for the Protection of Rural England, London.
Goodwin, P, Hallett, S, Kenny, F and Stokes, G (1991) Transport: The New Realism, Report to the Rees Jeffreys Road Fund, Transport Studies Unit, University of Oxford.
Green, K.E. (1996) Socio-demographic factors and mail survey response, Psychology
and Marketing, 13 (2) 171-184.
Highways Agency (1999) Road User Satisfaction Survey, available on http://www.highways.gov.uk/aboutus/corpdocs/roaduser/2000/
House of Commons (2002) Report of the Select Committee on Transport, Session 2001-2002, HC 558-I, 27 May, The Stationery Office, London.
Huang, B, Preston, J, Raje, F and Whitehead, T (2004) The case for a National Panel Survey of Road Users’ Attitudes and Behaviour, Prospectus and International
Literature Review. Report to the Police Foundation, Transport Studies Unit, Oxford University.
HMSO (1987) What’s Wrong With Walking? Her Majesties Stationery Office, London.
Lex Transfleet (2002) Delivering a Better World, Lex Transfleet Report on Freight Transport, March 2002
Parasuraman, A., Zeithaml, V. A. and Berry L. L. (1985) A conceptual model of service quality and its implications for future research, Journal of Marketing, 49(4), 41-50
Parasuraman, A., Zeithaml, V. A. and Berry L. L. (1988) SERVQUAL: a multi-item scale for measuring customer perceptions of service quality, Journal of Retailing,
64(1), 12-40.
Pedler, A, Tual, M. and Huggins, P. (2002) Enhancing the Road Travel Experience: A Literature Review, unpublished report to Rees Jeffreys Road Fund September 2002.
Pedler, A. and Tual, M (2003) Identifying current gaps and expectations of the road network: Views of the bus and freight industry, unpublished report to Rees Jeffreys Road Fund March 2003
RAC (2002) Report on Motoring http://www.rac.co.uk/pdfs/report2002.pdf
RAC (2003) Report on Motoring
Robinson-Riegler, G.L. & Winton, W.M. (1996). The role of conscious recollection in recognition of affective material: Evidence for positive-negative asymmetry. The
Journal of General Psychology, 123, 93-104.
Rosenthal, R., and Rosnow, R.L. (1975) The Volunteer Subject, John Wiley, New York
Rule, B.G. and Ferguson, T.J. (1986) The effects of media violence on attitudes, emotions and cognitions, Journal of Social Issues, 42, 29-50.
Sharples, J.M. & Fletcher, J.P (2000) Perceptions of road crossing facilities, The Scottish Executive Central Research Unit 2001. available on:
https://www.scotland.gov.uk/cru/pedestrian.pdf
Silverstein, B., Perdue, L., Peterson, B., and Kelly, E. (1986) The role of the mass media in promoting a thin standard of bodily attractiveness for women, Sex Roles,
14, 519-532.
Taylor, S.E., Falke, R.L., Shoptaw, S.J. and Lichtman, R.R. (1986) Social support, support groups and the cancer patient, Journal of Consulting and Clinical Research,
54, 608-615.