Morphology of Poly(L-lactic acid) During
Processing of a Vascular Scaffold.
Thesis by Artemis Ailianou
In Partial Fulfillment of the Requirements for the degree of
Doctor of Philosophy
CALIFORNIA INSTITUTE OF TECHNOLOGY Pasadena, California
2014
There are many people who have contributed to my success at Caltech. First of all, I would
like to thank my advisor Julie Kornfield, who believed in me from the beginning. Through
Julie’s mentoring I learned how to be a better scientist, a better communicator, and a better
person overall. I would also like to thank my committee (Professors Bob Grubbs, David
Tirrell, and Mikhail Shapiro) for spending the time to read and evaluate my dissertation.
I am indebted to Dr. Jim Oberhauser of Abbott Vascular for initiating and maintaining the
collaborative research that is the topic of this dissertation, as well as overseeing the funding
for it. I’m extremely grateful for Dr. Mary Beth Kossuth’s mentoring and for answering all
my questions about stents and scaffolds as I was trying to understand my data. Few graduate
students have the opportunity to collaborate directly with industry and get a glimpse about
what matters in the “real world”—I feel very lucky to be one of them.
I have been extremely lucky to have worked with two different groups of collaborators in
my graduate student career. My first collaboration with Prof. Rastogi’s group at
Loughborough University gave me the opportunity to travel to the UK, Italy, France, The
Netherlands, and Portugal for a combination of experiments and conferences and helped me
build the foundations of my knowledge on polymer microstructure. I’m appreciative to Dr.
Sara Ronca and Mr. Giuseppe Forte both for our collaborative scientific work on Ultra High
Molecular Weight Polyethylene but also for their mentoring and lasting friendship. I
acknowledge funding from the National Science Foundation – Materials World Network for
providing the monetary support for all the travel during that project.
My work wouldn’t have been possible without the support from several Caltech staff
members and beamline scientists at National Labs. At Caltech, I would like to thank Mike
Roy for always understanding my poorly drawn sketches when I needed to make a part; Joe
Drew for being the go-to person when I needed to find things or have them fixed; Suresh
Gupta for maintaining the computer cluster and server that I’ve used to analyze my data;
Marcy Fowler, Andrea Arias, and Yvette Grant for trying to make the Kornfield group run
my X-ray scattering experiments, I’m grateful for the support of Drs. Lixia Rong and Lin
Yang at Brookhaven National Lab, Drs. Alexander Hexemer, Nobumichi Tamura, Eric
Schaible and Martin Kunz at Lawrence Berkeley National Lab, and Dr. Zhonghou Cai at
Argonne National Lab. I’m especially appreciative of Dr. Tamura for taking some of his own
time to perform proof of concept microdiffraction experiments for me, and Dr. Cai for
helping me run my first microdiffraction experiments even when he had to wake up in the
middle of the night.
The best part of my time at Caltech has been the people I met. I have been extremely lucky
to share office and lab space with a wonderful group of colleagues. I still remember the first
time I talked to Dr. Zuli Kurji when I was considering joining the Kornfield group. Zuli has
been a mentor, a friend, a dance buddy, and one of the best people to have around during
beamtime. Dr. Paul Pirogovsky joined the group the same time I did, but we didn’t really
bond until a neutron scattering beamtime a year after that. I need to thank Paul for helping
me with all things electrical and mechanical in the lab, for helping me collect data during one
of my many beamtimes, for many interesting conversations, and for commiserating about
life as graduate students. Dr. Jeremy Wei was already a seasoned grad student when I joined
the Kornfield group and has provided life advice along the way. Amy Fu and Boyu Li have
become great friends, and even though we work on completely different projects we’re still
able to bounce ideas off each other (and do a fair amount of gossiping). I enjoyed many
conversations with many other previous and current Kornfield group members including Dr.
Loddie Foose, Dr. Ruoyu Zhang, Dr. Matthew Mattson, Akira Takagi, Dennis Ko, Karthik
Ramanchandran, Yulan Lin, and Dan Zhou.
Outside the lab, I bonded with the incoming Chemical Engineering class of 2008 and made
many friends through dancing with the Ballroom Dance and Ballet club, participating in the
Graduate Student Council, and attending the free food events sponsored by the Center for
Diversity, the office for International Student Programs, the Alumni Association, and the
Caltech Y. I need to thank all the staff that made those programs possible, in particular Portia
Levitan, Dr. Nick Hoh, Dr. Christine Loza, Aileen Hui, and Casey Handmer have carried me
through personal crises, illness, and difficult times at work, and they were there to celebrate
successes, dance performances, and birthdays. My friends from college and high school kept
me sane by reminding me that there’s a different world outside Caltech. Esteban Hufstedler’s
love and support made the research for and writing of this dissertation possible.
Of course, none of this would have happened without the love and continuous
encouragement from my parents and extended family. I’m very grateful that my parents
never held me back from fulfilling my dreams even though it meant that I would live at least
7000 miles away from them for many years. Lastly, I want to acknowledge the influence of
my paternal grandmother, Olga, who was one of the first women to attend the National
Technical University of Athens, Greece and has inspired me with her intrepidness, her sharp
New and promising treatments for coronary heart disease are enabled by vascular scaffolds
made of poly(L-lactic acid) (PLLA), as demonstrated by Abbott Vascular’s bioresorbable
vascular scaffold. PLLA is a semicrystalline polymer whose degree of crystallinity and
crystalline microstructure depend on the thermal and deformation history during processing.
In turn, the semicrystalline morphology determines scaffold strength and biodegradation
time. However, spatially-resolved information about the resulting material structure
(crystallinity and crystal orientation) is needed to interpret in vivo observations.
The first manufacturing step of the scaffold is tube expansion in a process similar to injection
blow molding. Spatial uniformity of the tube microstructure is essential for the consistent
production and performance of the final scaffold. For implantation into the artery, solid-state
deformation below the glass transition temperature is imposed on a laser-cut subassembly to
crimp it into a small diameter. Regions of localized strain during crimping are implicated in
deployment behavior.
To examine the semicrystalline microstructure development of the scaffold, we employed
complementary techniques of scanning electron and polarized light microscopy, wide-angle
X-ray scattering, and X-ray microdiffraction. These techniques enabled us to assess the
microstructure at the micro and nano length scale. The results show that the expanded tube
is very uniform in the azimuthal and axial directions and that radial variations are more
pronounced. The crimping step dramatically changes the microstructure of the subassembly
by imposing extreme elongation and compression. Spatial information on the degree and
direction of chain orientation from X-ray microdiffraction data gives insight into the
Abstract ... vi
Table of Contents ... viii
List of Figures ... ix
List of Tables ... xi
Chapter 1: Introduction
1.1 Chemical structure and uses of poly(L-lactic acid) ... I-1 1.2 Semicrystalline morphology of PLLA ... I-2 1.3 Vascular scaffolds made of PLLA ... I-5 1.4 Objective ... I-8 1.5 Organization ... I-8 References ... I-9 Chapter 2: Axial, Azimuthal, and Radial Variation of PLLA Morphology After Tube Expansion
2.1 Introduction ... II-1 2.2 Results ... II-6 2.3 Discussion ... II-16 2.4 Conclusions... II-19 2.5 Methods ... II-20 References ... II-25 Chapter 3: Effect of Crimping on Scaffold Morphology
3.1 Introduction ... III-1 3.2 Results ... III-4 3.3 Discussion ... III-12 3.4 Conclusions... III-17 3.5 Methods ... III-18 References ... III-22 Chapter 4: Effect of Deployment on Scaffold Morphology
4.1 Introduction ... IV-1 4.2 Results ... IV-3 4.3 Discussion ... IV-11 4.4 Conclusions... IV-15 4.5 Methods ... IV-17 References ... IV-22
Appendix A: Data Analysis code
CHAPTER 1
Introduction
1.1 Chemical structure and uses of poly(L-lactic acid)
Poly(L-lactic acid) (PLLA) is an aliphatic polyester made of lactic acid (2-hydroxy
propionic acid) monomers. Lactic acid exists into two isomers: L(-) and D(+). The L(-)
isomer is the most common form but the D(+) isomer can be produced by microorganisms
or through racemization.1 Industrial polymerization of lactic acid is typically done via ring
opening polymerization (ROP) that yields a high molecular weight (>100,000 g/mol)
polymer (Fig. 1.1)2. The properties of a PLLA grade depend highly on the ratio of L- and
D-isomers, and it is common practice to polymerize a controlled amount of the two isomers
to tailor its properties for a specific application. Pure poly(L-lactic acid) (PLLA) is a
semicrystalline polymer with 70% maximum achievable crystallinity, whereas
poly(L-D-lactic acid) random copolymer is completely amorphous.
PLLA is considered a “green” polymer because it is biodegradable and its monomer
can be made through fermentation of renewable plant sources, such as plant derived starch
and sugars.3 Worldwide production of PLLA was 180,000 metric tons in 2012 and is
expected to reach 800,000 by 2020.4 PLLA is a versatile polymer that can be processed
with injection molding, sheet extrusion, blow molding, film forming, or fiber spinning to
make consumer products such as films, bottles, and fibers for carpets and apparel1,5.
Because of its biocompatibility and biodegradation, PLLA can be used for medical
applications. In 1966, the U.S. Army Medical Biomechanical Research Laboratory
evaluated PLLA filaments, films, and coatings for use as surgical implants.6 Since then,
PLLA has been used for fixing fractures in bones7–11, sutures12, endovascular implants13–
15, and even aesthetic medicine16.
1.2 Semicrystalline morphology of PLLA
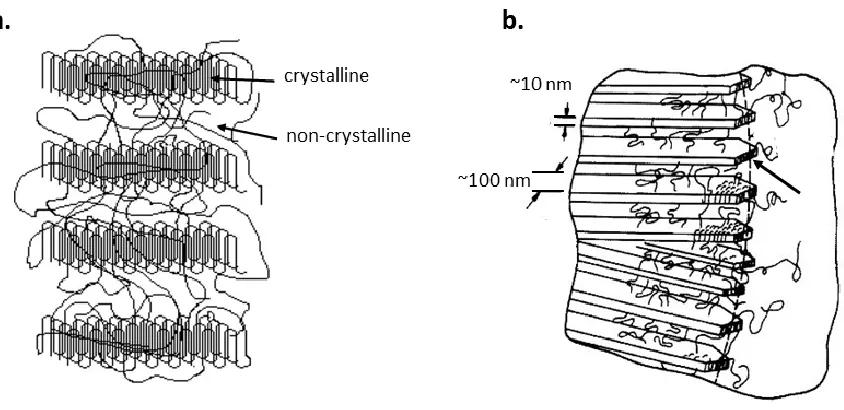
Semicrystalline polymers have a nanostructure with both crystalline and
amorphous domains (Fig. 1.2). The crystalline domains confer strength while the
amorphous domains confer toughness and flexibility. The macroscopic properties of the
material depend strongly on the fraction of crystalline material (degree of crystallinity),
and on the morphology, spatial arrangement, size, and orientation distribution of the
Figure 1.2 a) Schematic of crystalline and non-crystalline domains. Typical thickness of lamellar crystals is 10 nm. b) Enlarged view of the lamella/amorphous polymer interface. The leftmost arrow points at an individual lamella. Figure adapted from Shultz17.
Crystallites grow by reorganizing random-coil chains into platelet-like lamellae
bounded by the inter-lamellar region and separated by regions of non-crystalline material.
Lamellae form when polymer chains enter and re-enter the polymer crystal, which results
in lamellar dimensions much smaller than the chain length (Fig.1.3).
PLLA has four different crystal morphs: α, α’, β, and γ. The α morph forms during
crystallization from the melt at temperatures above 120 °C or from solution. It has an
orthorhombic unit cell with dimensions a = 10.68 Å, b = 6.16 Å, and c (fiber axis) =
28.86Å18 (Fig. 1.3) 1. Initially thought of as a slightly disordered α phase, α’ was first
identified by Zhang et al.19 and determined that its unit cell is hexagonal with dimensions a = b = 6.20 Å, and c = 28.80 Å20,21. A contradictory study by Wasanasuk et al. has reported
1 There are several reported values for the dimensions of the α unit cell. The first reported values were a =
10.70 Å , b = 6.45 Å, and c (fiber axis) = 27.80 Å43, but subsequent studies have reported dimensions of a
= 10.68 Å, b = 6.16 Å, and c = 28.86Å18, and a = 10.5 Å, b = 6.1 Å, and c = 28.80 Å44. The accepted values
that the α’ unit cell is orthorhombic, with dimensions a = 10.80 Å, b = 6.20 Å, and c =
28.80 Å22. The β morph forms when PLLA fibers are made through hot-drawing
melt-spinning23 or solution spinning24, and it has an trigonal unit cell with dimensions a = b =
10.52 Å and c = 8.80 Å24. The γ morph forms by epitaxial crystallization on
hexamethylbenzene at 155 °C, and it has an orthorhombic unit cell with a = 9.95, b = 6.25,
and c = 8.80 A. For industrial applications other than fiber spinning and drawing, the α and
[image:15.612.221.464.305.511.2]α’ morphs are the most relevant.
Figure 1.3 Schematic representation of the orthorhombic unit cell of PLLA’s α form. See text for unit cell dimensions. Figure from Wasanasuk.18
The crystal polymorphism of PLLA has a large influence on its properties. For
example, a high content in α morph results in high strength and high modulus but also,
brittleness. Because industrial process like injection molding and film drawing are
performed at temperatures that favor crystallization of the α morph, PLLA is often
the stereoisomer content25,26, blending27–29, plasticizing30–32, and copolymerizing33.
Brittleness can also be avoided by tailoring the crystalline/amorphous ratio and the degree
of orientation by varying processing conditions, e.g. controlling the shear in injection
molding34 or changing the draw ratio of films35,36.
Certain applications, e.g. medical implants, require pure PLLA, so toughness and
high strength must be modulated by processing only. For manufacturing processes that
involve strains in the solid state, a high content of α’ to α is desired because it renders
PLLA more ductile. Simultaneous wide-angle x-ray scattering and digital scanning
calorimetry studies have shown that the α’ to α transition happens in the solid state at
temperatures between 100 and 120°C21(above PLLA’s glass transition temperature, T g ≈
60°C). Therefore, a high degree of crystallization and alignment of α’ could only be
achieved at relatively low temperatures, close to the Tg. However, little is known about the
strain phase behavior of pure poly(L-lactic) acid near Tg.
1.3 Vascular scaffolds made of PLLA
Coronary heart disease is the leading cause of the death in the United States37 and
in the world38. Coronary heart disease is associated with the narrowing of the arterial
vessels due to the buildup of atheromatic plaque. This results in hypertension, ischemia,
angina, and in the case of compete occlusions, a heart attack. Lifestyle changes such as
exercise and cessation of smoking and/or medication can lower the risk of heart attacks.
Some patients might need a more aggressive treatment for revascularization, usually either
coronary bypass surgery, or balloon angioplasty combined with stenting. In coronary
flow. In balloon angioplasty, an obstructed vessel is enlarged by compressing the
atheromatic plaque against the vessel walls by means of an inflatable balloon. Stents are
expandable slotted tubes that are implanted in the artery and provide support to the newly
[image:17.612.148.387.227.451.2]expanded vessel once the balloon is withdrawn (Fig 1.4).
Figure 1.4 a) A stent on a balloon is delivered in the artery narrowed by atheromatic plaque. b) The stent is expanded when the balloon is inflated, and it enlarges the diameter of the artery by pushing the plaque against the arterial walls. c) The balloon is removed but the stent remains to support the enlarged vessel.
Typically, stents are made of either bare metal (BMS), or they can be drug-eluting
(DES). Even though they are generally safe, there are several concerns about their
long-term performance. The biggest concern is late stent thrombosis due to continuous
inflammation by the presence of a foreign body in the vessel. Furthermore, their stiffness
prohibits restoration of regular vasomotion or further diameter enlargement, and their
challenging.39 These concerns were considered, and temporary polymeric bioresorbable
scaffolds were suggested as an alternative in 1988, only two years after the first metal stents
had been implanted in humans.15 However, it took two decades of research before
cardiovascular scaffolds were tested in human clinical trials15.
Bioresorbable polymeric scaffolds are both biodegradable and resorbable, i.e. their
degradation products in the body enter metabolic pathways. PLLA is an excellent
bioresorbable polymer because its monomer, lactic acid, is already produced by the body.
Polymeric vascular scaffolds currently in development and clinical trials are made of
PLLA, or PLLA copolymerized with other biocompatible polymers like
poly(caprolactone) and poly(glycolic acid).40 One of the most successful bioresorbable
scaffolds, manufactured by Abbott Vascular, is made entirely out of PLLA and has already
demonstrated the clinical safety and efficacy required to receive the CE mark41. The
mechanical performance and hydrolytic degradation of the scaffold in vivo depends on its semicrystalline morphology, because amorphous domains are more susceptible to
hydrolysis.1 Additionally, the distribution and alignment of crystalline domains affects the
strength of semicrystalline PLLA42. Therefore, in order to fully understand the in vivo performance of the scaffold we need to fully characterize the spatial distribution of
1.4 Objective
The manufacture and use of a poly(L-lactic acid) scaffold involves three key steps:
tube expansion, crimping, and deployment. Tube uniformity during expansion is required
for consistent scaffold performance across patients, whereas the crimping and deployment
steps determine the scaffold’s in vivo performance. Little is known about the effects of crimping on the morphology of metal stents, much less of polymeric scaffolds. The
morphology after deployment depends highly on the semicrystalline morphology created
during crimping, but until now there was no thorough investigation of the connection
between the two. This thesis presents the results of the investigations on the microstructure
evolution from tube expansion through deployment.
1.5 Organization
Chapter 2 employs polarized light microscopy (POM) and wide-angle X-ray
diffraction to assess the axial, azimuthal, and radial variation of the expanded PLLA tube
used to make the bioresorbable scaffold. The effects of crimping on semicrystalline
morphology are studied with POM and X-ray microdiffraction and are presented in Chapter
3. In Chapter 4, the relationship between microstructure developed during crimping and
References
(1) Henton, D. E.; Gruber, P.; Lunt, J.; Randall, J. Natural Fibers, Biopolymers, and Biocomposites 16. Polylactic Acid Technology. In Natural Fibers, Biopolymers, and Biocomposites; 2005; pp. 527–578.
(2) Lim, L.-T.; Auras, R.; Rubino, M. Processing Technologies for Poly(lactic Acid). Prog. Polym. Sci.2008, 33, 820–852.
(3) Inkinen, S.; Hakkarainen, M.; Albertsson, A.-C.; Södergård, A. From Lactic Acid to Poly(lactic Acid) (PLA): Characterization and Analysis of PLA and Its Precursors.
Biomacromolecules2011, 12, 523–532.
(4) Carus, M. Growth in PLA bioplastics: a production capacity of over 800,000 tonnes expected by 2020
http://www.bioplasticsmagazine.com/en/news/meldungen/PLA_Growth.php.
(5) Radjabian, M.; Kish, M. H.; Mohammadi, N. Structure–property Relationship for Poly(lactic Acid) (PLA) Filaments: Physical, Thermomechanical and Shape Memory Characterization. J. Polym. Res.2012, 19, 9870.
(6) Kulkarni, R. K.; Pani, K. C.; Neuman, C.; Leonard, F. Polylactic Acid for Surgical Implants; Washington,, D.C., 1966; pp. 4–17.
(7) Leenslag, J. W.; Pennings, A. J.; Bos, R. R. M.; Rozema, F. R.; Boering, G. Resorbable Materials of poly(L-Lactide). VI. Plates and Screws for Internal Fracture Fixation.
Biomaterials1987, 8, 70–73.
(8) Kinoshita, Y.; Kirigakubo, M.; Kobayashi, M.; Tabata, T.; Shimura, K.; Ikada, Y. Study on the Efficacy of Biodegradable poly(L-Lactide) Mesh for Supporting Transplanted Particulate Cancellous Bone and Marrow: Experiment Involving Subcutaneous Implantation in Dogs. Biomaterials1993, 14, 729–736.
(9) Howard, D.; Partridge, K.; Yang, X.; Clarke, N. M. P.; Okubo, Y.; Bessho, K.; Howdle, S. M.; Shakesheff, K. M.; Oreffo, R. O. C. Immunoselection and Adenoviral Genetic
Modulation of Human Osteoprogenitors: In Vivo Bone Formation on PLA Scaffold.
Biochem. Biophys. Res. Commun.2002, 299, 208–215.
(10) Bos, R. R.; Rozema, F. R.; Boering, G.; Nijenhuis, a J.; Pennings, a J.; Verwey, a B.; Nieuwenhuis, P.; Jansen, H. W. Degradation of and Tissue Reaction to Biodegradable poly(L-Lactide) for Use as Internal Fixation of Fractures: A Study in Rats. Biomaterials 1991, 12, 32–36.
(12) Heino, A.; Naukkarinen, A.; Kulju, T.; Törmälä, P.; Pohjonen, T.; Mäkelä, E. A. Characteristics of poly(L-Lactic Acid) Suture Applied to Fascial Closure in Rats. J. Biomed. Mater. Res.1996, 30, 187–192.
(13) Venkatraman, S.; Boey, F.; Lao, L. L. Implanted Cardiovascular Polymers: Natural, Synthetic and Bio-Inspired. Prog. Polym. Sci.2008, 33, 853–874.
(14) Sarno, G.; Bruining, N.; Onuma, Y.; Garg, S.; Brugaletta, S.; De Winter, S.; Regar, E.; Thuesen, L.; Dudek, D.; Veldhof, S.; et al. Morphological and Functional Evaluation of the Bioresorption of the Bioresorbable Everolimus-Eluting Vascular Scaffold Using IVUS, Echogenicity and Vasomotion Testing at Two Year Follow-up: A Patient Level Insight into the ABSORB A Clinical Trial. Int. J. Cardiovasc. Imaging2012, 28, 51–58.
(15) Thatcher, L. G. Endovascular Stents. In Polymers for Vascular and Urogenital
applications; Shalaby, S.; Burg, K. J. L.; Shalaby, W., Eds.; CRC Press: Boca Raton, Fl, 2012; pp. 89–116.
(16) Sculptra Aesthetic is Different in the way that it Works
http://www.sculptraaesthetic.com/consumer/how-is-sculptra-aesthetic-different.aspx.
(17) Shultz, J. M. Polymer Crystallization; Oxford University Press: Washington,, D.C., 2001.
(18) Wasanasuk, K.; Tashiro, K.; Hanesaka, M.; Ohhara, T.; Kurihara, K.; Kuroki, R.; Tamada, T.; Ozeki, T.; Kanamoto, T. Crystal Structure Analysis of Poly (L -Lactic Acid ) Alpha Form On the Basis of the 2-Dimensional Wide-Angle Synchrotron X-Ray and Neutron Diffraction Measurements. Macromolecules2011, 44, 6441–6452.
(19) Zhang, J.; Duan, Y.; Sato, H.; Tsuji, H.; Noda, I.; Yan, S.; Ozaki, Y. Crystal Modifications and Thermal Behavior of Poly L -Lactic Acid ) Revealed by Infrared Spectroscopy.
Macromolecules2005, 38, 8012–8021.
(20) Kawai, T.; Rahman, N.; Matsuba, G.; Nishida, K.; Kanaya, T.; Nakano, M.; Okamoto, H.; Kawada, J.; Usuki, A.; Honma, N.; et al. Crystallization and Melting Behavior of Poly (L-Lactic Acid). Macromolecules2007, 40, 9463–9469.
(21) Zhang, J.; Tashiro, K.; Tsuji, H.; Domb, A. J. Disorder-to-Order Phase Transition and Multiple Melting Behavior of Poly ( L -Lactide ) Investigated by Simultaneous Measurements of WAXD and DSC. Macromolecules2008, 41, 1352–1357.
(22) Wasanasuk, K.; Tashiro, K. Crystal Structure and Disorder in Poly(l-Lactic Acid) Δ Form (α′ Form) and the Phase Transition Mechanism to the Ordered Α Form. Polymer2011, 52, 6097–6109.
(23) Hoogsteen, W.; Postema, A. R.; Pennings, A. J.; Ten Brinke, G.; Zugenmaier, P. Crystal Structure, Conformation and Morphology of Solution-Spun poly(L-Lactide) Fibers.
Macromolecules1990, 23, 634–642.
(25) Tsuji, H.; Ikada, Y. Stereocomplex Formation between Enantiomeric Poly(lactic Acid)s. XI. Mechanical Properties and Morphology of Solution-Cast Films. Polymer1999, 40, 6699–6708.
(26) Fujita, M.; Sawayanagi, T.; Abe, H.; Tanaka, T.; Iwata, T.; Ito, K.; Fujisawa, T.; Maeda, M. Stereocomplex Formation through Reorganization of Poly (L-Lactic Acid) and Poly (D-Lactic Acid ) Crystals. Macromolecules2008, 41, 2852–2858.
(27) Bai, H.; Xiu, H.; Gao, J.; Deng, H.; Zhang, Q.; Yang, M.; Fu, Q. Tailoring Impact Toughness of poly(L-Lactide)/poly(ε-Caprolactone) (PLLA/PCL) Blends by Controlling Crystallization of PLLA Matrix. ACS Appl. Mater. Interfaces2012, 4, 897–905.
(28) Bai, H.; Huang, C.; Xiu, H.; Gao, Y.; Zhang, Q.; Fu, Q. Toughening of Poly(l-Lactide) with Poly(ε-Caprolactone): Combined Effects of Matrix Crystallization and Impact Modifier Particle Size. Polymer2013, 54, 5257–5266.
(29) Rathi, S.; Chen, X.; Coughlin, E. B.; Hsu, S. L.; Golub, C. S.; Tzivanis, M. J. Toughening Semicrystalline Poly(lactic Acid) by Morphology Alteration. Polymer2011, 52, 4184– 4188.
(30) Saeidlou, S.; Huneault, M. a.; Li, H.; Park, C. B. Poly(lactic Acid) Crystallization. Prog. Polym. Sci.2012, 37, 1657–1677.
(31) Kulinski, Z.; Piorkowska, E.; Gadzinowska, K.; Stasiak, M. Plasticization of poly(L-Lactide) with Poly(propylene Glycol). Biomacromolecules2006, 7, 2128–2135.
(32) Liu, H.; Zhang, J. Research Progress in Toughening Modification of Poly(lactic Acid). J. Polym. Sci. Part B Polym. Phys.2011, 49, 1051–1083.
(33) Cho, J.; Baratian, S.; Kim, J.; Yeh, F.; Hsiao, B. S.; Runt, J. Crystallization and Structure Formation of Poly (L -Lactide- Co - Meso -Lactide) Random Copolymers: A Time-Resolved Wide- and Small-Angle X-Ray Scattering Study. Polymer2003, 44, 711–717.
(34) Ghosh, S.; Viana, J. C.; Reis, R. L.; Mano, J. F. Oriented Morphology and Enhanced Mechanical Properties of Poly(l-Lactic Acid) from Shear Controlled Orientation in Injection Molding. Mater. Sci. Eng. A2008, 490, 81–89.
(35) Smith, P. B.; Leugers, A.; Kang, S.; Hsu, S. L.; Yang, X.; Al, S. E. T. An Analysis of the Correlation between Structural Anisotropy and Dimensional Stability for Drawn
Poly(lactic Acid) Films. J. Appl. Polym. Sci.2001, 82, 2497–2505.
(36) Wong, Y. S.; Stachurski, Z. H.; Venkatraman, S. S. Orientation and Structure
Development in Poly(lactide) under Uniaxial Deformation. Acta Mater.2008, 56, 5083– 5090.
(37) Hoyert, D.; Hu, J. National Vital Statistics Reports Deaths : Preliminary Data for 2011; 2012; Vol. 61, pp. 1–52.
(39) Onuma, Y.; Ormiston, J.; Serruys, P. W. Bioresorbable Scaffold Technologies. Circ. J. 2011, 75, 509–520.
(40) Onuma, Y.; Serruys, P. W. Bioresorbable Scaffold: The Advent of a New Era in Percutaneous Coronary and Peripheral Revascularization? Circulation2011, 123, 779– 797.
(41) Abbott Announces International Launch of the AbsorbTM Bioresorbable Vascular Scaffold
http://www.abbott.com/news-media/press-releases/abbott-announces-international-launch-of-the-absorb-bioresorbable-vascular-scaffold.htm.
(42) Dias, J. C.; Ribeiro, C.; Sencadas, V.; Botelho, G.; Ribelles, J. L. G.; Lanceros-Mendez, S. Influence of Fiber Diameter and Crystallinity on the Stability of Electrospun Poly(l-Lactic Acid) Membranes to Hydrolytic Degradation. Polym. Test.2012, 31, 770–776.
(43) Kalb, B.; Pennings, a. J. General Crystallization Behaviour of Poly(l-Lactic Acid).
Polymer1980, 21, 607–612.
(44) Kobayashi, J.; Asahi, T.; Ichiki, M.; Oikawa, a.; Suzuki, H.; Watanabe, T.; Fukada, E.; Shikinami, Y. Structural and Optical Properties of Poly Lactic Acids. J. Appl. Phys.1995,
Chapter 2
Axial, Azimuthal, and Radial Variation of PLLA Morphology
After Tube Expansion
2.1 Introduction
New and promising treatments for coronary heart disease are enabled by vascular
scaffolds made of poly(L-lactic acid) (PLLA)1 as demonstrated by Abbott’s Bioresorbable
Vascular Scaffold (BVS, Fig 2.1).2 Clinical performance of PLLA scaffolds depends on
the uniformity of structure within a given scaffold and the uniformity across batches of
multiple scaffolds. Consistent microstructure and wall thickness of the tube are required
for even deployment, uniform acute radial strength, and structural integrity2,3 after
implantation in the artery. PLLA is a semicrystalline polymer whose degree of crystallinity
and crystalline microstructure depend on the thermal and deformation history during
processing.4–8 In turn, the semicrystalline morphology determines scaffold strength and
biodegradation time.9,10 A key processing step that affects the axial, azimuthal, and radial
variations of structure in BVS is the expansion of an extruded tube of PLLA into the
thin-walled tube from which the scaffolds are cut.
The expanded tube is a produced in a process similar to stretch-blow molding: an
extruded tube “preform” is placed in a mold; compressed air is admitted into the preform;
the preform is heated from room temperature to a temperature above the glass transition to
allow for stretching driven by the elevated pressure inside the preform and axial tension
preform’s outer diameter (OD) reaches the inner diameter (ID) of the mold. Typically, the
axial elongational strain is 20% and the azimuthal elongational strain is approximately
400% (greater for material elements near the ID than for those near the OD).The resulting
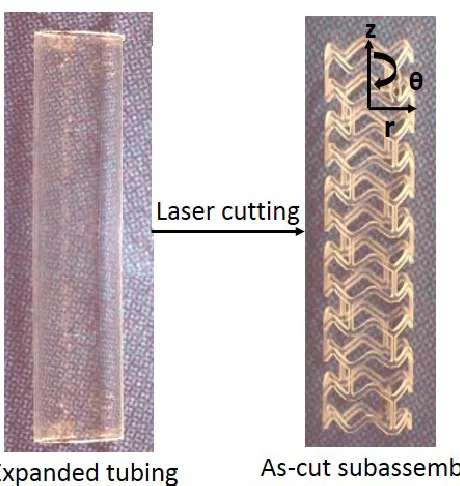
expanded tube is then removed from the mold, ready to be laser-cut into “as-cut”
subassemblies (Fig. 2.1). Controlling this tube-expansion process—and hence, the tube
[image:25.612.208.438.251.494.2]material properties—is crucial for consistent scaffold performance across all patients.
Figure 2.1: The expanded tube is laser cut into the as-cut subassembly (3 mm dia. and 18 mm long). Struts are 200 microns wide and 150 microns thick. Cylindrical coordinates are used: z ≡ axial, θ ≡ azimuthal, and r ≡ radial. Images provided by Abbott Vascular.
Similar to stretch blow molding11, the expansion process drives strain-induced
polymer crystallization. The expansion deforms the polymeric material most strongly in
the azimuthal direction, leading to a preferential orientation of the molecular axis of the
PLLA chains around the tube circumference, which imparts high resistance to radial
has higher strength and better dimensional stability.8 Blow molding of semicrystalline
polymers is an intricate process that is performed near the glass transition temperature
(PLLA has Tg of 58 - 68°C12,13), where viscoelastic properties have a strong, nonlinear
temperature dependence, and involves competing rates of heating, deformation,
crystallization, and cooling.14 Further challenges are present when the material is PLLA
and the product is a vascular scaffold. The walls of the current generation BVS are 150
µm thick, imposing unusually tight tolerances15 (cf., beverage bottles), and the viscoelastic
properties of PLLA are sensitive to small variations in, for example, water content16.
Therefore, it is particularly important to characterize the variations of structure after the
tubing expansion process.
Here, a combination of polarized light microscopy and synchrotron X-ray
scattering is used to examine variations in PLLA morphology after the expansion process.
Crystalline and glassy domains in PLLA are interspersed on a scale of tens of nanometers.
Of PLLA’s four different crystal morphs, only α and α’, which have only recently been
distinguished17, are found in the scaffold. Polarized light microscopy provides a
large-scale overall view of variations in structure over distances as large as 10 mm. The resulting
overview guides the selection of points at which to use synchrotron x-ray scattering to
observe important aspects of the nanostructure (e.g., relative amount of crystalline material,
relative amount of α vs α’ crystallites, crystallite orientation direction, and distribution).
We studied the axial and azimuthal variations using four specimens from the same
the expanded tube; to keep track of their original axial positions, the specimens were
labeled A, B, C, and D (Figure 2.2). Each specimen was laser cut to create eight equally
keep track of the azimuthal position, a black line was drawn on the same azimuthal location
on all four specimens and was assigned the θ = 0° position.
Figure 2.2 Schematic of specimen geometry. An expanded tube (left) is laser cut into four specimens (A-D). Each specimen is laser-cut to create eight, equally spaced axial beams (center) with azimuthal separation of 45°; the asterisk indicates the assigned θ = 0° position. The specimens are then “unrolled” (right) and examined with polarized light microscopy and X-ray scattering. Each beam is 25 mm long, 0.6 mm wide, and 150 µm thick.
X-ray scattering characterization has been used to decipher the structure PLLA. For
the temperature and pressure conditions of the tube expansion, only the α and α’ crystal
morphs are relevant. The α’ to α ratio determines yielding behavior; high content in α
phase results in a more brittle material.7 The tube expansion process is done at a range of
temperatures where the α phase is very brittle, so a high content of α’ is desired.
Furthermore, scaffold deployment requires a high elastic modulus, so the high content in
α’ must be maintained through the rest of the processing steps.
The x-ray diffraction peaks of the α phase are the (103), (010), (015), (110)/(200),
(203), (204), and (207). However, for the α’ phase, the observed peaks are the (010),
becomes more prominent upon deformation, and is related to the fact that α’ doesn’t readily
transform to α at low temperatures.19 It is important to note that the dimensions of [110]
and [200] planes are only slightly different between the two phases. A slight shift toward
low q indicates a higher content of α. The most accepted unit cell dimensions for the
orthorhombic α phase are a = 10.68 Å; b = 6.17 Å; c = 28.86 Å20, and for the hexagonal
α’ phase a = b = 6.20 Å; c = 28.80 Å 17,21.
The orientation of the (110)/(200) peak indicates the primary orientation axis of an
expanded tube, with crystals preferentially oriented with the chain axis in the
circumferential direction (black arrow, Figure 2.3a). In our data analysis we extracted
quantitative information for the q range of 0.6 -2.0 Å-1 (Fig. 2.3).
Figure 2.3 a) Schematic diagram showing the relationship between the (110)/(200) peaks (circles on the vertical dumbbell) and the chain axis direction (black arrow) relative to the expanded PLLA tube. b) A representative wide-angle scattering pattern (NSLS X27C) showing the q-range of quantitative analysis (inner and outer circles represent q = 0.6 and q = 2.0 Å-1, respectively). The
two brightest peaks at q = 1.170 Å-1 correspond to the (110)/(200) crystal planes.
2.2 Results
2.2.1 Azimuthal and axial variations of the expanded tube
Polarized light examination
All specimens were examined between crossed circular polarizers to survey the
variations in orientation in the axial and azimuthal directions (defined in Fig. 2.2). To more
accurately record the Michel-Levy colors, each axial beam was examined through crossed
linear polarizers in a Zeiss Universal microscope. To assign a retardance value to the
observed colors, the shift of the observed colors was analyzed when quarter-wave and
full-wave retardation plates were inserted with their orientation along and orthogonal to the
axial (z) direction of the PLLA beam. The Michel-Levy chart (Fig. 2.4, right) was used to
determine the retardance values. A coarse-grained overview and high quality polarized
light micrographs of specimens A-D are shown in Figs. 4 and 5, respectively.
The coarse-grained views of the specimens (Fig. 2.5) show that small variations are
predominantly in the azimuthal position; axial variations are even milder. High quality
polarized light micrographs (Fig. 2.6) show that the specimens are, in fact, consistent with
Figure 2.4 Motivation for X-ray scattering experiments. a) Cropped images of specimen D acquired in a Zeiss Universal microscope at 4X magnification through crossed linear polarizers equipped with a Canon DS30 digital camera. Based on the Michel-Levy color chart on the right, the optical path difference is 2300-2500 nm. Scale bar is 100 µm. b) Coarse-grained view of specimen D acquired with a Canon PowerShot SD770 IS camera through crossed circular polarizers. Scale bar is 1.0 cm.
[image:30.612.151.496.423.624.2]Figure 2.6 Cropped polarized light micrographs of the top edges of specimens A-D between crossed linear polarizers. The azimuthal position of the segments increases from left to right (Fig. 5, A-D). The Michel Levy color chart shows that the optical path difference is 2300-2500 nm. Scale bar is 100 µm.
Synchrotron X-ray scattering characterization
To characterize the crystalline microstructure of the specimens, we considered the
following quantities: Imax, qmax , q-FWHM, crystallinity index, Φmax, and Φ-FWHM (Fig.
6 shows the definition of the angle Φ for the (110)/(200) peak on the 2D scattering
pattern—not to be confused with the scattering angle 2θ). Because all our specimens come
from the same batch of material and display the same kind of anisotropy, Φ-FWHMcan be
usedas an orientation strength index and q-FWHM as a measure of crystal perfection.22
Scattering patterns acquired at both X27C and X9 of the National Synchrotron
Light Source, Brookhaven National Lab, have (110/200), (203), and (206) peaks (Fig. 2.7),
but no signs of the (103) and (204) peaks. Thus, the dominant crystal phase in the
specimens is α’. At the q value of the (110)/(200) peak there are two bright peaks in the
[image:31.612.199.457.77.304.2]direction. Physically, this corresponds to specimens that are biaxially oriented and have
chain orientation axis predominantly in the azimuthal direction and a secondary orientation
[image:32.612.203.451.158.409.2]axis in the axial direction.23–25
Figure 2.7 Representative scattering pattern of the PLLA specimens acquired at NSLS X27C. The different color arrows point out the three main peaks. From the center out, (110)/(200) peak at q = 1.17 Å-1 (red arrow), (203) peak at q = 1.34 Å-1 (blue arrow), and (206) peak at q = 1.78 Å-1 (yellow
arrow).
Small- and wide-angle X-ray scattering data were acquired at NSLS X9.
Unfortunately, the SAXS signal was overwhelmed by the Kapton substrate supporting the
specimens, precluding further analysis. Therefore, only WAXD data are analyzed to
characterize uniformity of specimens A, C, and D (Figure 2.2; time constraints did not
allow characterization of specimen B). Only one WAXS quadrant was available due to the
special setup of the beamline26 (Fig. 2.16). The q
max for (110)/(200) in every diffraction
pattern was 1.17 Å-1, with negligible standard deviation (1 x10-15 Å-1). The absence of
the α and α’ phases is relatively constant. The values for Imax, q-FWHM (Figure 2.8),
crystallinity index, Φmax,, and Φ-FWHM (Figure 2.8b, Φ defined in Fig. 2.6)were extracted
from 88 scattering patterns per specimen (11 z-positions along each of the 8 beams). The
mean and standard deviation for the 11 Z-positions on a given beam are given in Tables
2.1-2.4 (rows with azimuthal position of the beam). Variations in the axial direction are
evident in the comparison of specimens A, C, and D (averages over all the beams in each
specimen are in the last row of each Table). A visual representation of the data in the tables
Figure 2.8 Definition of quantities used to characterize uniformity. a) Inset: Representative scattering pattern of the PLLA specimens from NSLS X9. Only the quadrant shown above was acquired due to the beamline setup. Graph: A representative I(q) curve . The quantities Imax, qmax,
and q-FWHMare defined. b) A representative I(Φ) curve. The quantities Φmax, and Φ-FWHM are
defined. The I(Φ) curve has only one peak because only one quadrant is available (full pattern has two).
The variation in WAXS Imax,q-FWHM, Φmax, and Φ-FWHM in the axial and azimuthal
direction are presented in tables 2.1-2.4. Figure 2.9 summarizes the tables 2.1, 2.3, and
[image:34.612.192.457.76.515.2]
Table 2.1: Variation of WAXS Imax for each axial beam of specimens A, C, and D.
Imax [counts x 10-6] 1
θ position
[⁰]2 A C D
0 10.6 ± 0.4 9.6 ± 0.1 8.9 ± 0.3 45 10.0 ± 0.4 9.3 ± 0.9 8.6 ± 0.3 90 10.0 ± 0.4 9.6 ± 0.8 8.8 ± 0.4 135 10.5 ± 0.4 10.2 ± 0.7 9.8 ± 0.4 180 10.7 ± 0.5 10.8 ± 0.2 10.5 ± 0.3 225 10.6 ± 0.7 10.7± 0.2 10.1 ± 0.3 270 11.7 ± 0.2 11.0 ± 0.2 9.5 ± 0.3 315 12.9 ± 0.2 10.2 ± 0.1 9.2 ± 0.3 Average 11.0 ± 0.1 10. 2 ± 0.1 9.4 ± 0.7
Table 2.2: Variation of WAXS q-FWHM for each axial beam of specimens A, C, and D.
q-FWHM [Å-1x 10⁻²]
θ position
[⁰] A C D
0 3.06 ± 0.03 2.93 ± 0.05 3.01 ± 0.02 45 3.04 ± 0.03 2.86 ± 0.05 2.94 ± 0.04 90 3.02 ± 0.03 2.91 ± 0.08 2.85 ± 0.04 135 3.05 ± 0.02 2.93 ± 0.05 2.90 ± 0.04 180 2.82 ± 0.03 3.00 ± 0.06 3.06 ± 0.03 225 2.94 ± 0.08 2.96 ± 0.07 2.98 ± 0.04 270 2.92 ± 0.03 2.98 ± 0.05 2.95 ± 0.03 315 3.04 ± 0.03 3.00 ± 0.06 3.07 ± 0.02 Average 2.98 ± 0.09 2.94 ± 0.07 2.97 ± 0.01
1 Each cell of the table represents the average and mean from 11 measurements
Table 2.3: Variation of Φmax for each axial beam of specimens A, C, and D.
Φmax, [⁰]
A C D
0 -2.2 ± 0.4 -1.1 ± 1.0 0.0 ± 0.7 45 -3.5 ± 0.2 -1.0 ± 0.8 -2.3 ± 0.5 90 0.0 ± 0.5 0.8 ± 0.4 -0.9 ± 0.8
135 1.3 ± 0.6 0.3 ± 0.8 0.7 ± 0.9
180 -0.8 ± 0.5 -1.4 ± 1.5 -0.3 ± 0.7 225 -3.8 ± 1.0 -1.5 ± 0.9 -2.2 ± 0.8
270 0.1 ± 0.6 1.6 ±.6 -0.3 ± 0.4
315 0.1 ± 0.6 2.2 ± 2.7 3.3 ± 0.9
Average 1.0 ± 1.8 0.0 ± 1.8 -0.3 ± 1.8
Table 2.4: Variation of Φ-FWHM for each axial beam of specimens A, C, and D.
Φ-FWHM [⁰]
A C D
Figure 2.9 A, C, D): Coarse-grain views of specimens A, C, and D between crossed circular polarizers and corresponding maps showing the variation of quantities extracted from X-ray scattering data. a) Coarse-grain view of the specimen (see electronic document for color). The black dots on the image indicate the correspondence between the approximate physical location of the eleven points examined for each segment and each rectangle on the graph. The vertical scale bar is 1.0 cm. b) Variation in the maximum intensity of the dominant diffraction peak. c) Variation in Φmax [⁰]. d) Variation in Φ-FWHM [⁰]. For B-D in I-III the black rectangles on the graphs indicate
[image:37.612.126.525.74.568.2]2.2.2 Radial variations in as-cut thin sections
To probe variations in structure as a function of position through the thickness of
the expanded PLLA tube, sections 10-15 µm thick were cut starting from the outer diameter
toward the inner diameter from an as-cut subassembly (Methods). To keep track of the
radial position of each section, they were each assigned a number according to the order
they were obtained. Hence, a small number indicates a section closer to the OD and large
number (e.g. 10) indicates a section closer to the ID. Sections near the OD tended to remain
relatively flat (Fig. 2.10 section 2 and Fig 2.11 sections 2 and 3). Sections taken closer to
the ID were observed to curl as soon as they were cut (Fig. 2.10 sections 7, 9, and 12),
indicating substantial frozen-in stresses generated by the tubing expansion process.
Polarized light examination of the sections showed that the sections that exhibited curling
generally had greater retardance, which increased with proximity to the ID (progressing
from 7 to 9 to 12 in Fig. 2.10 and from 5 to 7 to 8 in Fig 2.11).
Figure 2.11: Polarized light micrographs of 10-13 µm thick sections acquired in a Zeiss Universal microscope through crossed linear polarizers equipped with a Canon EOS DS30 camera. The thin sections were cut from U crests (Fig. 2.13, Methods) in the radial direction. The smallest number corresponds to the section closest to the outer diameter of the scaffold subassembly. Curling is only observed for section 5; the retardance increases at about 70 µm from the outer surface of the as-cut subassembly. Scale bar is 100 µm.
2.3 Discussion
2.3.1 Axial and Azimuthal variations
The coarse-grained views of the specimens (Fig. 2.4) show that the Michel-Levy
colors are almost constant along any individual beam, which indicates that axial variations
are very small. Moving from one beam to the next (azimuthal steps of 45° going around
the PLLA tube, Fig.2.2) the Michel-Levy color only varies in the range between a green
and an adjacent pink in the same order. Detailed analysis of the specimens using waveplates
(Fig. 2.14) indicates that the order of the retardance is beyond the fourth order, such that
the change from pink (~2360 nm) to green (~2500 nm) is approximately a 6% change in
retardance as a function of azimuthal position. In the axial direction, each individual sample
covers a distance of approximately 3 cm (Fig.2.4) and the set of four specimens spans more
than 12cm (Fig. 2.5). Even across the greater distance of A-D the retardance only ranges
from fourth order yellow (~2260 nm) to fourth order green (~2500 nm)—less than 10%
variation over a length scale of more than 12cm (Fig. 2.7). Thus, small variations are
A more quantitative interpretation of the birefringence of a semicrystalline material
is difficult because it depends on multiple contributions: the degree of crystallinity (volume
fraction Xc), the orientation distribution of the crystallites, and the level of frozen-in stresses that leads to birefringence in the amorphous material. Throughout the thickness of the
present expanded tube of PLLA, the principal axes are along the azimuthal direction and
the axial direction, so the total birefringence can be expressed additively. A primitive
two-component equation suffices to show the challenge of interpreting the overall
birefringence:
∆𝑛 = 𝑓𝑐∆𝑛𝑐∗𝑋𝑐+ 𝑓𝑜𝑎∆𝑛𝑜𝑎𝑋𝑜𝑎 (2.1)
where fc and foa are the orientation factors of the crystallites and the oriented amorphous,
∆𝑛𝑐∗ is the intrinsic birefringence of the crystallites, ∆𝑛
𝑜𝑎 is the birefringence of the oriented
amorphous, and Xoa = 1- Xc are the volume fractions of each component. The literature value of the intrinsic birefringence of PLLA crystals is not precisely known: Furuhashi et
al. further determined the intrinsic birefringence for a purely α morph crystalline phase to
be 0.031,27 slightly higher than the highest value observed by Kobayashi28 and Okhoshi29
for oriented fibers. The birefringence of oriented amorphous PLLA depends on the
magnitude of frozen-in stresses; as a representative value, Furuhashi et al. report a
birefringence of 0.015.27
The present PLLA specimens are 150 µm thick and exhibit retardance of 2300 to
2500 nm, corresponding to a birefringence of 0.014 - 0.016. Given the literature values for
crystalline and oriented amorphous PLLA, this retardance could be explained by a fully
crystalline with highly oriented crystallites and 50% unoriented amorphous—or anything
in between. This illustrates that polarized light microscopy alone cannot be used to evaluate
volume fractions and orientation factors. For that level of detail, we turn to wide-angle
X-ray scattering.
The variation in the maximum intensity of the dominant diffraction peak is typically
about 4% for the measurements on a particular beam (specified by θ, Figs. 2-3), as indicated
by the standard deviations (Table 2.1). Specimen A shows systematically stronger
diffracted intensity, but only 0.8% greater than C and approximately 1.5% greater than D.
In the azimuthal direction, the variations are readily observable, varying from 10%
variation in specimen C to 20% variation in specimens A and D (see variations in Imax
values as θ increases from 0° to 315° for each specimen in Table 2.1). These are consistent
with inferences made using polarized light microscopy. The above uniformity is also seen
in the degree of order of the crystallites (Table 2.2), the dominant orientation directions
(Table 2.3), the distribution of orientation (Table 2.4), and the crystallinity index (Table
2.5).
2.3.2 Radial variations
The polarized light micrographs of thin sections progressing from OD to ID (Figs.
2.10-11, left to right) show that that the outermost 40-50 microns of the expanded tube
have low anisotropy (first order silver Michel-Levy color, retardance ca. 280nm) and low
frozen-in stresses (they hardly curl up). Progressing toward the ID, there is evidence of a
more strongly oriented region in the innermost 50-70 microns (first order gold to first order
red, retardance 420 to 560nm), which has significant frozen-in stresses (tight curl). It is
differences in retardance than are seen over 12cm in the axial direction. A
semi-quantitative comparison of the magnitude of the gradients could be based on the change in
retardance divided by the distance over which the change occurs: axially, 10% change over
12 cm; azimuthally, 6% change over 1 cm; and radially, 100% change over 50 μm. Thus,
relative to the axial structure variations, the gradients in the azimuthal direction are 10X
greater—and those in the radial direction are 10,000X greater.
2.4 Conclusions
Bioresorbable scaffold performance depends on the uniformity of the expanded
tube, which is crucial for consistent deformation during subsequent crimping and
deployment.3 Processing of PLLA is known to be very difficult because even small
fluctuations in water content, processing temperature and stereoregularity have a dramatic
effect on the final morphology and material properties8. Here, we have used
complementary materials characterization methods to interrogate structural variations in
the axial, azimuthal, and radial directions. Polarized light microscopy and extensive
sampling with synchrotron X-ray scattering have shown that the tube has remarkable axial
uniformity and mild azimuthal variations. In contrast, radial gradients are substantial. The
strongly oriented structure that is present near the ID of the expanded PLLA tube may
provide much of the strength that holds the lumen open in the early months after
implantation.30 This materials characterization approach can be extended to examine the
time course of hydrolytic degradation in vitro or bioresorption in vivo. For example, future work may examine the relationship between radial gradients in structure and the
2.5 Methods
2.5.1 Materials
Axial beam specimens
Four specimens were laser cut from the same PLLA expanded tube (Fig.2.2). Each
specimen was laser cut to create eight equally spaced, 25.0 mm x 0.6 mm axial beams with
azimuthal separation 45°. The beams are held together by thin “connectors.” A black mark
indicates the 0° azimuthal position. The beam specimens were provided by Abbott
Vascular.
Thin sections of as-cut subassemblies
Individual subassembly rings were emdedded in TissueTek (Sakure), glued into screws,
and then transferred to the microtome to equilibrate at -25 ⁰C for 20 minutes. Thin sections
10-15 µm thick were microtomed using a glass knife in the radial direction from an as-cut
subassembly using a Powertome XL (RMC Products). The thin sections were provided by
Abbott Vascular.
Figure 2.12 Image of an as-cut sub-assembly with boxes indicating the W, Y, and U struts.
2.5.2 Polarized light examination
Optically anisotropic materials have a refractive index that varies with the direction
is refracted into two rays: one that travels with the same velocity through the material and
one that depends on the propagation direction within the material. These rays are mutually
perpendicular and they are referred to as ordinary and extraordinary, respectively.32
The difference in refractive indices, Δn, between the extraordinary and ordinary rays is called birefringence. In polymers, birefringence may be caused by different crystal
orientations and/or frozen-in stresses.31 When multiple rays of light pass through a
birefringent material of thickness t, one of the rays will be retarded with respect to a faster
ray; this velocity difference is referred to as the retardance (Eq. 2.2) and gives rise to the
colors observed when the sample is placed between crossed linear polarizers.32 The
retardance colors are classified into orders according to the Michel-Levy chart31, and can
be used to identify the value of birefringence of a specimen of known thickness.
𝑅𝑒𝑡𝑎𝑟𝑑𝑎𝑛𝑐𝑒 = 𝑡(𝑛𝑚) × ∆𝑛 (2.2)
Coarse grained-views
Coarse-grained views of each specimen were acquired by placing the specimens between
two circularly polarized sheets and taking photographs with a Canon Elf 10.0 MP camera.
Micrographs
Polarized light micrographs were acquired in a Zeiss Universal microscope at 4X
magnification through crossed linear polarizers equipped with a Canon EOS DS30 camera.
Assignment of Michel Levy colors
To determine the order of Michel Levy colors, a connector from specimen D was imaged
using different wave plate compensators (Fig. 2.14). The color transitions after adding [-1,
-1/4, 0, +1/4 and + 1] wavelengths (λ) were observed and compared to the Michel-Levy
point of symmetry between the same order of red. Using the +λ and -λ red bands as
reference, the sample’s middle red band was determined to be a 3° red. Moving toward the
upper portion of the connector, the colors transition to a higher order (higher retardance).
In the case of –λ, based on the aforementioned symmetry, the pink band immediately above
the 2° red is the 3° red. In the case of +λ, the absence of a distinct yellow band above the
4° red indicates that the upper pink colored band is the 5° red. Given that the progression
of colors toward the upper half is the same, the next band moving up is the 4° red.
Comparison with the –λ and +λ case shows that the green and light peach/pink colors
observed in the above the 4° red must then be in the 5° order and they correspond to a
retardance of approximately 2500 nm.
green, yellow, peach). By assigning the colors obtained with a full wave subtracted, the retardance of the sample (centermost of the five images) is obtained. Moving from the point of least retardance in the connector to the beam at the top of the image, the retardance increases monotonically, allowing us to assign the order of the retardance in the beam (given in Figures 2.4 and 2.6). The thin black border above the Michel-Levy colors at the bottom of the figure has white marks at 565, 1130, 1685, 2260, and 2825nm. Using the Michel Levy Chart, the green color of the beam is found to correspond to an OPD of approximately 2500 nm.
2.5.3 X-ray scattering
X-ray scattering experiments were performed at beamlines X27C and X9 at the National
Synchrotron Light Source at Brookhaven National Lab (NSLS).
NSLS X27C: Wide-angle X-ray scattering (WAXS) patterns were collected using a MarCCD detector at a distance of 134.8 mm from the samples. The source wavelength was
1.371 Å and the beam spot size was 380 μm. The diffraction patterns were calibrated for
centering and detector distance using an alumina (Al2O3) standard. Each specimen was
placed between three or four layers of X-ray transparent Kapton tape. Two WAXS patterns
were acquired at different axial locations for each set, with two patterns per beam width.
Radial and azimuthal integrations were performed using the software Polar® at the
beamline’s work station. Further data processing was done using Matlab® algorithms
developed in-house.
NSLS X9: Wide- and small-angle scattering patterns were collected simultaneously for specimens A, C, and D, with a source wavelength of 0.92 Å and beam spot size of 20
μm. Eleven scattering patterns were acquired at approximately the same axial locations 2.5
mm apart. There was no data acquisition for specimen D due to time limitations. A custom
Photonics detector26 placed at 45° with respect to the plane of the sample captured a
quadrant of the wide-angle scattering pattern (Fig. 2.15). Small-angle X-ray scattering
of 185 mm. Both WAXS and SAXS diffraction patterns were calibrated for centering and
detector distance using silver behenate (AgC22H43O2). Calculation of radial and azimuthal
intensity profiles and further data processing was done using Matlab® algorithms
developed in-house.
Figure 2.14 The setup of beamline NSLS X9. a) Diagram of the optical train and the detector positions. b) The special Photonics detector is placed to the side of the SAXS detector. Figure adapted from Lin, 2013.
2.5.4 Data analysis
To compare X-ray scattering data from different beamlines, image analysis code
was developed using MATLAB®. This code was used to obtain radial and azimuthal
intensity profiles, and to extract quantitative values for maximum intensity, crystal
orientation, and crystal spacing. All data was pre-processed for background subtraction and
incident intensity variation. Some scattering patterns in each set had a very low intensity
[image:47.612.159.488.220.459.2]sample due to motor drift during the automated data acquisition. These outliers were
removed by excluding the 2D patterns whose maximum intensity was less than 75% of the
entire data set’s mean intensity.
References
(1) Onuma, Y.; Serruys, P. W. Bioresorbable Scaffold: The Advent of a New Era in Percutaneous Coronary and Peripheral Revascularization? Circulation2011, 123, 779– 797.
(2) Oberhauser, J. P.; Hossainy, S.; Rapoza, R. J. Design Principles and Performance of Bioresorbable Polymeric Vascular Scaffolds BVS ABSORB Cohort B Device.
EuroIntervention5, 15–22.
(3) City, F. Stent Tubing : Understanding the Desired Attributes. 2003.
(4) Sarasua, J. R.; Arraiza, a. L.; Balerdi, P.; Maiza, I. Crystallinity and Mechanical Properties of Optically Pure Polylactides and Their Blends. Polym. Eng. Sci.2005, 45, 745–753.
(5) Takagi, J.; Nemoto, T.; Takahashi, T.; Taniguchi, T.; Koyama, K. Improvement of Mechanical Properties for Poly (L-Lactic Acid) Film through Drawing Process Optimization. Fiber2004, 60, 230–234.
(6) Oca, H. M. D. E.; Ward, I. M. Structure and Mechanical Properties of Poly (L -Lactic Acid) Crystals and Fibers. J. Polym. Sci. Part B Polym. Phys.2007, 45, 892–902.
(7) Cocca, M.; Lorenzo, M. L. Di; Malinconico, M.; Frezza, V. Influence of Crystal
Polymorphism on Mechanical and Barrier Properties of Poly(l-Lactic Acid). Eur. Polym. J.2011, 47, 1073–1080.
(8) Lim, L.-T.; Auras, R.; Rubino, M. Processing Technologies for Poly(lactic Acid). Prog. Polym. Sci.2008, 33, 820–852.
(9) Tsuji, H.; Ogiwara, M.; Saha, S. K.; Sakaki, T. Enzymatic, Alkaline, and Autocatalytic Degradation of poly(L-Lactic Acid): Effects of Biaxial Orientation. Biomacromolecules 2006, 7, 380–387.
(10) Agrawal, C. M.; Haas, K. F.; Leopold, D. a; Clark, H. G. Evaluation of poly(L-Lactic Acid) as a Material for Intravascular Polymeric Stents. Biomaterials1992, 13, 176–182.
(12) Mano, J. F.; Gómez Ribelles, J. L.; Alves, N. M.; Salmerón Sanchez, M. Glass Transition Dynamics and Structural Relaxation of PLLA Studied by DSC: Influence of Crystallinity.
Polymer2005, 46, 8258–8265.
(13) Wang, Y.; Funari, S. S.; Mano, J. F. Influence of Semicrystalline Morphology on the Glass Transition of Poly(L-Lactic Acid). Macromol. Chem. Phys.2006, 207, 1262–1271.
(14) Pham, X.-T.; Thibault, F.; Lim, L.-T. Modeling and Simulation of Stretch Blow Molding of Polyethylene Terephthalate. Polym. Eng. Sci.2004, 44, 1460–1472.
(15) Belcher, S. Blow Molding. In Encyclopedia of Polymer Science and Technology Vol. 1; 2002; Vol. 1.
(16) Henton, D. E.; Gruber, P.; Lunt, J.; Randall, J. Natural Fibers, Biopolymers, and Biocomposites 16. Polylactic Acid Technology. In Natural Fibers, Biopolymers, and Biocomposites; 2005; pp. 527–578.
(17) Wasanasuk, K.; Tashiro, K. Crystal Structure and Disorder in Poly(l-Lactic Acid) Δ Form (α′ Form) and the Phase Transition Mechanism to the Ordered Α Form. Polymer2011, 52, 6097–6109.
(18) Stoclet, G.; Seguela, R.; Lefebvre, J. M.; Elkoun, S.; Vanmansart, C. Strain-Induced Molecular Ordering in Polylactide upon Uniaxial Stretching. Macromolecules2010, 43, 1488–1498.
(19) Stoclet, G.; Séguéla, R.; Lefebvre, J. M.; Li, S.; Vert, M. Thermal and Strain-Induced Chain Ordering in Lactic Acid Stereocopolymers: Influence of the Composition in Stereomers. Macromolecules2011, 44, 4961–4969.
(20) Wasanasuk, K.; Tashiro, K.; Hanesaka, M.; Ohhara, T.; Kurihara, K.; Kuroki, R.; Tamada, T.; Ozeki, T.; Kanamoto, T. Crystal Structure Analysis of Poly (L -Lactic Acid ) Alpha Form On the Basis of the 2-Dimensional Wide-Angle Synchrotron X-Ray and Neutron Diffraction Measurements. Macromolecules2011, 44, 6441–6452.
(21) Kawai, T.; Rahman, N.; Matsuba, G.; Nishida, K.; Kanaya, T.; Nakano, M.; Okamoto, H.; Kawada, J.; Usuki, A.; Honma, N.; et al. Crystallization and Melting Behavior of Poly (L-Lactic Acid). Macromolecules2007, 40, 9463–9469.
(22) Alexander, L. E. X-Ray Diffraction Methods in Polymer Science; Wiley Interscience: New York, 1969.
(23) Stoclet, G.; Seguela, R.; Vanmansart, C.; Rochas, C.; Lefebvre, J.-M. WAXS Study of the Structural Reorganization of Semi-Crystalline Polylactide under Tensile Drawing.
Polymer2012, 53, 519–528.
(25) Gerrits, N. J. A.; Young, R. J.; Lemstra, P. J. Tensile Properties of Biaxially Drawn Polyethylene. Polymer1990, 31, 231–236.
(26) Yang, L. Using an in-Vacuum CCD Detector for Simultaneous Small- and Wide-Angle Scattering at Beamline X9. J. Synchrotron Radiat.2013, 20, 211–218.
(27) Furuhashi, Y.; Kimura, Y.; Yamane, H. Higher Order Structural Analysis of Stereocomplex-Type Poly ( Lactic Acid ) Melt-Spun Fibers. 2006, 4–6.
(28) Kobayashi, J.; Asahi, T.; Ichiki, M.; Oikawa, a.; Suzuki, H.; Watanabe, T.; Fukada, E.; Shikinami, Y. Structural and Optical Properties of Poly Lactic Acids. J. Appl. Phys.1995,
77, 2957.
(29) Ohkoshi, Y.; Shirai, H.; Gotoh, Y.; Nagura, M. Intrinsic Birefringence of Poly (L-Lactic Acid). Sen-I Gakkaishi1999, 55, 21–27.
(30) Onuma, Y.; Ormiston, J.; Serruys, P. W. Bioresorbable Scaffold Technologies. Circ. J. 2011, 75, 509–520.
(31) Robinson, P. C.; Bradbury, S. Qualitative Polarized Light Microscopy; Oxford University Press, Royal Microscopical Society, 1992; pp. 8–14.
CHAPTER 3
Effect of Crimping on Scaffold Morphology
3.1 Introduction
Prior to implantation in the artery, the as-cut scaffold subassembly must be crimped
(Fig. 3.1) and adhered onto a flexible catheter that can be guided through the vascular
system. During crimping, the outer bends of the Y, W, and U crests (Fig. 3.1) of the as-cut
subassembly are elongated and the inner bends are compressed until the scaffold is in full
contact with the balloon and its outer diameter decreases 50-70%. Most stent effectiveness
studies do not take into account the effect of crimping on deployment; in fact, some authors
have stated that the crimping has a “minor influence on the overall expansion of the stent.1”
However, a few studies have studied the impact of crimping on commercial metal stents
and found that the crest bends store residual stresses from the deformation during
crimping.2–5 Nevertheless, to the best of our knowledge, no studies have addressed the
microstructural changes of polymeric scaffolds, which are extremely important for