Anomalous dependence of the
c
-axis polarized Fe
B
1gphonon mode with Fe and Se
concentrations in Fe
1+yTe
1−xSe
xY.J. Um,1 A. Subedi,1 P. Toulemonde,2 A.Y. Ganin,3 L. Boeri,1 M. Rahlenbeck,1 Y. Liu,1 C.T. Lin,1 S.J.E. Carlsson,2 A. Sulpice,2, 4 M.J. Rosseinsky,3 B. Keimer,1 and M. Le Tacon1
1Max-Planck-Institut f¨ur Festk¨orperforschung, Heisenbergstrasse 1, D-70569 Stuttgart, Deutschland
2
Institut N´eel, CNRS& UJF, 25 avenue des martyrs, F-38042 Grenoble cedex 09, France
3Department of Chemistry, University of Liverpool, Liverpool, L69 7ZD, United Kingdom
4CRETA, CNRS &UJF, 25 avenue des martyrs, F-38042 Grenoble cedex 09, France
(Dated: February 24, 2012)
We report on an investigation of the lattice dynamical properties in a range of Fe1+yTe1−xSex
compounds, with special emphasis on the c-axis polarized vibration of Fe with B1g symmetry, a
Raman active mode common to all families of Fe-based superconductors. We have carried out a
systematic study of the temperature dependence of this phonon mode as a function of Se x and
excess Feyconcentrations. In parent compound Fe1+yTe, we observe an unconventional broadening
of the phonon between room temperature and magnetic ordering temperature TN. The situation
smoothly evolves toward a regular anharmonic behavior as Te is substituted for Se and long range magnetic order is replaced by superconductivity. Irrespective to Se contents, excess Fe is shown
to provide an additional damping channel for theB1g phonon at low temperatures. We performed
Density Functional Theoryab initiocalculations within the local density approximation to calculate the phonon frequencies including magnetic polarization and Fe non-stoichiometry in the virtual crystal approximation. We obtained a good agreement with the measured phonon frequencies in the Fe-deficient samples, while the effects of Fe excess are poorly reproduced. This may be due to excess Fe-induced local magnetism and low energy magnetic fluctuations that can not be treated accurately within these approaches. As recently revealed by neutron scattering and muon spin rotation studies, these phenomena occur in the temperature range where anomalous decay of the B1g phonon is observed and suggests a peculiar coupling of this mode with local moments and spin fluctuations in Fe1+yTe1−xSex.
PACS numbers: 74.70.Xa, 74.25.nd, 74.25.Kc
I. INTRODUCTION
The recent discovery of superconductivity in F-doped LaFeAsO with Tc of ∼ 26 K created a flurry of
ex-citement in condensed matter research.1 Rapidly, nu-merous families of Fe-based superconductors such as
REFeAs(O1−xFx) (1111-family, RE = rare earth),
MFe2As2 (122-family, M = Ba, Ca, Sr, K, Cs ...), LiFeAs/NaFeAs (111-family) and Fe1+yTe1−xSex
(11-family)2–8 have been found and investigated. Al-though the Fe1+yTe1−xSexchalcogenides share with their
pnictogen-based cousins similar structure, based on pla-nar layers of edge sharing [Fe(Se,Te)]4 tetrahedra, some significant differences were rapidly revealed. Among them are the large magnetic moment (∼ 2.0-2.5 µB)
and the double stripe magnetic ordering of the parent Fe1+yTe compound.9,10 Magnetic stripes are found in
other Fe-based parent compounds such as BaFe2As2 or LaFeAsO stripes in pnictides, but they are rotated by 45◦around thec-axis with respect to Fe1+yTe,10–13 with
significantly lower magnetic moments on Fe in these com-pound (typically 0.4-1.0µB/iron14,15).
The magnetic ordering is accompanied by a structural transition (TN ∼67K),9which can be progressively
sup-pressed on substitution of isovalent Se at the Te 2b Wyck-off position. This also results in emergence of supercon-ductivity with aTmax
c ∼14 K at ambient pressure at the
optimum doping.6,7 However, numerous reports have re-cently demonstrated that the excess of interstitial Fe be-tween the chalcogenide layers, even after doping with Se, could affect both superconducting and magnetic prop-erties, e.g. suppression of transition temperature Tc or
lowering shielding fraction, as well as leading to the ap-pearance of weakly localized magnetic states.16–22
Raman spectroscopy is an ultimate noninvasive tool and can allow systematic studies of the temperature de-pendence of the phonon spectrum as function of Se and excess of interstitial Fe. For example, Raman spec-troscopy has proved useful in the understanding of the structural, magnetic and electronic properties of super-conducting pnictides. 23–36 Available Raman data on single crystals of Fe1+yTe1−xSex is to date limited. In
refs. 37 and 38, comparison between Se-substituted and parent Fe1+yTe samples is made, but neither
tempera-ture dependence nor influence of the excess iron concen-tration on the lattice dynamics are discussed. In ref. 39, the authors study the evolution with temperature of the Raman spectra of Fe1.05Te, with a particular emphasis on the anomalously large lineshape of the TeA1gphonon. It
is argued to originate from a peculiar spin-orbital frustra-tion effect, that leaves unaffected the B1g phonon after
symmetry considerations.
In this paper, we focus mainly on this Raman active
c-axis polarized optical phonon in Fe1+yTe1−xSex, which
is common to all the iron-based superconductors families, and discuss its evolution with temperature for various Fe,
y, and Se content,x. We can demonstrate that contrarily
to the A1g mode, the observed temperature dependence
is strongly affected by composition. To some extent, the phonon behavior through the various phases transitions (depending of the Se content) is consistent with those of the c-axis polarized Fe modes reported in the other families of Fe-based superconductors (e.g. 122 and 111). The narrowing of the phonon lineshape through the mag-netic transition of the parent compound or the absence of renormalization through the superconducting one are for instance reported. On the other hand, we also show that in some specific conditions, the behavior of theB1g
mode seriously deviates from the aforementioned one. The phonon linewidth shows an anomalous broadening in the paramagnetic state of Fe1+yTe parent compounds
and an unusually strong dependence with the Se con-centration in the doped compounds. Further anomalies, indicative of additional decay channels, are found when increasing the concentration of excess Fey.
To try to get some insights about the influence of ex-cess iron on the Raman phonon, we have carried out a Density Functional Theory (DFT) ab initio calcula-tion within the local density approximacalcula-tion (LDA) of the phonon frequencies, including the effects of magnetism and Fe nonstoichiometry in the virtual crystal approx-imation (VCA). The measured frequencies are in good agreement with the predicted ones, including a softening with increasing Fe content in Fe deficient samples, but the effects of Fe nonstoichiometry are poorly reproduced. Recent studies of magnetic properties have revealed that excess Fe induces local magnetism and low energy magnetic fluctuations,21,40 but these can not be treated within our DFT approaches. Generally speaking, when-ever low-energy magnetic fluctuations are at play, the B1gphonon behavior deviates from the conventional
har-monic picture and cannot be reproduced within our the-oretical framework. This suggests that the reported anomalies originate from coupling between theB1gmode
and these excitations.
II. EXPERIMENTAL DETAILS
In order to discriminate the effects of Fe excess and of Se substitution, we have studied different groups of crystals, listed in Table I. In the first group, no Se was present and only the Fe concentration was changed Fe1+yTe (Fe1.02Te, Fe1.09Te). In the second group we changed the Se concentration while keep-ing the Fe concentration as close from 1 as possible (Fe1.00Te0.78Se0.22, Fe0.99Te0.69Se0.31, Fe0.98Te0.66Se0.34 and Fe0.95Te0.56Se0.44). Finally, we also studied Se-substituted samples containing sizable excess iron (Fe1.05Te0.58Se0.42, Fe1.08Te0.73Se0.27). Fe1+yTe1−xSex
[image:2.612.316.560.90.508.2]single crystals were grown in sealed quartz tube as de-scribed elsewhere41–44. The chemical compositions listed
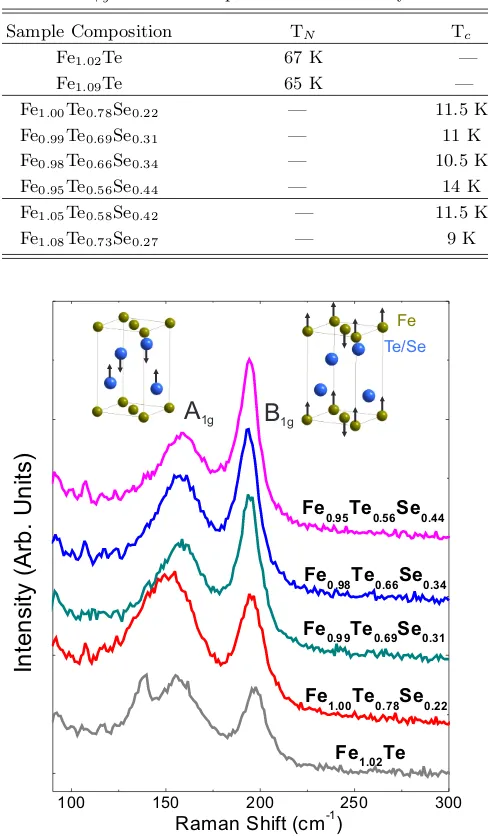
TABLE I: A summary of the chemical compositions obtained by EDX and characteristic transitions temperatures of the various Fe1+yTe1−xSex samples used in this study.
Sample Composition TN Tc
Fe1.02Te 67 K —
Fe1.09Te 65 K —
Fe1.00Te0.78Se0.22 — 11.5 K
Fe0.99Te0.69Se0.31 — 11 K
Fe0.98Te0.66Se0.34 — 10.5 K
Fe0.95Te0.56Se0.44 — 14 K
Fe1.05Te0.58Se0.42 — 11.5 K
Fe1.08Te0.73Se0.27 — 9 K
100 150 200 250 300
In
te
n
s
it
y
(A
rb
.
U
n
it
s
)
Raman Shift (cm-1)
Fe1.00Te0.78Se0.22
Fe1.02Te Fe0.99Te0.69Se0.31 Fe0.98Te0.66Se0.34 Fe0.95Te0.56Se0.44
A
1gB
1gFe Te/Se
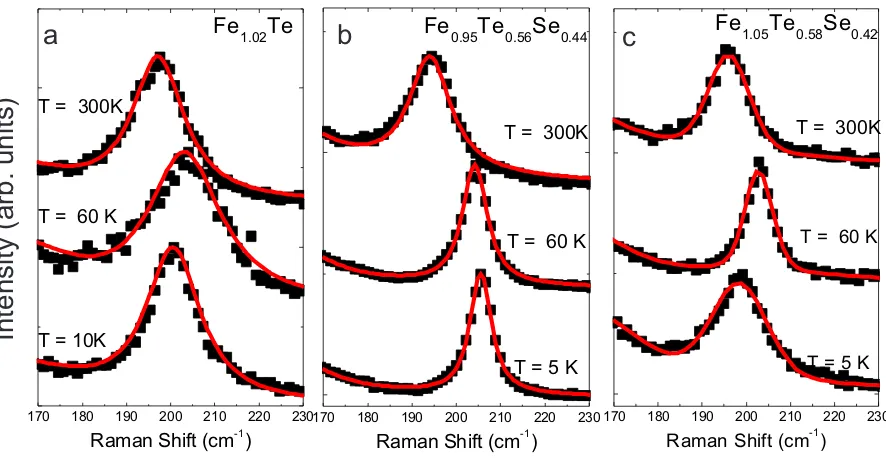
FIG. 1: (Color online) Room temperature Raman
spec-tra of the Fe1.02Te, Fe1.00Te0.78Se0.22, Fe0.99Te0.69Se0.31,
Fe0.98Te0.66Se0.34, and Fe0.95Te0.56Se0.44 samples (see
Ta-ble I). Spectra have been shifted vertically for clarity.
Eigendisplacements corresponding to the A1g(Te/Se) and
B1g(Fe) are represented schematically.
in Table I were determined using energy dispersive x-ray spectroscopy (EDX), and the antiferromagnetic (AF) and superconducting (SC) transition temperaturesTN andTc
were measured by use of a superconducting quantum in-terference device magnetometer.
All Raman light scattering experiments were per-formed on freshly cleaved surface of Fe1+yTe1−xSexsingle
ge-170 180 190 200 210 220 230
Raman Shift (cm-1)
T = 60 K
Fe
1.02
Te
T = 10K T = 300K
170 180 190 200 210 220 230
Raman Shift (cm-1)
Fe
0.95
Te
0.56Se
0.44T = 300K
T = 60 K
T = 5 K
170 180 190 200 210 220 230
Raman Shift (cm-1)
T = 300K
Fe
1.05
Te
0.58Se
0.42T = 60 K
T = 5 K
a
b
c
Intensity (arb. units)
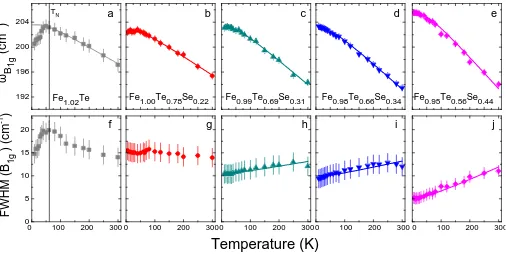
FIG. 2: (Color online) a)B1g phonon of the Fe1.02Te sample for selected temperatures (room temperature,T ∼TN and base temperature). Black squares are the data, and the red line is the fit following the procedure described in the text. Phonon intensity have been normalized and the spectra have been shifted vertically for clarity. b) Same plot for the Fe0.95Te0.56Se0.44
sample. c) same plot for the Fe1.05Te0.58Se0.42sample.
ometry through a JobinYvon LabRam 1800 single grat-ing spectrometer equipped with a razor-edge filter and a Peltier-cooled charge-coupled-device camera. We used a linearly polarized He+/Ne+ mixed gas laser with λ= 632.817 nm for excitation. The laser beam was focused through a 50×microscope objective to∼5 µm diameter spot on the sample surface. The power of the incident laser was kept less than 1 mW to avoid laser-induced heating. In order to determine the precise frequency of phonons for each temperature, Neon emission lines were recorded between each measurements. For data analy-sis, all phonon peaks were fitted by Lorentzian profiles, convoluted with the spectrometer resolution function (a Gaussian line of 2 cm−1 full width at half maximum (FWHM)).
III. EXPERIMENTAL RESULTS
A. Influence of Se doping
In Fig. 1 we show the Raman spectrum measured at room temperature on the Se-free Fe1.02Te sample, together with the Fe1.00Te0.78Se0.22, Fe0.99Te0.69Se0.31, Fe0.98Te0.66Se0.34and Fe0.95Te0.56Se0.44superconducting samples that all have a Fe stoichiometry close to 1. From symmetry consideration, one expects four Raman active modes: A1g(Te/Se), B1g(Fe), Eg(Te), Eg(Fe). Raman
measurement have been performed in backscattering ge-ometry, with the incident light polarization along the a-axis of the single crystal. An analyzer has been used to check the phonon selection rules, but most of the mea-surements presented here have been performed without in order to maximize the phonon peak intensities.
In this scattering geometry, only the A1g(Te/Se) and
B1g(Fe) modes, sketched in Fig. 1, are present. As seen in
[image:3.612.87.530.119.348.2]1 4 8 1 5 2 1 5 6 1 6 0 1 6 4 1 6 8
F e 1 . 0 2 T e
a
F e 0 . 9 9 T e 0 . 6 9 S e 0 . 3 1
b
T e m p e r a t u r e ( K )
ω
A1
g
(
c
m
-1
)
F
W
H
M
(
A
1g
)
(c
m
-1
)
F e 1 . 0 0 T e 0 . 7 8 S e 0 . 2 2
c
F e 0 . 9 8 T e 0 . 6 6 S e 0 . 3 4
d
F e 0 . 9 5 T e 0 . 5 6 S e 0 . 4 4
e
0 1 0 0 2 0 0 3 0 0
0
1 0 2 0 3 0 4 0
f
g
h
i
j
0 1 0 0 2 0 0 3 0 0 0 1 0 0 2 0 0 3 0 0 0 1 0 0 2 0 0 3 0 0 0 1 0 0 2 0 0 3 0 0
FIG. 3: (Color online) Upper panel: Temperature dependence of the A1g(Te/Se) mode frequency of the a) Fe1.02Te, b)
Fe1.00Te0.78Se0.22, c) Fe0.99Te0.69Se0.31, d) Fe0.98Te0.66Se0.34, and e) Fe0.95Te0.56Se0.44 samples. Lower panel: Temperature
dependence of theA1g(Te/Se) mode FWHM of the f) Fe1.02Te, g) Fe1.00Te0.78Se0.22, h) Fe0.99Te0.69Se0.31, i) Fe0.98Te0.66Se0.34,
and j) Fe0.95Te0.56Se0.44samples.
1 9 2 1 9 6 2 0 0
2 0 4
a
T
N
F e 1 . 0 2 T e F e 1 . 0 0 T e 0 . 7 8 S e 0 . 2 2 F e 0 . 9 9 T e 0 . 6 9 S e 0 . 3 1 F e 0 . 9 8 T e 0 . 6 6 S e 0 . 3 4 F e 0 . 9 5 T e 0 . 5 6 S e 0 . 4 4
b
T e m p e r a t u r e ( K )
ω
B1
g
(
c
m
-1
)
F
W
H
M
(
B
1g
)
(c
m
-1
)
c
d
e
0 1 0 0 2 0 0 3 0 0
0
5
1 0 1 5
2 0
f
g
h
i
j
[image:4.612.56.561.62.318.2]0 1 0 0 2 0 0 3 0 0 0 1 0 0 2 0 0 3 0 0 0 1 0 0 2 0 0 3 0 0 0 1 0 0 2 0 0 3 0 0
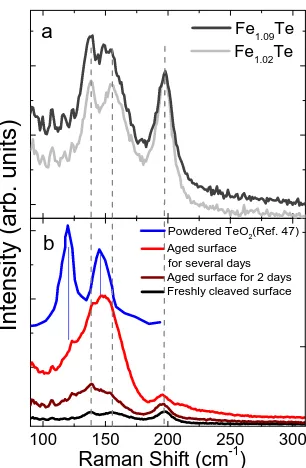
FIG. 4: (Color online) Upper panel: Temperature dependence of the B1g(Fe) mode frequency of the a) Fe1.02Te, b)
Fe1.00Te0.78Se0.22, c) Fe0.99Te0.69Se0.31, d) Fe0.98Te0.66Se0.34, and e) Fe0.95Te0.56Se0.44 samples. Lower panel: Temperature
dependence of the B1g(Fe) mode full-width-half-maximum of the f) Fe1.02Te, g) Fe1.00Te0.78Se0.22, h) Fe0.99Te0.69Se0.31, i)
[image:4.612.56.562.397.651.2]cm−1 at room temperature, respectively, in agreement with previous reports37–39. These two peaks are much broader than in any of the other iron pnictides25–27. The largeA1gmode linewidth (∼20 cm−1 at room
tempera-ture in Fe1.02Te, almost 3 times larger than theA1g As
mode in BaFe2As225) has been attributed to spin-orbital frustration effects.39In the parent Fe1.02Te single crystal, an additional peak was observed around 136 cm−1. The origin of this mode remains unclear. It is temperature independent (and cannot, therefore, be attributed to the lowering of the crystal symmetry induced by the struc-tural transition), and has been observed irrespective of the Fe excess concentration (see Fig. 5-a). It is not ob-served in the Se-rich compounds (see Fig. 1). In contrast with the results of Xia et al. in ref. 37, claiming the disappearance of theA1g mode in the Raman spectra of
FeTe0.92 and Fe1.03Te0.7Se0.3 with increasing Se concen-tration, the mode is clearly visible in all the investigated compounds.
The frequency of the two phonons is weakly dependent on Se contents: at the lowest recorded temperatures (5 K) it remains essentially constant for Se contents between 22% and 34% (Fe1.00Te0.78Se0.22and Fe0.98Te0.66Se0.34), while a small hardening (∼2 cm−1) is observed for the sample with 44% of Se (Fe0.95Te0.56Se0.44). This latter effect may be caused by the significant Fe deficiency in the Fe0.95Te0.56Se0.44 sample (see Secs. IV and V B 2). Within our experimental errors, this seems to be also the case for the A1g phonon, as trivially expected from the
substitution of Te with lighter Se (the mode frequency going, in first approximation, asM−1/2, withM denot-ing the reduced mass of the considered oscillator). The only noticeable exception, is the Fe1.00Te0.78Se0.22 sam-ple, where theA1gmode is broader and softer than in any
other compounds. This may originate from an overlap-ping of theA1gmode with the 136 cm−1peak observed in
the parent compounds. It seems that for this particular doping level the modes energies are still separated enough to cause an apparent broadening and shift to lower fre-quency of the total envelope, but not enough to allow to resolve them individually.
In Figs. 2-a and -b, we show details of the fitting for the Fe1.02Te and Fe0.95Te0.56Se0.44 samples, that illus-trates one of the main finding of our study, i.e. the strong changes in the temperature dependence of theB1g
phonon on doping. In the undoped Fe1.02Te sample, the B1g mode hardens and broaden with decreasing
temper-ature down to TN, and then softens and narrows down
to base temperature. For the Fe0.95Te0.56Se0.44 sample with the highest Se concentration, we observed a con-tinuous hardening and narrowing of the mode the whole way down to 5 K. In Figs. 3 and 4, respectively, we report the full temperature dependence of the frequency of the
two c-axis polarized modes for the five samples with Fe
concentration close to 1. The temperature dependencies of the linewidths for the same samples are given in the lower panels of these figures.
While the temperature is decreased, a hardening of
A g e d s u r f a c e f o r s e v e r a l d a y s
A g e d s u r f a c e f o r 2 d a y s F r e s h l y c l e a v e d s u r f a c e
1 0 0 1 5 0 2 0 0 2 5 0 3 0 0
b
In
te
n
s
it
y
(
a
rb
.
u
n
it
s
)
F e 1 . 0 9T e F e 1 . 0 2T e
a
R a m a n S h i f t ( c m - 1)
P o w d e r e d T e O 2( R e f . 4 7 )
FIG. 5: (Color online) a) Room temperature Raman spectra of the parent Fe1.02Te and Fe1.09Te samples (vertically shifted
for clarity). b) Example of the aging effect on the parent single crystals. The spectrum of powdered TeO2 from ref.47
has been added for comparison.
152 154 156 158 160 162 164
Fe1.02Te
Fe1.09Te
wA 1 g (c m -1 ) 196 198 200 202 204 w B 1 g (c m -1 )
0 1 2 3 4
16 20 24 28 F W H M (A 1 g ) (c m -1 ) T/TN
0 1 2 3 4
12 16 20 24 28 FW
H M (B 1 g ) (c m -1 ) T/TN a b c d
FIG. 6: (Color online) a) and b) Temperature dependence of the frequency theA1g and B1g modes in these samples. c) and d) Temperature dependence of the linewidth theA1g and B1g modes in these samples.
both the A1g and B1g modes in all the systems is
ob-served, as expected from the lattice contraction. No no-ticeable differences between the samples are seen. As we go through the magnetic transition in the Fe1.02Te parent compound, a clear softening of the B1g mode
is observed (see also Fig. 6), while no changes across Tc occur in the samples containing Se. Within our
er-ror bars, the A1g mode frequency remains essentially
[image:5.612.361.514.54.288.2] [image:5.612.320.561.376.524.2]tempera-TABLE II: Fitting parameters for the temperature depen-dence of the B1g phonon linewidth in Fe0.99Te0.69Se0.31,
Fe0.98Te0.66Se0.34and Fe0.95Te0.56Se0.44samples.
Sample ω0 (cm−1) Γ0 (cm−1) Γ (cm−1)
Fe0.99Te0.69Se0.31 203.9 9.9 0.78
Fe0.98Te0.66Se0.34 203.8 9.8 0.78
Fe0.95Te0.56Se0.44 205.6 3.44 2.1
ture is observed for Fe0.99Te0.69Se0.31, Fe0.98Te0.66Se0.34 and Fe0.95Te0.56Se0.44samples, while its broad linewidth remains essentially temperature independent in the Fe1.02Te and Fe1.00Te0.78Se0.22 sample. In parallel to this, an unusual evolution on Se doping of the temper-ature dependence of the B1g mode linewidth can be see
in the lower panels of Fig. 4. Starting from the almost half-doped Fe0.95Te0.56Se0.44 compound, a conventional behavior is observed: as in most of the materials, this mode narrows with decreasing temperature (the phonon width is inversely proportional to its lifetime, which is expected to increase as the phonon-phonon interaction is reduced when decreasing the temperature45,46). De-creasing Se concentration toward the parent Fe1.02Te sample, a smooth evolution from this regular behavior is observed: in Fe0.99Te0.69Se0.31 and Fe0.98Te0.66Se0.34 samples only a weak narrowing of the phonon is ob-served between room and base temperature, while in Fe1.00Te0.78Se0.22 and Fe1.02Te the phonon essentially broadens as temperature is decreased. Below the mag-netic ordering transition in the Fe1.02Te sample, in addi-tion to the softening menaddi-tioned above, a narrowing of the B1g phonon is observed, in agreement with recent report
on Fe1.05Te.39
The temperature dependence of both frequency and FWHM of the B1g phonon of the Fe0.99Te0.69Se0.31, Fe0.98Te0.66Se0.34 and Fe0.95Te0.56Se0.44 samples can been well fitted assuming a symmetric anharmonic decay of this optical phonon,i.e. decay into two acoustic modes with identical frequencies and opposite momenta,45,46
ωph(T) =ω0−C
1 + 2 e
~ω0
2kB T −1
(1)
Γph(T) = Γ0+ Γ
1 + 2 e
~ω0
2kB T −1
(2)
where C and Γ are positive constants, ω0 is the bare phonon frequency, and Γ0 a residual (temperature-independent) linewidth originating from sample imper-fections or electron-phonon interactions. The fitting pa-rameters for these three samples are summarized in Ta-ble II. For the Fe1.02Te and Fe1.00Te0.78Se0.22 samples, as the FWHM increases with decreasing temperature, we can simply not use the latter expression to fit the exper-imental data.
B. Effect of the iron excess
1. Undoped compounds
Before discussing the possible origin of this unusual evolution of the temperature dependence of theB1gmode
FWHM, it is interesting to discuss its dependence with the concentration of Fe excess. We show in Fig. 5-a the raw Raman data obtained at room temperature on the two Se-free samples Fe1.02Te and Fe1.09Te where the ex-cess iron concentration has been measured to be 2%, and 9%. No strong differences can be found at first glance. The strong aging effect reported in ref.37 has also been observed in our Fe1+yTe samples, as seen in Fig. 5-b, as
well as on the Se-substituted samples (not shown here). The origin of this strong Raman signal is not clear. In ref.37, the authors attribute it to the formation of amor-phous Te as a decomposition product of Fe1+yTe1−xSex
[image:6.612.54.300.97.154.2]on the basis of earlier reports47,48. In particular, in Fig. 2-d from ref.47, the authors say that the room temper-ature spectra of amorphous Te is plotted, but in a note added in proof, they recognize that it rather originates from tetragonal TeO2(the Raman spectra of single crys-talline paratellurite TeO2reported in ref.48shows a much complex structure). We have added these data to our Fig. 5-a and found them not inconsistent with the mea-surements from our aged surface. The main differences are the relative intensities and widths of the two features of TeO2 at 120 and 145 cm−1 that may originate either from different texturing and strain of TeO2 and/or from the presence of Fe in the decomposition product.
The excess iron induces a small softening of the A1g
mode (Fig. 6-a) but does not affect its already broad linewidth (Fig. 6-c). No changes in the temperature de-pendence are seen. Similarly, the case of theB1g mode
appears to be more interesting. In the excess-Fe rich sample Fe1.09Te, a small softening through the magnetic transition can still be observed (Fig. 6-b), but the signa-ture of this transition in the FWHM is clearly suppressed (Fig. 6-d). We note finally that the unusual broadening of the mode with decreasing temperature in the parent compounds is observed irrespective to the measured ex-cess iron concentration (fig. 6-d), ruling out a disorder origin for this phenomena.
2. Se-substituted compounds
[image:6.612.103.298.530.611.2]1 9 2 1 9 6 2 0 0 2 0 4
1 9 2 1 9 6 2 0 0 2 0 4
c
ωB
1
g
(
c
m
-1)
F e0 . 9 5T e0 . 5 6S e0 . 4 4
F e1 . 0 5T e0 . 5 8S e0 . 4 2
a
b d
0 5 0 1 0 0 1 5 0 2 0 0 2 5 0 3 0 0
0
5
1 0 1 5
F
W
H
M
(
c
m
-1)
T e m p e r a t u r e ( K )
ω
B
1
g
(
c
m
-1
)
F e
0 . 9 9T e0 . 6 9S e0 . 3 1
F e
1 . 0 0T e0 . 7 8S e0 . 2 2
F e1 . 0 8T e0 . 7 3S e0 . 2 7
0 5 0 1 0 0 1 5 0 2 0 0 2 5 0 3 0 00
5
1 0 1 5
F
W
H
M
(
c
m
-1
)
T e m p e r a t u r e ( K )
FIG. 7: (Color online) a) and c) Effect of the Fe excess on
the temperature dependence of the B1g mode frequency in
Se-substituted samples. b) and d) Effect of the Fe excess on
the temperature dependence of the B1g mode linewidth in
Se-substituted samples.
has been measured. A sudden upturn in this behavior is observed for lower temperature, since at 5K the mode is softer and broader than at 60K. This can be better seen on Figs 7-a and b, where we compare the temperature de-pendence of frequencies and linewidth of the B1g mode
for these two samples. Clearly, as temperature decreases, the phonon hardens and narrows regularly, just as in ab-sence of excess iron, but at a temperature of about 35 K the mode starts to broaden (∼3 cm−1) and softens (∼
5 cm−1). In samples with lower Se contents a similar, although weaker, softening of the phonon is observed in the same temperature range, but with no change in the linewidth. None of these effects were observed on theA1g
phonon (not shown here).
C. Summary of the experimental results
To summarize our main experimental findings, we ob-serve the following:
i) For null or low Se concentration, an unusual broad-ening of theB1g phonon FWHM as temperature is
decreased. This progressively turns into a conven-tional anharmonic narrowing as Se is substituted to Te.
ii) Clear softening and narrowing of this B1g phonon
through the magnetic transition in the parent com-pound, suppressed in presence of Fe excess.
iii) Strong softening and broadening of theB1g mode
at low temperature in Se substituted samples.
IV. LDA DFT CALCULATIONS
In order to gain further insights on the effects of mag-netism and Fe concentration on the lattice dynamics in these systems, we have performed DFT calculations of the frequency of theA1g and B1g modes in both
[image:7.612.56.294.51.212.2]para-magnetic (non-spin-polarized, nsp hereafter) and double stripe ordered (spin-polarized, sp) phases. We start with the results obtained for stoichiometric FeTe system using the frozen phonon approach, summarized in Table III.49 Consistently with previous calculations,50,51 we find a value of the double-stripe magnetic moment at y = 0 (m =2.2µB), which is close to the experimental one.
TABLE III: A1gandB1g frequencies of FeTe, from non-spin-polarized (ωnsp) and spin-polarized (ωsp) DFT calculations.
mode ωnsp(cm−1) ωsp (cm−1) exp. at 10 K (cm−1)
Fe1.02Te sample
A1g 135 175 159.7
B1g 200.9 197.5 200.5
We then consider the effect of Fe excess and deficien-cies on theB1g mode. Non-stoichiometry was considered
within the VCA, which amounts to replacing Fe with a “virtual” atom with chargeZF e±y in the self-consistent DFT calculations. This means that the average poten-tial due to doping is treated self-consistently, but the ef-fects of randomness are disregarded. Since, within VCA, it is impossible to model the isovalent Se/Te substitu-tion, we do not address the issue of the dependence of the A1g mode on Se/Te concentration in this work. A
proper description would require large supercell calcula-tions, beyond the scope of the present paper. We used the FeTe experimental lattice parameters and Te height for all Fe concentrations.22 For each value of the Fe
ex-cess y, the frequencies were calculated for nsp and sp
configurations.49 The frequencies we obtained are given in Table IV, together with the self-consistent value of the magnetic moment at equilibrium.
The values of the calculated frequencies are extremely sensitive to the Fe excess content, which also affects strongly the magnetic moment. In the VCA, the
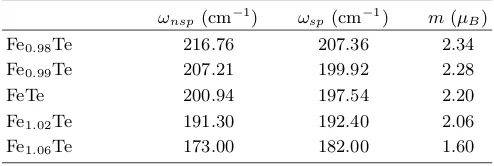
mag-TABLE IV: B1g frequencies of Fe1+yTe, from
non-spin-polarized (ωnsp) and spin-polarized (ωsp) DFT calculations. mis the value of the self-consistent double-stripe moment at zero displacement, inµB.
ωnsp (cm−1) ωsp(cm−1) m(µB)
Fe0.98Te 216.76 207.36 2.34
Fe0.99Te 207.21 199.92 2.28
FeTe 200.94 197.54 2.20
Fe1.02Te 191.30 192.40 2.06
[image:7.612.317.562.252.309.2] [image:7.612.316.563.637.720.2]netic moments and frequencies decrease monotonically with increasing Fe content, up to the highest doping we calculated (y= 0.06). We find an almost linear increase of theB1g frequency with doping, with a linear slope of
523 and 292 cm−1/y for nsp and sp calculations, respec-tively. As discussed in the next section, the experimen-tally observed effects of Fe non stoichiometry are much weaker.
V. DISCUSSION
A. Phonon Renormalization throughTN:
comparison with other families
In parent Fe1.02Te, we have observed a clear softening and a narrowing of the B1g phonon through the
mag-netic ordering transition atTN. Such narrowing has also
been reported in parent BaFe2As225,26 and CaFe2As232 through the spin-density wave (SDW) transition. In the latter case only, it is accompanied by a jump of the phonon frequency that can, at least partially, be ex-plained by the sudden collapse of the unit cell along the c-axis through the transition (such collapse does not take place in BaFe2As2).
On the contrary, in Fe1+yTe, thec-axis lattice
param-eter has been found to expand slightly through the cou-pled structural-magnetic transition.20 This certainly fa-vors the observed softening, although one would in this case expect an abrupt jump in the phonon frequency at TN (the structural transition is first-order) rather than
the observed smooth softening betweenTN and 10 K.
Regarding the agreement with the calculated phonon frequencies, it has been shown for the 122 and 1111 sys-tems that the experimental phonon frequencies are closer from those obtained with a magnetic calculation than from those where magnetism is not included, even in the paramagnetic state.24,33,34,52This is also the case here as we get a better match with our experimental data using the sp calculation rather than the nsp one (see Sect. IV).
Finally, as the phonon linewidth is inversely propor-tional to the lifetime of the excitation, its renormalization through TN reflects the changes in the coupling of the
phonons to some decay channels. In the 122 arsenides, as the SDW gap opens,53,54 a significant reduction of the electronic density of states at the Fermi level occurs, leading to a decrease of electron-phonon coupling that reasonably accounts for the observed sharpening of the phonons.25 Such an SDW gap opening has not yet been reported in the 11 compounds,55,56but has recently been observed in ARPES experiments57 and is very likely re-sponsible for the B1g mode narrowing in the Fe1.02Te sample.
B. Se-substituted systems
1. Absence of superconductivity induced anomalies
As mentioned in the Introduction, the B1g Fe mode
that shows here the most striking doping dependence is active in all the families of Fe-based superconductors. The absence of renormalization of this phonon as well as of the A1g one through the superconducting
tran-sition in the doped compounds is consistent with ex-periments carried out on the doped 122 arsenide com-pounds25(with the notable exception being the electron-doped PrxCa1−xFe2As2,36 where a small hardening of theB1gphonon throughTc has been observed) or on the
111 compound LiFeAs35, where no signature of the super-conducting transition is seen either in the frequency or in the linewidth of these two modes. This is due to the fact that the superconducting gap amplitude is smaller than the phonon frequencies, hence his opening let them un-affected. The situation is similar for the 11 compounds, as the phonon frequency is much larger than the ener-gies reported for the superconducting gap(s) in various experiments [2∆∼ 2 meV (17 cm−1)58, 3.4 meV (27.4 cm−1)59or 4.6 meV (37 cm−1)60from STM, 2∆∼3 meV (24 cm−1) from NMR,61and 2∆∼6 meV (48 cm−1)from specific heat42].
2. Se-substitution induced evolution of theB1g mode
FWHM temperature dependence
We now turn to the influence of Se concentration on the behavior of the B1g phonon. As it is substituted
into the system, we observe a weak increase of the B1g
phonon frequency at the lowest temperatures (see Figs. 4 b to e), that goes along with the reduction of thec-axis parameter reported from x-ray and neutron diffraction experiments.7,10,20 The room temperature linewidth for this mode is only weakly dependent on the Se concen-tration, although the FWHM clearly tends to sharpen with increasing Se content. This fact is already surprising as one may have rather expected the Se-substitution in-duced disorder to favor a broadening of the phonon line-shape instead of a narrowing. The normal state tempera-ture dependence of the mode FWHM for different doping levels is even more puzzling. As noted in Sec. III A, the situation appears conventional in the Fe0.95Te0.56Se0.44 samples close to half doping, with a continuous narrow-ing of the phonon with decreasnarrow-ing temperature. On the contrary, as Se contents are reduced the phonon broadens with decreasing temperature. This is particulary clear for the two Se-free samples (Fe1.02Te and Fe1.09Te), as seen in Fig. 6-d.
cm−1) in Fe0.95Te0.56Se0.44 is comparable with the one of the temperature dependent parameter Γ (2.1 cm−1), whereas in Fe0.98Te0.66Se0.34 and Fe0.99Te0.69Se0.31 we have Γ0∼10 cm−1Γ.
The situation is thus much closer to the one reported for PrxCa1−xFe2As236 than for LiFeAs, where the resid-ual linewidth was always vanishingly small.35This shows that in Fe1+yTe1−xSex systems, the contribution of
an-harmonicity to theB1g phonon lifetime is not the
dom-inant one. An additional decay channel for this phonon must therefore take over the usual anharmonic effects, and its contribution increases strongly as Se content is decreased. Such behavior can have at least two possi-ble origins: electron-phonon coupling and spin-phonon coupling. In the first scenario, the increasing relative weight Γ0 with decreasing Se content can be trivially re-lated to the increase of the electronic density of states at the Fermi level N(EF)50 [as Γ0 ∝N(EF))]. This may,
however, not be sufficient to account for the reported effect: Electron-phonon coupling is, in principle, tem-perature independent and can, therefore, hardly explain the increasing linewidth of theB1gphonon with
decreas-ing temperature in the systems with the lowest Se con-tents (Fe1.02Te, Fe1.00Te0.78Se0.22). Having in mind the increasing weight of magnetic excitations as Se concen-tration decreases toward the parent compound,18 we are naturally led to suggest that spin-phonon coupling may be the additional decay channel for the phonons. The effects of excess Fe discussed in the next section indeed confirm an interplay between the lattice and spin degrees of freedom in these systems.
C. Influence of the iron concentration
1. Comparison of experimental data with LDA DFT
calculation
According to our calculation in Sec. IV, increasing the Fe concentration induces a softening of theB1gmode
fre-quencies in both sp and nsp calculations. The softening rates are found to be 523 and 292 cm−1/yfor nsp and sp, respectively. Experimentally, at low temperature, a small hardening is instead observed in the parent compounds, when going from Fe1.02Te to Fe1.09Te. In Se-substituted samples on the other hand, a∼7 cm−1softening between Fe0.95Te0.56Se0.44and Fe1.05Te0.58Se0.42 B1g phonon
fre-quencies is indeed observed (∼70 cm−1/y). An effect of comparable size is found when comparing the B1g peak
frequencies of Fe0.95Te0.56Se0.44(ωB1g = 205.6cm −1) and
Fe0.98Te0.66Se0.34(ωB1g = 203.8cm
−1), with significantly
different Fe deficiencies (even though the Se concentra-tions in this case slightly differ). This gives a softening rate of∼66 cm−1/y.
In any case, the experimentally observed effects of Fe nonstoichiometry are much weaker than those theo-retically calculated, even considering the sp calculation where they are the smallest. One has to keep in mind
that accurate comparison to the calculation is tough as the presence of excess (y > 0) Fe complicates the situa-tion. In fact, in the VCA there is no qualitative difference between Fe excess and deficiency, as the excess (deficient) charge are both located around the Fe site. Experimen-tally, however, it is known that the excess Fe ions are located in the Te planes, and this has qualitatively dif-ferent effects, the most important being that the effective Fe magnetic moment is enhanced and not reduced, due to the formation of local moments on the excess Fe in the Te planes. This cannot be taken into account by the VCA approach of treating the doping in our LDA calcu-lations. Furthermore, it is important to point out that mean-field LDA DFT calculations cannot reproduce the renormalization of the B1g frequency and linewidth
ob-served at low temperature in the Fe-rich systems, which are discussed in the next paragraph.
2. Excess Fe-induced magnetic fluctuation
We have seen in Sec. III B 1 that in the Fe1.09Te crys-tal, we are not able to observe clearly the effect of the magnetic transition on the phonons. A small softening has been seen (see Fig. 6-d), but no narrowing of the line shape. In the Se-substituted system, as shown in Fig. 7, excess iron, in addition to a decrease inTc, induces large
effects on both frequency and lineshape of the phonons. The strongest effect occurs close to 50% Se content, with a large softening and broadening of theB1g phonon
be-lowT ∼35 K, well aboveTc. To our knowledge, no phase
transition has been reported in this temperature range for this doping level, but the occurrence of short-range magnetic fluctuations has been reported.16 In the un-doped case with low excess iron concentration, it has been shown that a low energy gap in the spin-wave excitation spectrum opens when entering the magnetic state.40 In-creasing the excess iron concentration, this gap is filled up with low-energy spin fluctuations.40
In both doped and undoped cases, one effect of excess iron is, therefore, to induce low energy magnetic fluctua-tions in a temperature range at which we also observe a relative broadening of theB1gphonon,i. e., a decrease of
its lifetime. This reinforces the point we made at the end of Sec. V B 2, indicating that the additional damping for theB1g mode may actually originate from its coupling
to magnetic excitations.
VI. CONCLUSIONS
We have carried out a systematic study of the lattice dynamics in the Fe1+yTe1−xSex system, focusing more
particularly on thec-axis polarized FeB1gmode. In
substi-tuted to Te, the temperature dependence of this modes smoothly evolves toward a more regular situation, with theB1gphonon showing conventional anharmonic decay.
A good agreement between the observed phonon frequen-cies and a first-principles calculation including the effects of magnetic ordering is found. The temperature depen-dence of the phonon linewidth, as well as the effects in-duced by the Fe nonstoichiometry in these compounds, revealed a peculiar coupling of this mode to magnetic fluctuations in the Fe1+yTe1−xSex system and can, to
date, not be satisfactorily reproduced within state-of-the-art computational approaches.
VII. ACKNOWLEDGEMENT
We thank A. Schulz for technical support and A.C. Walters for useful suggestions. This work has been supported by the European project SOPRANO (Grant No. PITN-GA-2008-214040), by the French National Research Agency, (Grant No. ANR-09-Blanc-0211 SupraTetrafer), and by the UK Engineering and Phys-ical Sciences Research Council (MJR, EP/C511794).
1
Y.Kamihara, T.Watanabe, M.Hirano, H.Hosono, J. Am.
Chem. Soc.130, 3296 (2008).
2 H. Takahashi, K. Igawa, K. Arii, Y. Kamihara, M. Hirano,
and H. Hosono, Nature (London)453, 376 (2008).
3
Z.-A. Ren, W. Lu, J. Yang, W. Yi, X.-L. Shen, C. Zheng, G.-C. Che, X.-L. Dong, L.-L. Sun, F. Zhou, and Z.-X. Zhao, Chinese Physics Letters25, 2215 (2008).
4
M. Rotter, M. Tegel, and D. Johrendt, Phys. Rev. Lett.
101, 107006 (2008).
5 J. H. Tapp, Z. Tang, B. Lv, K. Sasmal, B. Lorenz, P. C.W.
Chu, and A. M. Guloy, Phys. Rev. B78, 060505 (2008).
6
F. C. Hsu, J. Y. Luo, K. W. Yeh, T. K. Chen, T. W. Huang, P. M. Wu, Y. C. Lee, Y. L. Huang, Y. Y. Chu, D.
C. Yan, and M. K. Wu, Proc. Natl. Acad. Sci. USA,105,
14262 (2008).
7 K. W. Yeh, T. W. Huang, Y. L. Huang, T. K. Chen, F. C.
Hsu, P. M. Wu, Y. C. Lee, Y. Y. Chu, C. L. Chen, J. Y.
Luo, D. C. Yan, and M. K. Wu, Europhys. Lett.84, 37002
(2008).
8
M. H. Fang, H. M. Pham, B. Qian, T. J. Liu, E. K.
Vehst-edt, Y. Liu, L. Spinu, and Z. Q. Mao, Phys. Rev. B78,
224503 (2008).
9 D. Fruchart, P. Convert, P. Wolfers, R. Madar, J. P.
Sen-ateur, and R. Fruchart, Mater. Res. Bull.10, 169 (1975).
10 S. Li, C. de la Cruz, Q. Huang, Y. Chen, J. W. Lynn, J.
Hu, Y. L. Huang, F. C. Hsu, K. W. Yeh, M. K. Wu, and P. C. Dai, Phys. Rev. B79, 054503 (2009).
11
F. Ma, W. Ji, J. Hu, Z. Y. Lu, and T. Xiang, Phys. Rev. Lett.102, 177003 (2009).
12
M. J. Han and S. Y. Savrasov, Phys. Rev. Lett. 103,
067001 (2009).
13 W. Bao, Y. Qiu, Q. Huang, M.A. Green, P. Zajdel, M.R.
Fitzsimmons, M. Zhernenkov, S. Chang, M. Fang, B. Qian, E.K. Vehstedt, J. Yang, H.M. Pham, L. Spinu, Z.Q. Mao, Phys. Rev. Lett.102, 247001 (2009).
14
C. de la Cruz, Q. Huang, J. W. Lynn, J. Li, W. R. Ii, J. L. Zarestky, H. A. Mook, G. F. Chen, J. L. Luo, N. L. Wang, and P. Dai, Nature,453, 899 (2008).
15 D.J. Singh, and M.H. Du, Phys. Rev. Lett.100, 237003
(2008).
16
R. Khasanov, M. Bendele, A. Amato, P. Babkevich, A. T. Boothroyd, A. Cervellino, K. Conder, S.N. Gvasaliya, H. Keller, H.-H. Klauss, H. Luetkens, V. Pomjakushin, E.
Pomjakushina, and B. Roessli, Phys. Rev. B80, 140511(R)
(2009).
17
L. Zhang, D. J. Singh, and M. H. Du, Phys. Rev. B79,
012506 (2009).
18
J. Wen, G. Xu, Z. Xu, Z. W. Lin, Q. Li, W. Ratcliff, G.
Gu, and J. M. Tranquada, Phys. Rev. B80, 104506 (2009).
19
T. J. Liu, X. Ke, B. Qian, J. Hu, D. Fobes, E. K. Vehstedt, H. Pham, J. H. Yang, M. H. Fang, L. Spinu, P. Schiffer,
Y. Liu, and Z. Q. Mao, Phys. Rev. B80, 174509 (2009).
20
A. Martinelli, A. Palenzona, M. Tropeano, C. Ferdeghini, M. Putti, M. R. Cimberle, T. D. Nguyen, M. Affronte, and C. Ritter, Phys. Rev. B81, 094115 (2010).
21 Z. Xu, J. Wen, G. Xu, S. Chi, W. Ku, G. Gu, and J. M.
Tranquada, Phys. Rev. B84, 052506 (2011).
22
M. Bendele, P. Babkevich, S. Katrych, S. N. Gvasaliya, E. Pomjakushina, K. Conder, B. Roessli, A. T. Boothroyd, R.
Khasanov, and H. Keller, Phys. Rev. B82, 212504 (2010).
23
A. P. Litvinchuk, V. G. Hadjiev, M. N. Iliev, B. Lv, A.
M. Guloy, and C. W. Chu, Phys. Rev. B 78, 060503(R)
(2008).
24
D. Reznik, K. Lokshin, D. C. Mitchell, D. Parshall, W. Dmowski, D. Lamago, R. Heid, K. P. Bohnen, A. S. Sefat, M. A. McGuire, B. C. Sales, D. G. Mandrus, A. Subedi, D. J. Singh, A. Alatas, M. H. Upton, A. H. Said, A.
Cun-solo, Y. Shvydko, and T. Egami, Phys. Rev. B80, 214534
(2009).
25
M. Rahlenbeck, G. L. Sun, D. L. Sun, C. T. Lin, B. Keimer, and C. Ulrich, Phys. Rev. B80, 064509 (2009).
26 L. Chauvi`ere, Y. Gallais, M. Cazayous, A. Sacuto, M. A.
Measson, D. Colson, and A. Forget, Phys. Rev. B 80,
094504 (2009).
27 Y. Gallais, A. Sacuto, M. Cazayous, P. Cheng, L. Fang,
and H. H. Wen, Phys. Rev. B78, 132509 (2008).
28
K. Y. Choi, D. Wulferding, P. Lemmens, N. Ni, S. L.
Budko, and P. C. Canfield, Phys. Rev. B 78, 212503
(2008).
29
M. Le Tacon, M. Krisch, A. Bosak, J. W. G. Bos, and S.
Margadonna, Phys. Rev. B78, 140505 (2008).
30
T. Fukuda, A. Q. R. Baron, S.-i. Shamoto, M. Ishikado, H. Nakamura, M. Machida, H. Uchiyama, S. Tsutsui, A. Iyo, H. Kito, J. Mizuki, M. Arai, H. Eisaki, and H. Hosono, Journ. Phys. Soc. Jap.,77, 103715 (2008).
31
M. Le Tacon, T. R. Forrest, Ch. R¨uegg, A. Bosak, A. C.
Walters, R. Mittal, H. M. Rønnow, N. D. Zhigadlo, S. Katrych, J. Karpinski, J. P. Hill, M. Krisch, and D. F.
McMorrow, Phys. Rev. B80, 220504(R) (2009).
32
K.-Y. Choi, P. Lemmens, I. Eremin, G. Zwicknagl, H. Berger, G. L. Sun, D. L. Sun, and C. T. Lin, J. Phys.:
33
S. E. Hahn, Y. Lee, N. Ni, P. C. Canfield, A. I. Goldman, R. J. McQueeney, B. N. Harmon, A. Alatas, B. M. Leu, E. E. Alp, D. Y. Chung, I. S. Todorov, and M. G. Kanatzidis, Phys. Rev. B79, 220511 (2009).
34 T. Fukuda, A. Q. R. Baron, H. Nakamura, S. Shamoto, M.
Ishikado, M. Machida, H. Uchiyama, A. Iyo, H. Kito, J.
Mizuki, M. Arai, and H. Eisaki, Phys. Rev. B84, 064504
(2011).
35 Y. J. Um, J. T. Park, B. H. Min, Y. J. Song, Y. S. Kwon,
B. Keimer, and M. Le Tacon, Phys. Rev. B 85, 012501
(2012).
36 A. P. Litvinchuk, B. Lv, and C. W. Chu, Phys. Rev. B84,
092504 (2011).
37
T.-L. Xia, D. Hou, S. C. Zhao, A. M. Zhang, G. F. Chen, J. L. Luo, N. L. Wang, J. H. Wei, Z.-Y. Lu, and Q. M.
Zhang, Phys. Rev. B79, 140510(R) (2009).
38
K. Okazaki, S. Sugai, S. Niitaka, and H. Takagi, Phys. Rev. B83, 035103 (2011).
39 V. Gnezdilov, Y. Pashkevich, P. Lemmens, A. Gusev, K.
Lamonova, T. Shevtsova, I. Vitebskiy, O. Afanasiev, S. Gnatchenko, V. Tsurkan, J. Deisenhofer, and A. Loidl, Phys. Rev. B83, 245127 (2011).
40
C. Stock, E. E. Rodriguez, M. A. Green, P. Zavalij, and J.
A. Rodriguez-Rivera, Phys. Rev. B84, 045124 (2011).
41 Y. Liu and C.T. Lin, Journal of Superconductivity and
Novel Magnetism84, 183 (2011).
42
T. Klein, D. Braithwaite, A. Demuer, W. Knafo, G. Laper-tot, C. Marcenat, P. Rodi`ere, I. Sheikin, P. Strobel, A.
Sulpice, and P. Toulemonde, Phys. Rev. B 82, 184506
(2010).
43 A. Tamai, A. Y. Ganin, E. Rozbicki, J. Bacsa, W.
Meevasana, P. D. C. King, M. Caffio, R. Schaub, S. Mar-gadonna, K. Prassides, M. J. Rosseinsky, and F. Baum-berger, Phys. Rev. Lett. 104, 097002 (2010).
44 N. C. Gresty, Y. Takabayashi, A. Y. Ganin, M. T.
McDon-ald, J. B. Claridge, D. Giap, Y. Mizuguchi, Y. Takano, T. Kagayama, Y. Ohishi, M. Takata, M. J. Rosseinsky, S. Margadonna, and K. Prassides, Journal of the American Chemical Society,131, 16944 (2009).
45
P. G. Klemens, Phys. Rev.148, 845 (1966).
46
J. Men´endez, and M. Cardona, Phys. Rev. B 29, 2051
(1984).
47 A. S. Pine, and G. Dresselhaus, Phys. Rev. B4, 356 (1971). 48
A. S. Pine, and G. Dresselhaus, Phys. Rev. B 5, 4087
(1972).
49 We used the LDA approximation for the exchange
corre-lation functional, and the linearly-augmented plane wave (LAPW) basis set with local orbitals. Thek-point integra-tion was performed on a 4 8 4 grid for the doubled unit cell. The experimental lattice parameters area=3.826˚Aand c=6.273˚A, withzT e=0.28141.
50 A. Subedi, L. Zhang, D. J. Singh, and M. H. Du, Phys.
Rev. B78, 134514 (2008).
51
Lijun Zhang, D. J. Singh, and M. H. Du, Phys. Rev. B79,
012506 (2009).
52
L. Boeri, M. Calandra, I. I. Mazin, O. V. Dolgov, and F. Mauri, Phys. Rev. B82, 020506 (2010).
53 A. Akrap, J. J. Tu, L. J. Li, G. H. Cao, Z. A. Xu, and C.
C. Homes, Phys. Rev. B80, 180502 (2009).
54
A. V. Boris, N. N. Kovaleva, S. S. A. Seo, J. S. Kim, P. Popovich, Y. Matiks, R. K. Kremer, and B. Keimer, Phys. Rev. Lett.102, 027001 (2009).
55
G. F. Chen, Z. G. Chen, J. Dong, W. Z. Hu, G. Li, X. D. Zhang, P. Zheng, J. L. Luo, and N. L. Wang, Phys. Rev. B79, 140509 (2009).
56
Y. Xia, D. Qian, L. Wray, D. Hsieh, G. F. Chen, J. L.
Luo, N. L. Wang, and M. Z. Hasan, Phys. Rev. Lett.103,
037002 (2009).
57
M. M˚ansson, private communication.
58
Y. Noat, T. Cren, V. Dubost, S. Lange, F. Debontridder, P. Toulemonde, J. Marcus, A. Sulpice, W. Sacks, and D.
Roditchev, J. Phys. Condens. Mat.22, (2010).
59
T. Hanaguri, S. Niitaka, K. Kuroki, and H. Takagi, Science
328, 474 (2010).
60 T. Kato, Y. Mizuguchi, H. Nakamura, T. Machida, H.
Sakata, and Y. Takano, Phys. Rev. B80, 180507 (2009).
61