Defining new dental phenotypes using 3D image analysis to enhance discrimination and insights into biological processes
Richard Smith1, Halla Zaitoun1, Tom Coxon1, Mayada Karmo1, Gurpreet Kaur1, Grant Townsend1,2 and Alan Brook1
1
University of Liverpool, Dept of Clinical Dental Sciences, Edwards Building, Pembroke Place, Liverpool, UK, L69 3GN
2
School of Dentistry, University of Adelaide, South Australia 5005 Corresponding author: Richard Smith
University of Liverpool
Dept of Clinical Dental Sciences Edwards Building
Pembroke Place Liverpool UK L69 3GN
TEL. 0151 7065118 fax. 0151 7065809
Abstract
recorded using our 2-D system and the same projected variables were also recorded using a newly-developed 3-D system for comparison. Values of Pearson’s correlation coefficient between measurements obtained using the two techniques were significant at the 0.01 probability level for all but one variable, confirming their comparability. For both 2-D and 3-D systems, except for one variable, intra- and inter-operator reliability was substantial or excellent. Conclusions: We have developed a new 3-D laser scanning system that enables additional dental phenotypes to be defined. It has been validated against an established 2-D system and shown to provide measurements with excellent reliability, both within and between operators. This new approach provides exciting possibilities for exploring how genetic and environmental factors lead to normal and abnormal variations in dental morphology and development.
Introduction
Traditional odontometric methods have led to important discoveries in many disciplines, including anthropology, archaeology and clinical dentistry (1). Indeed, the central role of hand-held calipers in odontometry is emphasised by their prominent position on the covers of Kieser’s text (2) and the journal, Dental Anthropology. Moreover, statistical analysis of dental measurements has provided a key to clarifying how genetic and
environmental factors contribute to normal variation in dental morphology and development, as well as to the aetiology of various anomalies, such as congenitally missing and extra teeth. Hand-held calipers have the advantage of being relatively simple to use and easily transportable, and studies have confirmed that manual measurements made from dental casts are reasonably accurate and reproducible (3, 4). However, care is needed to avoid damaging dental casts, especially the interproximal regions of teeth, with the sharpened beaks of
calipers. Furthermore, only a limited number of linear measurements can be derived and they are time-consuming to record.
Although many researchers have recognised the limitations of using maximum mesio-distal and bucco-lingual measurements to quantify tooth size, and some alternative
measurements have been proposed, such as measurements at the cervix and along the
diagonal axis of the tooth (5), the traditional variables are still widely used, partly because of the large amount of published reference data available that facilitates comparative analyses. From the 1960s and 70s, researchers began to advocate the use of a broader range of
more studies have been carried out based on distances or areas of intra-coronal components computed from scanned images (9).
We have developed a two dimensional (2-D) image analysis system over the years to enhance the quantity and quality of information derived in our studies of human and animal dentitions, both in clinical situations and in the research laboratory (10, 11, 12). In addition to providing results of comparable accuracy and reliability to those obtained from manual methods, the 2-D image analysis system has enabled additional parameters to be measured, including areas, perimeters and subdivisions of any view of a tooth (13, 14, 15).
Three-dimensional systems (3-D) were being developed as early as the 1960s to study dental morphology but they were very expensive and the lack of computer power available at that time limited the extent of data acquisition and analysis possible. Early approaches included the use of stereophotogrammetry (16), development of the Optocom (17) and the Reflex Metrograph (18, 19, 20). These methods were limited by relatively poor measurement accuracy due to subjectivity of locating landmarks and by the length of time needed to collect the data. More recently, Moire photography has been applied to a limited extent to enable cusp heights and volumes to be measured and the extent of post-eruptive tooth wear to be quantified (21, 22, 23). Serial micro- computed tomography (micro-CT) imaging is also being used to generate 3D reconstructions of teeth (24), as is confocal microscopy (25).
The introduction of laser scanning and computer-aided tomography has opened up a new sphere of activity in dental imaging and measurement. This technology has the
Only a few investigators have considered the accuracy and reliability of 3-D laser image analysis in dentistry (26, 27, 28, 29) with comparisons only being made between manual measurements and those obtained by 3-D analysis. Lu et al. (28) introduced a laser scanning 3D digitization system for dental casts using a semiconductor laser and found no statistical difference between 3-D and manual measurements. They reported a measurement error of less than 0.1 mm. However, the methodology used was not described clearly and it is difficult to draw firm conclusions from their findings. Hirogaki et al. (29) scanned dental castsusing a line laser scanner and compared measurements on computer-reconstructed models with those on the actual casts. Images were acquired of entire dental casts from four different directions and these were combined to reconstruct each cast. The differences
between measurements of landmarks obtained on the actual casts and those obtained from the 3-D reconstructions were found to be within 0.3 mm, although no description was provided of the statistical analyses undertaken.
Most previous studies of the accuracy and reliability of 3-D systems for dental application tend to be flawed by lack of a clear description of the procedure for image analysis. Furthermore, the statistical techniques used to compare 2-D and 3-D measurements have been based on Student’s t-tests alone with no quantitative assessment of reliability or bias.
Our group has now developed a new 3-D approach designed to produce accurate and reliable measurements from dental models, while also enabling an increased range of
phenotypes to be defined. The purpose of the present study was to validate this 3-D
Materials and Methods
Orthodontic study models of the maxillary dental arches of 20 young adults were duplicated and sectioned to allow the upper right lateral incisor and upper left central incisor to be detached from each model.
2-D imaging
The two sample teeth from each model were imaged using a 2-D Image Analysis System as described by Brook et al. (11).
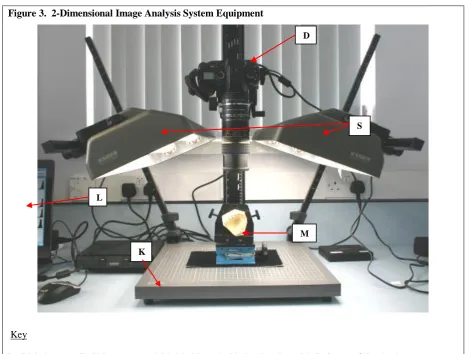
This consisted of a 32-bit digital camera (Kodak DCS Pro SLR/C with 90mm Tamron lens) connected to a laptop PC (Pentium® 4 CPU, 3.40GHz, Dell OPTIPLEX 620). The camera was mounted horizontally on an adjustable arm of a Kaiser copy stand (Odenwald, Germany), which it turn had a small custom built model stand resting on its base (Fig. 1.). The individual teeth were slotted into an adjustable holder of the model stand and a small section of steel rule was used as a scale. This was attached adjacent to the tooth of interest with modeling wax, in the same plane of focus (Fig. 2.). The illumination was standardised using two daylight bulbs from Osram dulux daylight bulbs at known and fixed distances and angulation from the sectioned tooth.
resolution of 13.5 mega pixels and the images were displayed in an array of 4500 x 3000 pixels.
The following measurements were recorded in millimeters: Measurements from the labial view:
1. The mesio-distal dimension (MD) was taken as the maximum distance between the mesial and distal proximal surfaces of the tooth crown.
2. The incisal-gingival (IG) dimension was the distance between incisal surface and the gingival level of the crown, perpendicular to the MD at its midpoint.
Measurements from the occlusal view:
1. The labio-lingual dimension (LL) was taken to be the greatest distance between the labial and lingual surfaces of the crown, perpendicular to and bisecting the line defining the MD dimension.
One week later, repeat images were obtained and measurements recorded in order to assess the intra-operator repeatability. This process was mirrored by a second operator so that inter-operator reproducibility could also be assessed and Bland Altman plots derived.
3-D imaging
Using the 3-D system, two types of linear measurements were obtained (Figs. 4a and b). The distance between two points in a straight line (projected) was measured as well as the same dimension following the contour of the tooth (actual). Actual measurements were undertaken by placing multiple markers over the line drawn for the initial projected measurement. The same projected variables were recorded using the 3-D system as those with the 2D system to enable direct comparisons to be made. In addition, the actual (a) dimensions were recorded for MD, LL, IG and surface area.
Analysis of the images was undertaken using custom-made “Cloud” software (Robin Richards, University College, London). Repeat images were obtained one week later to determine intra-operator repeatability. In addition, a second operator repeated the same process to enable determination of the inter-operator reproducibility and assessment of any bias using Bland Altman plots.
To assess 3-D validity, measurements were compared between 2-D and 3-D projected parameters. Surface area and actual linear measurements were used for the calculation of reliabiltiy of variables not available with 2-D image analysis.
Fleiss’ inter/intra-class correlation coefficient (ICCC) was used to calculate reliability as this method accounts for biological variation providing a statistical weight for the normal between case variation expected (30). Fleiss’ results can be classified using the method of Donner and Eliasziw (31), with values above 0.6 representing substantial reliability and above 0.8 excellent reliability.
(RC) was calculated for intra-examiner comparisons and limits of agreement for inter-examiner comparisons.
Another estimate of bias was calculated for each comparison by investigating whether the mean difference was less than 1.96 times the standard error of the difference. A mean difference less than this threshold can be interpreted to indicate that there is no significant bias.
For comparisons of data generated using the 2D and 3D methods, Pearson’s correlation coefficient, r, was calculated (32, 33). This method gave an indication of the degree of association of the two sets of data and whether the values were significantly different from zero at the p<0.05 level.
Results
2-D image analysis
Values of ICCC, reflecting intra-operator reliability for both operators for all the measured tooth dimensions, ranged between 0.937 and 1.00. Therefore, they fell within the excellent category of Donner and Eliasziw (31). The results relating to Operator 1 are shown in Table 1. The inter-operator reliability was also excellent for all but UR2 MD which still fell into the substantial category (Table 1).
3-D image analysis
2-D versus 3-D image analysis
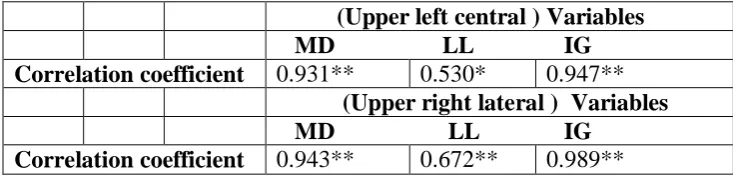
Values of Pearson’s correlation coefficient were significant at the 0.01 probability level for all but one variable, confirming that the two techniques were comparable (Table 3).
Discussion
Major advances have been made over the past decade or so in our understanding of the molecular mechanisms involved in odontogenesis and patterning within the dentition. For example, it is now clearly established that the enamel knots of developing tooth germs act as signalling centres that mark the positions of future cusp tips (34, 35). Indeed, the various stages of odontogenesis, including initiation, morphogenesis and differentiation, all appear to result from a series of epithelial-mesenchymal interactions between oral epithelial and ecto-mesenchymal tissues that are facilitated by the exchange of various signalling molecules (36). The same genes are expressed and the same signalling molecules released in a reiterative fashion to produce each of the cusps of a molar tooth (34). In fact, these genes seem to be highly conserved in an evolutionary sense and once the process of odontogenesis has been initiated, it tends to proceed as a continuous self-organizing process.
variation within and between species. In particular, inclusion of the third dimension will enable variability in crown and cusp heights to be explored. Although Keene (39) recognized the value of integrating information about dental crown height into an explanatory model for tooth morphogenesis, up until now limitations in measurement technology have prevented most researchers from pressing forward with this concept.
We have suggested that variation in dental crown form between species probably results from regulation of a relatively small number of highly conserved genes that control tooth formation in vertebrates (40). Support for this view is provided by Kangas et al.(41) showing that dental characters seem to be non-independent and that increasing the levels of expression of just one gene can lead to increases in cusp number, altered cusp shape and position, development of longitudinal crests on teeth, and increases in tooth number in experimental mice. In contrast, dental variation within a species, for example in the molar series, might be generated solely by minor alterations in the timing of interactions between cells during odontogenesis, as well as the positions of cells relative to each other. Given that the 3D measuring systems provide sufficient accuracy and reliability, there will be exciting opportunities to pursue these ideas further and to tease out how genetic and environmental factors interact to produce the phenotypic complexity displayed within the human dentition.
Validation between 2-D and 3-D (projected)
This study has confirmed a high correlation between 2-D and 3-D measurements obtained using our specially-designed equipment. Furthermore, the maximum and minimum differences between 2-D and 3-D measurements were found to be 0.6mm and 0.0mm
recorded the labio- lingual dimension from the incisal view rather than from the mesial or distal aspect. Furthermore, most odontometric analyses have been undertaken on intact models that result in the mesial and distal aspects of teeth being obscured by adjacent teeth. Although the teeth were separated from the model in this study, the labio-lingual dimension was still measured from the incisal aspect to conform with previous studies. This led to a larger overall measurement error than would have been expected if measured from the proximal aspect where 3-D orientation is easier.
In this study, 2-D images from our established system were measured and compared with the same variables (projected) obtained using our new 3-D image analysis approach. The high degree of correlation between the two methods, together with the substantial or excellent reliability found, comfirm that this system provides an accurate tool for measuring exisiting and new dental phenotypes. Those measurements that could only be measured using the 3-D system were also found to display excellent or substantial reliability.
2-D Measurements
Two main sources of error were noted with the 2-D image analysis system. The first related to the accuracy of the digital image acquired, including the calibration scale and the orientation of the image. Secondly, there was a degree of subjectivity in the identification of landmarks, such as contact points and cervical margins, and in determining the maximum convexity of the tooth when recording labio-lingual dimensions. Therefore, it is re-assuring that, even with such potential sources of error, all of the linear measurements were highly reproducible.
was excellent in all but one category, UR2 MD which fell into the substantial category. Overall, the results were better than those of Brook et al (12) who also identified MD as the parameter with the lowest inter-operator reliability.
Even when measurements correlate highly, it is still possible to have bias between operators or methods. Bland Altman plots were produced to assess bias and disclose any large errors for any of the variables. With only a few exceptions, there was no significant bias for either intra or inter-operator measurements, confirming the validity of the analysis.
However, upper left central incisor measurements were more reliable than the upper right lateral measurements for both operators. This can be attributed to the fact that upper central incisors are larger and more symmetrical in morphology than upper lateral incisors, hence it is easier to identify important landmarks such as contact points. 3-D Measurements.
Using the 3-D system, two types of linear measurements could be generated. These were projected (straight line between two points) or actual (the same dimension following the contour of the tooth) measurements . Both types of measurements generally showed excellent reliability within and between operators. The inciso-gingival dimension, followed by the mesio-distal, were measured most reliably whether based on projected or actual
3-D Surface Area
The surface area dimension was the most reliable of all actual measurements. This may be a direct result of the surface area being a much larger measurement and therefore the error is relatively less. Measurements for both operators fell within the excellent category for both the intra- and inter-operator reliability.
3-D projected versus actual measurements
The differences found between 2-D (or 3-D projected) measurements and actual 3-D measurements provide clear evidence of the differences that 3-D variables can provide in comparison to 2-D. Variables may appear relatively straight when in fact measurement in 3-D illustrates surprising additional comparative information.
Conclusions
This study has confirmed that a newly-developed 3-D image analysis system is as reliable as an established 2-D system for measuring teeth using dental models. The 3-D system enables new dental phenotypes to be defined, increasing anatomical discrimination and providing the opportunity to explore aspects of dental development and morphology that have hitherto remained neglected. When coupled with the application of software for
imaging and morphometric analyses, including Procrustes methods, this technology will provide a sophisticated system for accurately representing the size and shape of teeth and then making comparisons within and between species.
References
1. Hillson S. Dental Anthropology. Cambridge: Cambridge University Press, 2002.
2. Kieser JA. Human Adult Odontometrics. Cambridge: Cambridge University Press, 1990. 3. Moorrees CFA, Thomsen SO, Jensen E, Yen PK. Mesiodistal crown diameters of the deciduous and permanent teeth in individuals. J Dent Res 1957; 36:39-47.
4. Hunter WS, Priest WR. Errors and discrepancies in measurement of tooth size. J Dent Res
1960; 39(2):405-414.
5. Hillson S, FitzGerald C, Flinn H. Alternative dental measurements: proposals and relationships with other measurements. Am J Phys Anthropol 2005; 126(4):413-426. 6. Biggerstaff RH. Electronic methods for the analysis of the human post-canine dentition.
Am J Phys Anthropol 1969; 31(2):235-242.
7. Garn SM. Relationships between buccolingual and mesiodistal crown diameters. J Dent Res 1968; 47: 495.
8. Corruccini RS. Crown component variation in the hominoid lower second premolar. J Dent Res 1977; 56(9): 1093-1096.
9. Kondo S, Townsend GC. Associations between Carabelli trait and cusp areas in human permanent maxillary first molars. Am J Phys Anthropol 2005; 129(2):196-203.
10. Brook AH, Pitts NB, Renson CE. Determination of tooth dimensions from study casts using an image analysis system. J Int Asso Dent for Children 1983; 14:55-60.
11. Brook AH, Smith RN, Elcock C, Al-Sharood MH, Shah AA, Karmo M. The
measurement of tooth morphology: development and validation of a new image analysis system. In: Mayhall JT, Heikkinen T, eds. Dental Morphology. Oulu: Oulu University Press, 1999. p. 380-387.
system. In: Zadzinska E, ed. Current Trends in Dental Morphology Research. Lodz: University of Lodz Press, 2005. p. 475-482.
13. Shah AA, Brook AH, Elcock C, Smith RN. 2001. Relationship between lower incisor crowding and the facio-lingual widths of incisors at the contact point level using a new image analysis system. In: Brook A, ed. Dental Morphology. Sheffield: Sheffield Academic Press, 2001. p. 299-306.
14. Khalaf K, Elcock C, Smith RN, Brook AH. Fluctuating dental asymmetry of multiple crown variables measured by image analysis system. Arch Oral Biol 2005; 50:249-253. 15. Khalaf K, Robinson DL, Elcock C, Smith RN, Brook AH. Tooth Size in Patients with Supernumerary Teeth and a Control Group Measured by a New Image Analysis System. Arch Oral Biol 2005; 50:243-248.
16. Savara BS. Applications of photogrammetry for the quantitative study of tooth and face morphology. Am J Phys Anthropol 1965; 23(4):427-434.
17. Van der Linden FPGM, Boersma H, Zelders T, Peters KA, Raaben JH.
Three-dimensional analysis of dental casts by means of the Optocom. J Dent Res 1972; 51:1100. 18. Scott PJ. The reflex plotters: measurement without photographs. The Photogrammetric Record 1981; 10:435-446.
19. Takada K, Lowe AA, Decou R. Operational performance of the reflex metrograph and its applicability to the three-dimensional analysis of dental casts. Am J Orthod 1983; 83:195-199.
20. Butcher GW, Stephen CI. The reflex optical plotter; a preliminary report. Brit Dent J
1981; 151:304-305.
22. Mayhall JT, Kanazawa E. Three-dimensional analysis of the maxillary first molar crowns of Canadian Inuit. Am J Phys Anthropol 1989; 78(1):73-78.
23. Mayhall J, Townsend G. The changing crown morphology of maxillary first molars and its effect on the efficiency of mastication. In: Zadzinska E, ed. Current trends in Dental Morphology Research. Lodz: University of Lodz Press, 2005. p. 97-104.
24. Avishai G, Muller R, Gabet Y, Bab I, Zilberman U, Smith P. New approach to
quantifying developmental variation in the dentition using serial microtomographic imaging.
Micro Res Tech 2004; 65:263-269.
25. Evans AR, Harper IS, Sanson GD. Confocal imaging, visulaisation and 3-D surface measurement of small mammalian teeth. J Micro 2001; 204(2):108-118.
26. Kuroda T, Motohashi N, Tominaga R, Iwata K. Three-dimensional cast analysing system using laser scanning. Am J Orthod and Dento Orthoptics 1996; 110:365-9.
27. Motohashi N, Kuroda T. A 3D computer-aided design system applied to diagnosis and treatment planning in orthodontics and orthognathic surgery. Euro J Orthod 1999; 21:263-274.
28. Lu P, Li Z, Wang Y, Chen J, Zhao J. The research and development of non-contact 3-D laser dental model measuring and analysing system. The Chinese J Dent Res 2000; 3:7-14. 29. Hirogaki Y, Sohumura T, Satoh H, Takahashi J, Takada K. Complete 3-D reconstruction of dental cast shape using perceptual grouping. IEEE Transactions on Med Imag 2001; 20:1093-1101.
30. Fleiss JL. The Design and Analysis of Clinical Experiments. New York: Wiley and Sons, Inc., 1986. p. 1-32.
32. Silberman SL, Le Jeune RC, Serio FG, Devidas M, Davidson L, Vernon K. A method for determining patient oral care skills: the university of Mississippi oral hygiene index. J Perio
1998; 69:1176-1180.
33. Smith RN, Rawlinson A, Lath D, Elcock C, Walsh TF, Brook AH. Quantification of dental plaque on lingual tooth surfaces using image analysis: reliability and validation. J Clin Perio 2004; 31:569-573.
34. Jernvall J, Jung H-S. Genotype, phenotype, and developmental biology of molar tooth characters. Am J Phys Anthropol 2000; 31:171-190.
35. Cho SW, Lee HA, Cai J, Lee MJ, Kim JY, Ohshima H et al. The primary enamel knot determines the position of the first buccal cusp in developing mice molars. Differentiation
2007; 75(5):441-451.
36. Sharpe PT. Neural crest and tooth morphogenesis. Adv Dent Res 2001; 15:4-7.
37. Townsend G, Richards L and Hughes T. Molar intercuspal dimensions: genetic input to phenotypic variation. J Dent Res 2003; 82:350-355.
38. Harris EF, Dinh DP. 2006 Intercusp relationships of the permanent maxillary first and second molars in American whites. Am J Phys Anthropol 2006; 130(4):514-528.
39. Keene HJ. 1982 The morphogenetic triangle: a new conceptual tool for application to problems in dental morphogenesis. Am J Phys Anthropol 1982; 59(3):281-287.
40.Townsend GC, Brook AH. Genetic, epigenetic and environmental influences on dental development. Ortho (In press).
41. Kangas AT, Evans AR, Thesleff I, Jernvall J. Nonindependence of mammalian dental characters. Nature 2004;432:211–214.
Table 1. Intra-operator (Operator 1) and inter-operator (Operator 1 vs Operator 2) reliability, based on ICCC values, using 2-D image analysis
2-D image analysis (Upper left central ) Variables MD LL IG
Intra-Reliability 2D 1.00 0.988 0.994
Inter-Reliability 2D 0.779 0.818 0.919
(Upper right lateral ) Variables MD LL IG
Intra-Reliability 2D 0.991 0.983 0.995
[image:21.595.67.488.324.443.2]Inter-Reliability 2D 0.880 0.946 0.951
Table 2. Intra-operator (Operator 1) and inter-operator (Operator 1 vs Operator 2) reliability, based on ICCC values, using 3-D image analysis
3-D image analysis (Upper left central ) Variables
MD LL IG MDa LLa IGa SA Intra-Reliability 3D 0.887 0.907 0.985 0.921 0.95 0.976 0.996 Inter-Reliability 3D 0.918 0.561 0.975 0.759 0.704 0.967 0.988
(Upper right lateral ) Variables
MD LL IG MDa LLa IGa SA Intra-Reliability 3D 0.982 0.925 0.974 0.90 0.883 0.958 0.991 Inter-Reliability 3D 0.940 0.781 0.967 0.838 0.820 0.906 0.991
Table 3. Pearson’s correlation coefficient values for comparisons of 2-D and 3-D image analysis.
(Upper left central ) Variables MD LL IG Correlation coefficient 0.931** 0.530* 0.947**
(Upper right lateral ) Variables MD LL IG Correlation coefficient 0.943** 0.672** 0.989**
[image:21.595.65.432.522.611.2]Figure Legends
Figure 1. 2-Dimensional Image Analysis System Equipment
Figure 2. Example of a 2-D Digital Image Figure 3. 3-D Image Analysis Equipment
Figure 3. 2-Dimensional Image Analysis System Equipment
Key
D : Digital camera, K : Kaiser copy stand, M : Model stand with dental study model, S : Source of illumination
(standardised), L : Laptop, connected to digital camera (D)
D
K
M
S
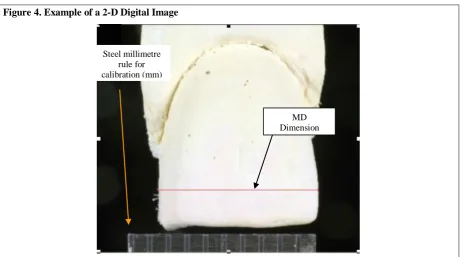
Figure 4.Example of a 2-D Digital Image
Image of upper left central incisor produced with the 2-D Image Analysis system, showing MD dimension and steel rule
used for calibration
Steel millimetre rule for calibration (mm)
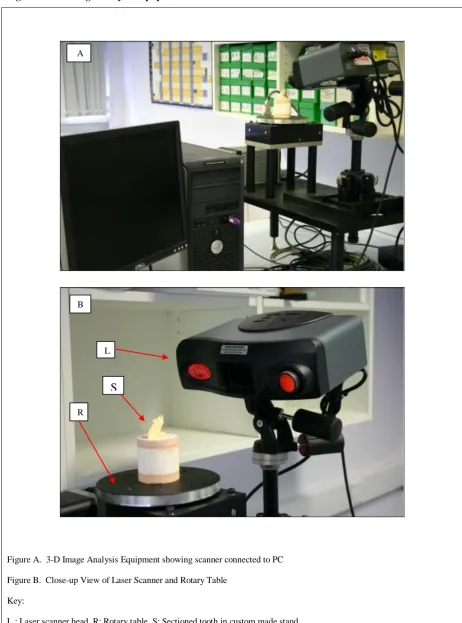
Figure 3. 3-D Image Analysis Equipment
[image:25.595.65.528.82.706.2]Figure A. 3-D Image Analysis Equipment showing scanner connected to PC
Figure B. Close-up View of Laser Scanner and Rotary Table
Key:
L : Laser scanner head, R: Rotary table, S: Sectioned tooth in custom made stand A
B
L
R
Figure 4. Example of projected and actual mesio-distal measurements with 3-D Image Analysis Equipment
Figure A. Labial view showing actual and projected MD measurements
Figure B. Occlusal view showing actual (multiple crosses) and projected (straight line) MD measurements MD
Projected
MD Actual