Optimizing the coupling of a firebrand generator to a horizontal wind
tunnel
Javad Hashempour
a, Ahmad Sharifian
bComputational Engineering and Science Research Centre (CESRC), Faculty of Engineering and Surveying, University of Southern Queensland, Toowoomba, Australia
a
[email protected], bsharifian@ usq.edu.au
Keywords: Firebrand, Wind tunnel, Bushfire, Wind speed
Abstract—Australia is considered as the most fire-prone country in the world. Spotting ignition by lofted firebrands is the main mechanism of fire spread. Many experimental studies have been conducted to evaluate the effect of the firebrand attacks on structures and to identify possible solutions. The experimental facility consists of a firebrand generator coupled to a wind tunnel. The wind speed in the firebrand generator is relatively low, in order to assure a quality continuous flow of glowing firebrands. On the contrary, the wind speed in the wind tunnel is high to duplicate actual firebrand attacks. Previous works show a highly turbulent region above the entrance of firebrands to the wind tunnel which is formed because of the velocity difference and penetration of firebrand entrance hose into the wind tunnel. The penetration is required to provide a uniform firebrand distribution along the height of the test section. In this computational work, the influence of the height of the entrance hose, its orientation respect to the tunnel and the distance between the coupling port and the test section are analyzed. The optimized results are presented and discussed for a variety of wind speeds within the wind tunnel and the firebrand generator.
Introduction
Bushfires cause human losses and have devastating economic impacts on communities. In a recent event, the Victoria’s tragic bushfires killed 173 people, injured more than thousands of people and has burnt approximately 350000 hectares in 2009[1].The frequency of such incidents indicates the lack of an effective solution to contain bushfires. This fact emphasizes the need for further studies on bushfires and the ways that they spread. Direct flame contact, radiation heat flux, wind and firebrand are traditionally known as primary source to the spread of bushfire. It has been found that firebrands are the foremost cause of bushfire spread and the predominant reason of structural damages at the time of bushfires [2].
To further probe the effects of firebrand on the propagation of bushfires, a recent research study attempted to experimentally evaluate the impact of physical properties of firebrands on various structures and to determine how much heat can be transferred by firebrands. The facility to generate firebrand shower is called “dragon” and is introduced by National Institute of Standards and Technology (NIST) [3]-[6]. The facility includes a vertical pipe that is attached to the base of a wind tunnel. A horizontal screen, where the mulch will be deposited, is placed in the middle of
[image:1.595.337.536.571.681.2]the vertical pipe. The mulch is ignited using two burners, and then the glowing mulch travels up to the wind tunnel using a blower located at the base of the vertical pipe. A fan mounted at the inlet of the wind tunnel provides a constant wind speed in the wind tunnel and directs the outlet of the firebrand generator into the test section. The test section has a limited size in order to enable experiments at high wind speeds. However limiting the size of the test section could cause errors compared to the
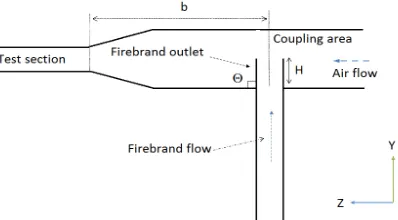
Fig. 1 Scheme of the firebrand generator coupled to the horizontal wind tunnel.
Advanced Materials Research Vols. 726-731 (2013) pp 971-976 Online available since 2013/Aug/16 at www.scientific.net © (2013) Trans Tech Publications, Switzerland
doi:10.4028/www.scientific.net/AMR.726-731.971
real size experiments. Therefore, it is important that larger areas of the test section to be properly used and for that a uniform firebrand distribution within the test section is necessary. In the case of placing screens with different porosities in the test section, the firebrands could block the openings of the screens and limit the test period to a few minutes or less which does not yield statistically reliable results.
In this paper, the optimization of the outlet of the fire brand generator has been carried out in order to improve the uniformity of the firebrand flow through the test section. The following variables are considered during the optimization: the height of the firebrand outlet, the orientation of the firebrand outlet, and the distance of the firebrand outlet from the test section. In addition, the performance of the selected configuration under three wind speeds is investigated
Modelling
The computational domain is shown in Fig.1. The height and width of the test section are equally set to 20 cm and the diameter of the pipe containing the firebrand flow is assumed to be 20 cm. The outlet of the firebrand pipe is located 60 cm far from the inlet of the wind tunnel (see Fig.1). The inlet of the wind tunnel is square with a size of 40 cm. The length of the wind tunnel before the contractor, the
length of the test section, and the length of the contractor are 150 cm, 80 cm and 60 cm, respectively. The domain is halved due to the symmetrical structure with respect to the YZ plane. Tetrahedron
elements are used for meshing and the number of total elements is varied between the simulations and is in the range of 1,350,000 to 1,400,000. The inlet to the wind tunnel and firebrand flows are assumed to be air at different temperatures. The glowing firebrands have different shapes, sizes, densities, and temperatures with each other and with air, hence assuming their properties as those of air causes inaccuracies in determination of the flow homogeneity at the test section. However, it is not expected that this assumption will have a major impact on the geometry of the optimized configuration. Air assumed to be an ideal gas with constant specific heat coefficients.
The inlet to the wind tunnel and the firebrand flow are assumed to have temperature of 25˚C and 200˚C, respectively. All walls are assumed to be adiabatic, nonslip and made of stainless steel with a roughness of 0 .046 mm [7]. The reference pressure is taken to be 1 atmosphere and the gravity is 9.8 m/s2 in the –y direction. According to Manzello et al and Knight, the firebrand velocity should be in the range of 3 m/s to 4.4 m/s. A higher velocity produces flaming firebrands instead of glowing firebrands, and smoke appears at lower velocities [8], [9]. In this work, the firebrand velocity is assumed to be 3.5 m/s in the +y direction. The flow at the inlet of the wind tunnel is also initially assumed to have a speed of 3.5 m/s in the +z direction. The performance of the optimized configuration is also examined at inlet velocities of 5 m/s and 10 m/s.
Three parameters of the optimization are the height of the firebrand outlet inside the wind tunnel (H), the orientation of the firebrand outlet (Θ) and the distance between the test section and the outlet pipe (b), see Fig.1. The governing equations are continuity, Navier-Stokes and thermal energy. The flow is expected to be turbulent and the Renormalization Group (RNG) k-ε model is used to simulate turbulence behavior in the flow. The inlet and the firebrand flow are initially assumed to be 10% turbulent and the buoyancy turbulence is set to production and dissipation.
Cases Firebrand flow area at the start of
the test section ( )
Filling Ratio (%)
a* 212 53
b* 222 55.5
c* 218 54.5
d* 220 55
e* 204 51
f* 190 47.5
g* 256 64
TABLE1:The calculated filling ratios of different cases (* see figures 2 & 3)
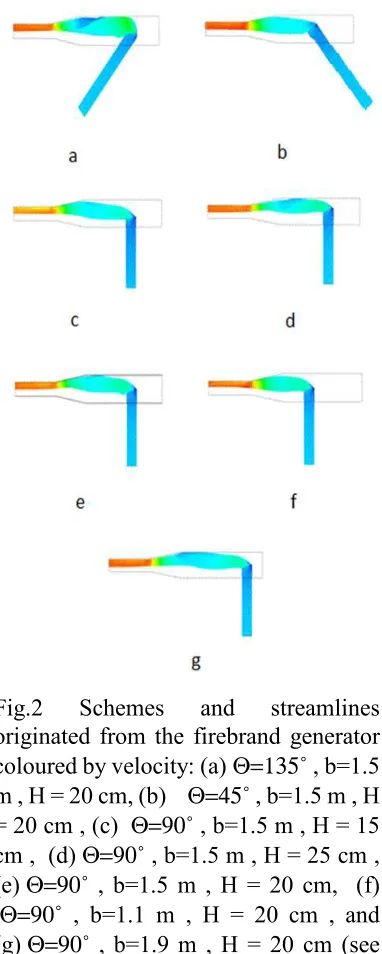
Fig.2 Schemes and streamlines originated from the firebrand generator coloured by velocity: (a) Θ=135˚ , b=1.5 m , H = 20 cm, (b) Θ=45˚ , b=1.5 m , H = 20 cm , (c) Θ=90˚ , b=1.5 m , H = 15 cm , (d) Θ=90˚ , b=1.5 m , H = 25 cm , (e) Θ=90˚ , b=1.5 m , H = 20 cm, (f)
Θ=90˚ , b=1.1 m , H = 20 cm , and
(g) Θ=90˚ , b=1.9 m , H = 20 cm (see Fig.1).
Results
The results are divided into five sections of effects of the height of the firebrand outlet (H), effects of the firebrand outlet orientation (Θ), effects of the distance between the firebrand outlet and the test section (b), optimized configuration, and effects of the inlet wind speed on the uniformity of the firebrand flow at the test section.
Orientation effects
The effects of the orientation of the firebrand outlet on the homogeneity of the flow at the test section are investigated; assuming different angles of Θ=45 o, Θ=90 o, and Θ=135 o (see Fig.2a, Fig.2b and Fig.2e). In all these cases, the horizontal distance of the base of the firebrand outlet from the test section is 1.5 m and the height of the outlet is 0.2 m. It should be noted that the distance between the top of the firebrand outlet and the test section slightly changes at different angles.
In the case of Θ=135 o (see Fig.2a), the firebrand flow becomes highly turbulent and the turbulence kinetic energy becomes 4.96 J/kg at the top of the outlet. The turbulence will facilitate the mixing of the inlet flow and the firebrand flow and is expected to generate a more homogenous flow profile in the test section. In the case of Θ=90 o, the height of the firebrand plume increases (see Fig.2e) and consequently the firebrand flow does not fill up the lower parts of the test section (see Fig.3e). The turbulence kinetic energy at the top of the firebrand outlet reaches to a value of 1.75 J/kg which is less than that obtained in the previous case. In the case of Θ=45 o, the turbulence kinetic energy at the top of the firebrand outlet is 1.2 J/kg.
In order to provide a comprehensive assessment of the expansion of the firebrands flow within the test section, a ratio has been defined to quantify the ability of the firebrand flow to fill the test section. The filling ratio which provides the opportunity to compare the cases is
defined as following;
t f fiiling
A A
R = (1)
Where At is the test section area (400 cm2) and Af is the area of a rectangle that covers all streamlines originate from the firebrand outlet and pass the middle of the test section, The filling ratio is calculated for the three cases and the results are presented in Table I. According to the Table I, the maximum filling ratio is achieved at Θ=45 o (case b) which is contrary to what was expected since the maximum turbulence kinetic energy occurs at Θ=135 o. The velocity triangle can be used to analyze the results. In the case of Θ=135 o, the horizontal velocity of the combined flow at the top of the firebrand outlet is smaller than that of Θ=45 o, but their vertical velocity components are the same. This causes the flow in the case of Θ=135 o moves upward in
[image:3.595.340.531.276.753.2]comparison to the case of Θ=45 o. Therefore, the firebrand flow does not pass through the lower parts of the test section, as shown in Fig.3a and Fig.3b.
Among the three cases, the minimum filling ratio is attained at Θ=90 o in which the turbulence kinetic energy is a minimum (case e).
Height effect
Three firebrand outlet heights of 15 cm, 20 cm and 25 cm are selected to assess the impact of the height on the expansion of the firebrand flow in the test section.
In the case of H=15 cm, the maximum turbulence kinetic energy of the firebrand flow in the vicinity of the coupling area has increased from 1.75 J/kg (H=20 cm) to 2.5
J/kg.
However, the volume of the high turbulent flow is smaller than that of the case H=20 cm. In the case of H=25 cm, the maximum turbulence kinetic energy is 3.06 J/kg and the volume of the high turbulent flow is larger than other cases.
The maximum filling ratio of 55% is obtained in the case
of H=25 cm, where the flow has the maximum turbulence kinetic energy. The case H=15 cm also shows higher filling ratio (54.5%) than the case of H=20 cm due to higher turbulence level.
Distance effects
In order to evaluate the effect of the distance between the firebrand outlet and the test section on the homogeneity of the flow at the test section, the distance has been shifted ± 40 cm as shown in Fig.2f and Fig.2g.
In all the cases, the height and orientation of the firebrand outlet are 20 cm and 90 o, respectively. In the case of b=1.1 m, the turbulence kinetic energy increases to 3.157 J/kg due to proximity of the outlet to the contractor and in the case of b=1.9 m increases to 2.75 J/kg due to nearness of the outlet to the inlet of the wind tunnel. The filling ratio is 47.5%, 51%, and 63% for the distance of 1.1 m, 1.5 m, and 1.9, respectively. It should be noted that the firebrand flow tends to move upward due to its higher temperature at the proximity of the coupling. This tendency decreases at further distances from the coupling area as its temperature decreases.
At the distance of 1.9 m, the firebrand flow is more turbulent than the
case of b= 1.5 m, and has more time to cool down. This causes the firebrand flow to descend and cover the lower parts of the test section. On contrary, in the case of b=1.1 m, the firebrand flow raises but does not fall down. This can explain why the filling ratio in the case of b=1.5 m is higher than that in the case of b=1.1 m.
The optimized configuration
The results from the previous sections show that the optimum geometry can be found by increasing the turbulence of the firebrand flow in the coupling area, by making the firebrand
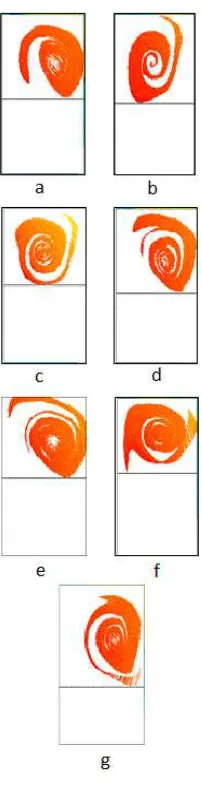
Fig.3 Cross section of the firebrand flow at the start of the test section.
(a) Θ=135˚, b=1.5 m , H = 20 cm, (b)
Θ=45˚, b=1.5 m, H = 20 cm , (c)
Θ=90˚, b=1.5 m, H = 15 cm,
(d) Θ=90˚, b=1.5 m, H = 25 cm ,
(e) Θ=90˚, b=1.5 m, H = 20 cm, (f )
Θ=90˚, b=1.1 m, H = 20 cm, and
(g) Θ=90˚, b=1.9 m, H = 20 cm (see
figure 1).
[image:4.595.410.511.251.646.2]path substantially horizontal, or by increasing the distance of the firebrand outlet to the test section. All these conditions could be met in the case of Θ=135 o, height of 25 cm and a long distance between the coupling area and the test section. Due to the limit on the length of the wind tunnel in this work, the second best configuration has been preferred. In the selected configuration, the firebrand outlet height is 25 cm; its distance from the test section is 1.9 m, and Θ=45o. This design creates less turbulence than that of Θ=135o, but the firebrand flow is more horizontal compared to other cases.
The optimized configuration under different wind speeds
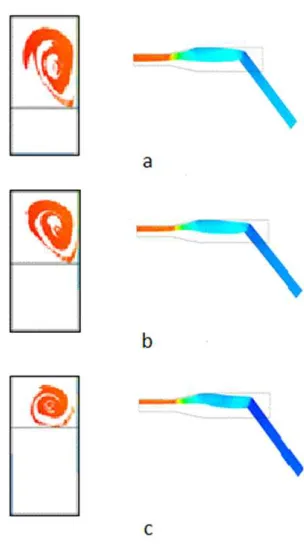
In this section, the performance of the optimized geometry under three inlet wind speeds of 3.5 m/s, 5 m/s and 10 m/s is examined. The height and orientation of the firebrand outlet are 25cm and 45o and its distance from the test section is 1.9 m. Fig.4 and Table II present the results. In the case of the inlet wind speed of 3.5 m/s, the turbulence kinetic energy is 3.116 J/kg which is greater than that of b=1.5 m (1.2 J/kg). The results also show that the optimized configuration has the maximum filling ratio of 66.5% at the inlet wind speed 3.5 m/s.
Increasing the inlet wind speed increases the turbulence but reduces the filling ratio. The turbulence kinetic energy is 1.58 J/kg, 2.31 J/kg, and 7.95 J/kg at the inlet wind speeds of 3.5 m/s, 5 m/s, and 10 m/s, respectively. However, as the speed of the firebrand flow is constant, the ratio of the firebrand volume flow rate to the inlet volume flow rate decreases with increase of the inlet wind speed. This causes the filling ratio of 66.5% drops to 51.5% and 37% at the inlet wind speeds of 5 m/s and 10 m/s, respectively.
Conclusion
Firebrand can spread fires miles away from the ignition point. Studying firebrands requires experimental facilities that can create a real situation. Due to constraints of budget and space, the size of the test section of the facility is limited. Therefore, it is significant to create a homogenous firebrand flow that passes through all parts of the test section. In this work, for a 4 m long wind tunnel (including the diffuser), the coupling of the firebrand outlet and the wind tunnel were investigated in order to increase the homogeneity of the firebrand flow in the test section. The variables which were investigated included the height and orientation of the firebrand outlet and its distance from the test section.
The results show all these geometric variables affect the homogeneity of the firebrand flow in the test section through changes in the turbulence level and the direction of the firebrand flow in the vicinity of the coupling area. In addition, a longer distance between the coupling area and the test section provides more time for the mixing of the inlet and the firebrand flows. The original design had a firebrand outlet with a height of 20 cm, an angle of 90o and a distance of 1.5 m between the coupling area and the test section. Taking into account the results of this work and the overall length limit of the wind tunnel, the new design has the firebrand outlet with a height of 25 cm, an angle of 45o and the
Fig.4 Schemes and streamlines originated from the firebrand generator coloured by velocity and cross section of the firebrand flow of the selected configuration at the start of the test section with three different inlet wind speeds, (a) the inlet wind speed of 3.5 m/s, (b) the inlet wind speed of 5 m/s, and (c) the inlet wind speed of 10 m/s.
[image:5.595.368.520.79.352.2]distance of 1.9 m between the coupling area and the test section. The computational results show the new design diversify the firebrand passage within the test section and covers 66.5% of the test section which is 30% more than that of the original design at the same inlet wind speed. The results also show that increasing the inlet wind speed has an adverse impact on the filling ratio. It should be noted that the computational results are only valid in comparison between the cases.
References
[1] P.A Cameron, Mitra B, Fitzgerald M, Scheinkestel CD, Stripp A, Batey C, Niggemeyer L, Truesdale M, Holman P, Mehra R, Wasiak J & Cleland H, “Black Saturday: the immediate impact of the February 2009 bushfires in Victoria’’, Australia, volume 191 No 1, 2009.
[2] J. Mitchell, “Wind enabled ember dousing’’; Fire safety journal, 41, 2006, pp.444-458.
[3] Manzello, S.L., John R. Shields, J.R., Cleary, T.G., Maranghides, A., Mell, W.E., Yang, J.C., Hayashi, Y., Nii, D. & Kurita, T. “On the development and characterization of a firebrand generator’’, Fire safety journal, 43, 2008, pp.258 -268.
[4] S.L .Manzello,Park, S.H., Suzuki, S., Shields, J.R.& Hayashi, Y., “Experimental investigation of structure vulnerabilities to firebrand showers’’, Fire safety journal, 46,2011 , pp.568- 578. [5] S.Manzello,Suzuki, S. & Hayashi, Y., “ Enabling the study of structure vulnerabilities to ignition
from wind driven firebrand showers: A summary of experimental results’’, Fire safety journal, 2012.
[6] S.Suzuki, , Manzello, S.L. & Hayashi,Y., The size and mass distribution of firebrands collected from ignited building components exposed to wind, Fire safety journal, 2012.
[7] R. Fox, Pritchard, P.J. & McDonald, A.T., Introduction to fluid mechanic, Seventh edition, John Wiley & Sons, Inc. 2009.
[8] I.K .Knight, “The design and construction of a vertical wind tunnel for the study of untethered firebrands in flight’’. Fire Technology, 37, 2001, pp.87-100.
[9] S.L.Manzello,. & Suzuki, S., “The new and improved NIST Dragon’s LAIR (Lofting and Ignition Research) facility’’, Fire and Materials Journal, 2011.
Advances in Environmental Technologies
10.4028/www.scientific.net/AMR.726-731
Optimizing the Coupling of a Firebrand Generator to a Horizontal Wind Tunnel