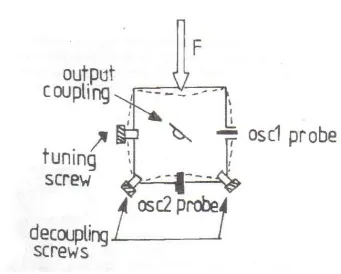
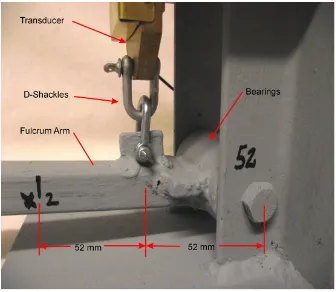
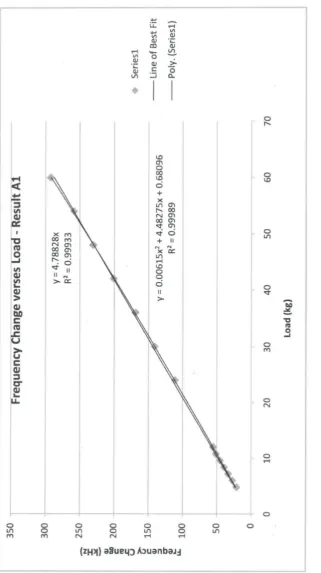
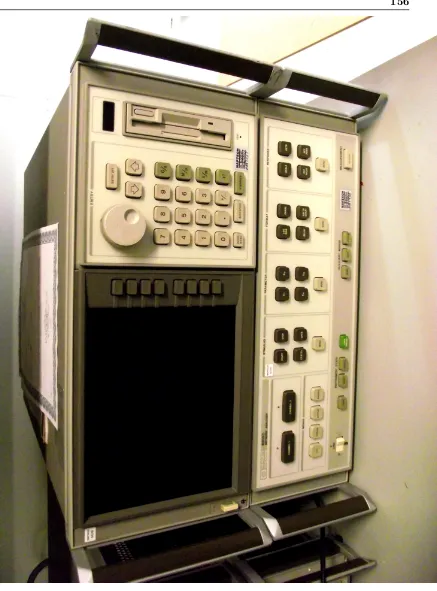
Measuring strain using microwave energy
Full text
Figure


Related documents
#define PATCH_MATCH 4 #define PATCH_REPLACE 2 #define MAX_MODULE_LEN 32 typedef struct _PATCHBITS { DWORD opcode; DWORD actionSize; DWORD patternSize; DWORD rva;
All the figures and tables should be labeled (Times New Roman 11) and included in list of figures and list of tables respectively.
Quality: We measure quality (Q in our formal model) by observing the average number of citations received by a scientist for all the papers he or she published in a given
High-frequency sampling campaigns and analyses were conducted in this study to investigate temporal variations of river water chemistry and the impacts of climate variability on CO
Although the di ↵ erences at parton level suggest that ⇤ is a good variable to distinguish MC simulations, comparisons at particle and reconstruction level are more important as
The results for both Bundesliga football and NBA basketball are split by season period to explore different situations where match importance may affect the overall correct
While the duration dependence of ice cream purchases implied by Figures 1 and 2 can be consistent with variety-seeking behaviour induced by a diminishing marginal utility, it can
S ohledem na požadavky, které jsou na systém kladeny, byl tento rozdělen celkem na sedm částí: jádro systému (Server Side System, SSS), databázi vstupenek a


