Business and Finance Journal
Volume 7 | Issue 4
Article 3
Determinants of the Strength of Auditing and
Reporting Standards: a Cross-Country Study
Pran Krishansing Boolaky
Griffith University, [email protected]
Chandrasekhar Krishnamurti
University of Southern QueenslandAriful Hoque
Murdoch UniversityFollow this and additional works at:
http://ro.uow.edu.au/aabfj
Copyright ©2013 Australasian Accounting Business and Finance Journal and Authors.
Research Online is the open access institutional repository for the University of Wollongong. For further information contact the UOW
Recommended Citation
Boolaky, Pran Krishansing; Krishnamurti, Chandrasekhar; and Hoque, Ariful, Determinants of the
Strength of Auditing and Reporting Standards: a Cross-Country Study,
Australasian Accounting
Business and Finance Journal
, 7(4), 2013, 17-36.
Cross-Country Study
Abstract
Our study addresses the research gap regarding the absence of an empirical cross-country study on the determinants of the strength of auditing and reporting standards (SARS). Using data on 133 countries at various stages of development, we examine the role of environmental factors that influence a country’s strength of auditing and reporting standards. Our empirical results confirm that institutional infrastructure, financial market development and higher education and training jointly influence a country’s strength of auditing and reporting standards. We obtain qualitatively similar subsample results when we partition countries on the basis of economic development.
Keywords
Determinants of the Strength of Auditing
and Reporting Standards:
a Cross-Country Study
Pran Krishansing Boolaky1, Chandrasekhar Krishnamurti2 and Ariful Hoque3
Abstract
Our study addresses the research gap regarding the absence of an empirical cross-country study on the determinants of the strength of auditing and reporting standards (SARS). Using data on 133 countries at various stages of development, we examine the role of environmental factors that influence a country’s strength of auditing and reporting standards. Our empirical results confirm that institutional infrastructure, financial market development and higher education and training jointly influence a country’s strength of auditing and reporting standards. We obtain qualitatively similar subsample results when we partition countries on the basis of economic development.
Keywords: Auditing and Reporting Standards; Development; Global
JEL Code: M40
1
Griffith University
Email: [email protected] 2
University of Southern Queensland 3
1. Introduction
The increased trend in internationalisation of business and financial markets necessitates higher quality financial information produced in accordance with strong auditing and reporting standards. Prior research has shown that earnings quality is value-relevant. Firms with lower quality of earnings experience poorer future stock returns (Chan et al. 2001). Furthermore, poor earnings quality increases equity risk premium (Yee 2006). Francis et al. (2005) shows that firms with lower quality earnings have higher costs of capital due to lower debt rating, larger realised costs of debt, and larger equity betas. Recent evidence shows that firms with more transparent earnings enjoy a lower cost of capital (Barth et al. 2010).
Recent empirical work shows that country level accounting quality is relevant to users of financial information. Hail and Leuz (2006) provide empirical support consistent with the view that firms from countries with more extensive disclosure requirements have a significant lower cost of equity capital. Ang and Ciccone (2001) find that firms in countries with more disclosure requirements have lower dispersion of analysts’ forecasts of error. Thus firm level benefits seem to follow from country level institutional transparency.
A natural question that arises in this context is “what are the determinants of institutional transparency?” Extant work in international accounting argues that the strength of accounting quality is principally influenced by critical environmental factors such as economic forces, social forces, legal system, culture and political system (Briston 1978; Nobes 1983; Doupnik & Salter 1995; Nobes 1998). While several studies have examined the impact of firm level factors influencing the quality of accounting information produced by a typical firm, it has been recognised in extant research that country level factors are much more significant in explaining cross-country variations in earnings quality (Davis-Friday 2010). This view is further reinforced by the work of Ball (1995) and Nobes (1998) who posit that accounting systems and the level of market transparency are functions of the characteristics of the legal systems and financing methods prevalent in a country. Rahman et al. (2010) provides recent evidence suggesting that institutional variables such as organisational structure, nature of debt, and regulations vary systematically between countries and that this variation explains financial reporting quality in international settings. Chen at al. (2010) investigate the relationship between accounting quality and international financial reporting standards in the European context and suggest that accounting standards play a role in improving the quality of reporting.
However, a remarkable research gap in this area is the absence of an empirical cross-country study on the determinants of the strength of auditing and reporting standards (SARS). Our study is designed to address this significant lacuna.
Our study is the first one to examine the determinants of the strength of auditing and reporting standards at the global level. We study the role of environmental factors that are expected to play a key role in affecting a country’s strength of auditing and reporting standards. First, we analyse the role of institutional infrastructure in determining the SARS level in a given country. Second, we take into account the state of financial market development at the country level and examine its influence on strength of auditing and reporting standards. Finally, we consider the role of higher education and training in affecting the level of SARS in a given country.
We examine the strength of auditing and reporting standards in 133 countries using data sourced from the 2009-2010 Global Competitiveness Report (GCR) published by the World Economic Forum (WEF). In addition to studying the influence of the environmental factors of the overall sample, we also examine subsamples classified on the basis of the stage of development of countries. Our empirical results confirm that institutional infrastructure, financial market development and higher education and training all play significant roles in shaping a country’s strength of auditing and reporting standards.
The rest of this paper is organised as follows. We present a review of prior research and develop our hypotheses in section 2. We describe our data and methodology in section 3. Our empirical results are presented and discussed in section 4. Our concluding remarks are contained in section 5.
2. Prior Research and Hypotheses Development
Our dependent variable is strength of auditing and reporting standards (SARS). SARS is a proxy for institutional transparency which is expected to have a major bearing on the quality of financial information produced by companies in a given country (WEF, GCR 2009-2010). As such, we propose to assess SARS at the country level and relate it to key environmental variables also measured at the country level. We first survey the literature to outline prior research that provides us the theory for developing hypotheses.
Literature Survey
A thorough survey of the literature shows that institutional transparency is influenced by three major factors. Firstly, prior research has confirmed that institutional infrastructure
plays a key role in influencing institutional transparency. Institutional infrastructure can be classified into two categories: public and private, and they include governance, economic, legal and social infrastructure (see Briston 1978; David & Brierley 1985; Parker 1989; Salter & Doupnik 1992; Jaggi & Low 2000). For example, David and Brierley (1985) contend that the type and effectiveness of the legal system of a country influences the regulatory system of accounting. Salter and Doupnik (1992) take this view further by arguing that political and legal infrastructure of a country impact on the strength of accounting and auditing of a country. This view is later supported by El Ghoul et al. (2010) who find evidence indicating that legal environment plays a significant role in influencing audit quality, translating into an appreciably lower equity risk premium for clients of Big Four auditing firms. They use public enforcement as the proxy for the quality of legal enforcement.
Corporate ethics and accountability are the underlying components of the strength of private institutional infrastructure. Wright (1996) presents the earliest empirical evidence indicating that the credibility of financial statement information is related to corporate governance features. He uses the composition of the board of directors to signify the quality of corporate governance. Imhoff (2003) suggests a number of measures to reform corporate governance of boards in order to improve financial reporting quality. Labelle et al. (2010) study whether the degree of ethical development of a corporation is related to the quality of its financial reporting. They use diversity management to proxy for ethical behaviour of the firm, and earnings management to signify financial reporting quality. They hypothesise that firms promoting strong ethical behaviour in the conduct of their business operations incorporate the interests of all stakeholders instead of just the shareholders’ interests, and will tend to have greater aversion to earnings management practices.
Secondly, the state of financial market development is another key factor influencing institutional transparency (see Zysman 1983; Frank & Mayer 1992; Kenway 1994). Zysman (1983) states that a country with a developed capital market requires a strong auditing and reporting standards compared to a country with a less-developed capital market. This view was supported by Frank and Mayer (1992) and Kenway (1994). Adhikari and Tondkar (1992) conduct a cross-country study of disclosure, investigating the role of environmental factors. They confirm, empirically, that the size of equity market explains the variation in disclosure levels. This view was further evidenced by Nobes (1998) in his study on the reasons for the international differences in financial reporting. El Ghoul et al. (2010) find that firms located in countries with large and vibrant stock markets are associated with higher demand for accounting transparency. Based on prior research, we conjecture that financial market sophistication should influence the strength of auditing and reporting standards in a country. Furthermore, countries in which financing through local equity markets is predominant should have a higher quality of auditing and reporting standards due to the informational needs of the investors. This will increase the transparency and reliability of the financial reports for the users.
We argue that transparency and reliability of auditing and reporting cannot be achieved in isolation, but requires a conducive regulatory system that includes stock market regulation. A potentially important role for securities regulation is to function as a commitment device (Verrechia 2001). Extensive disclosures are likely to reduce information asymmetries between users of financial statements and the firm. However, this reduction in information asymmetry is contingent upon credibility of disclosures (Leuz & Verrechia 2000). Effective stock exchange regulations provide the requisite credibility.
In addition to the quantity and quality of skills in a country it is also likely that efficient use of talent is a prerequisite for maintaining a high level of auditing and reporting standards. We imply here the use of professional judgement and compliance with relevant rules and regulation. In a similar vein, Solomon and Trotman (2003) argue that practising accountants and auditors need to use their professional talent in the implementation of auditing and reporting standards to enhance audit and reporting effectiveness.
Hypotheses Development
Based on our discussion in the previous subsection, we posit that the degree of institutional transparency as proxied by SARS is influenced by three major factors. Firstly, we believe that the orientation of institutional infrastructure will play a key role in determining the SARS level in a given country. Secondly, we consider the state of financial market development as a critical variable that influences the SARS level at the country level. Finally, the strength of higher education and training is expected to play a significant role in influencing the level of SARS in a given country.
The dependent variable, SARS, is assessed on the basis of executive opinion surveys and is an assessment of financial auditing and reporting standards. It measures institutional transparency pertaining to informational needs of investors and business managers.
For the first factor, namely, institutional infrastructure, we have the following three variables that are available from the WEF, GCR (2009-2010) report. All three variables are scored on the basis of executive opinion surveys.
EBOF: Ethical behaviour of firms compares corporate ethics (ethical behaviour in interactions with public officials, politicians, and other enterprises) of firms in one country with firms of other countries in the world (WEF, GCR, 2009-2010, p. 361).
EOLFW: Efficiency of legal framework in challenging regulations refers to how efficient the legal framework for private businesses is in challenging the legality of government actions and/or regulations (WEF 2010, p. 355).
EOCB: Efficacy of corporate boards refers to the characteristics of corporate governance based on corporate governance pertaining to boards of directors in a country (WEF, GCR, 2009- 2010, p. 361).
We therefore posit the following hypotheses:
H1: The level of efficiency of legal framework in a country is positively associated with the level of SARS.
H2: The level of ethical behaviour of firms in a country is positively associated with the level of SARS.
H3: The level of efficacy of corporate boards of firms in a country is positively associated with the level of SARS.
For the second factor, namely, financial market development, we have the following three variables that are available from the WEF report. All three variables are scored on the basis of executive opinion surveys.
FMS: Financial market sophistication refers to the level of sophistication of the financial markets in a country (WEF, GCR 2009-2010, p. 430).
LEMF: Financing through local equity market refers to the ease with which money is raised by issuing shares on the stock market in a country (WEF, GCR2009-2010, p. 431).
SER: Securities exchange regulations refer to the effectiveness of regulation of securities exchange of a country (WEF, GCR, 2009-2010, p. 437).
Based on the above discussion, we formally state the following hypotheses:
H5: The level of financing through local equity markets in a country is positively associated with the level of SARS.
H6: The quality of stock market regulations in a country is positively associated with the level of SARS.
For the third factor, namely, higher education and training, we have the following variables that are available from the WEF report. The first variable, HET, uses hard data while the second one (ROPM) is based on executive opinion surveys.
HET: Higher education and tertiary enrolment refers to the gross tertiary education enrolment rate in a country (hard data) (WEF, GCR,2009-2010, p. 395).
ROPM: Reliance on professional management is measured through surveys and is used as an indicator of efficient use of talent(WEF 2010, p. 426). We posit the following hypotheses to test the validity of our third factor below:
H7: The level of higher education and training in a country is positively associated with the level of SARS.
H8: The level of efficiency of usage of talent in a country is positively associated with the level of SARS.
3. Data and Methodology
Data for this study are drawn from the Global Competitiveness Report (2009) of the World Economic Forum (WEF 2010). This data source is both reliable and comprehensive and used by many researchers in social sciences. The WEF draws its data from international hard data sources and Executive Opinion Survey (WEF 2010, pp. 335-475). The Survey, conducted by WEF, is a reputable source of timely and vital information related to the business environment in which business executives operate in several countries. It is widely used in academic research (Black & Carnes 2006; Van de Walle 2006; Yang & Huang 2009). The WEF Survey addresses 12 pillars of the Global Competitiveness Index. Responses to the survey questions are assessed on a 7-point Likert scale, where 1 represents the lowest possible score and 7 the highest possible score. The data from the survey gives a comparative qualitative picture of the economic and business environment of each country. Appendix A provides the list of 133 countries together with their SARS scores. Our choice of WEF data is driven by our motivation to maximise the sample size. Other data sources cover lesser number of countries and therefore would preclude stronger statistical tests.4
The hard data are basically quantitative data collected from a variety of sources. WEF uses the most recent data available from international organisations such as World Bank, United Nations etc. A more detailed description of the hard data is found in the Technical Notes of the WEF, GCR (2009-2010). For this study, we are using ten variables from the twelve pillars for global competitiveness index to assess their effects on the strength of auditing and reporting at a global level. Appendix B describes the variables used in this study.
WEF uses the following standard formula for converting hard data:
6 x (country score – sample minimum) + 1 (sample maximum – sample minimum)
4
The sample minimum and sample maximum are, respectively, the lowest and highest country scores in the sample of countries covered by the GCI. In some instances, adjustments were made to account for extreme outliers.5 Based on the scores, all countries in the sample (133) are ranked on that particular variable. We use the ranks in our tests.
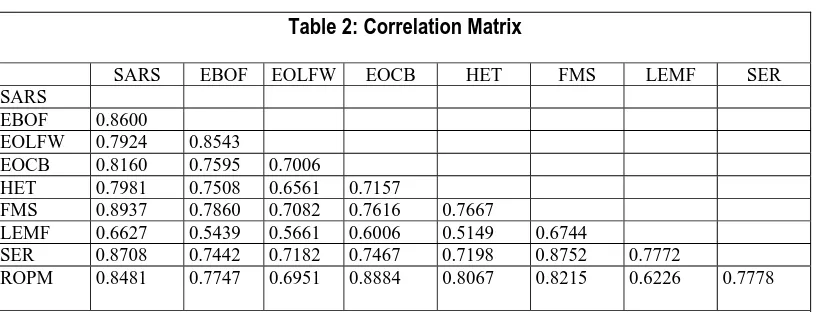
The descriptive statistics of all the variables used in our study are displayed in Table 1. In Table 2, we report the correlation matrix. Most of our independent variables have high correlation between themselves. This is likely to cause problems with interpretation of our multivariate regression results. To mitigate this we use univariate regressions in addition to multivariate tests to examine the statistical validity of the several hypotheses developed in section 2. These are reported in the following section.
4. Empirical Results
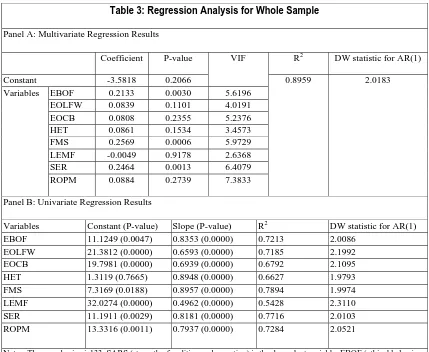
In order to empirically examine the validity of our different hypotheses, we conduct country-level regressions. We regress the ranks of SARS on the ranks of the various independent variables described in Appendix B. We control for first order autocorrelation in the dependent variable using an AR (1) term. The multivariate regression results for our entire sample of 133 countries are provided in Panel A of Table 3.6
For the overall sample, three of the variables are statistically significant at conventional levels. The adjusted R2 of the model is 89%. They are EBOF, FMS, and SER. EBOF is significant at less than 1% level and supports hypothesis 2 which states that the level of ethical behaviour of firms in a country influences its strength of auditing and reporting standards. FMS is also significant at less than 1% level. This result empirically supports hypothesis 4 which posits that financial market sophistication is associated with a country’s strength of auditing and reporting standards. Hypothesis 6 is also supported by data since SER is significant at less than 1% level. Thus we can conclude that the quality of stock exchange regulations in a country affects the strength of auditing and reporting standards.
However, for several variables the Variance Inflation Factor (VIF) exceeds the critical threshold of 5.0. Thus multicollinearity may be clouding our results. We therefore conduct univariate regressions taking one independent variable at a time. These regressions are reported in Panel B of Table 3. Our empirical results indicate that all the independent variables are highly statistically significant, thereby supporting all our six hypotheses. Overall, these results confirm that the efficiency of legal framework, the level of ethical behaviour, the efficacy of corporate boards, the level of financial sophistication, the level of local equity financing, the quality of stock market regulations, the level of higher education and training, and the efficiency of usage of talent in a country play a dominant role in determining a country’s strength of auditing and reporting standards. On the whole, our results support the relevance of institutional infrastructure, financial market development, and the strength of higher education and training in influencing the strength of auditing and reporting standards at the country level.
Prior research has shown that the level of economic development influences the quality of accounting prevalent in a country (Hagigi & Williams 1993; Larson 1993; Radebaugh & Gray, 2002). Hagigi and Williams (1988) state that growth rates and economic development are to some extent connected to the adequacy of the accounting system of a country. Larson
5
This was done by the authors of the WEF report. Typically, when a score lies in the extreme 1% percentile on either side, it is set equal to that value.
6 Following La Porta et al. (2006) we conduct country level regressions.
(1993) used a sample of 36 African countries to show the relationship between economic development and accounting and reporting process. However, past research has also shown that economic development is also strongly correlated with a number of institutional variables.
In order to clearly discern the moderating role of economic development on the relationships between our independent variables and the strength of auditing and reporting standards, we split our sample into three groups based on the stage of economic development (WEF, GCR 2009-2010, pp. 7-12). WEF categorises countries into three stages based on its per capita GDP. A list of the countries categorised by the three stages is provided in Appendix A. Countries with GDP less than USD2,000 per capita are factor driven
economies and labelled as Stage 1 countries. Countries with per capita income levels between USD3,000 and USD9,000 are characterised as efficiency driven economies and comprise the Stage 2 category. Countries with income levels exceeding USD17,000 on a per capita basis are Stage 3 countries and are characterised as innovation driven. We include countries in a state of transition at the lower level of development.
Ostensibly, the stage of development is expected to exert a moderating influence on the role of critical institutional, financial developmental and educational variables in affecting the strength of auditing and reporting standards (Briston 1978; Archambault & Archambault 2003). Archambault and Archambault (2003) suggest that a country has to provide appropriate structures that influence reliable information disclosure according to its level of development. We therefore partition our sample into three groups and rerun our regression tests. These results are contained in Table 4, Panels A, B, and C.
Panel A of Table 4 contains our multivariate regression results for the subsample of Stage 1 countries. Our independent variables explain between 35% and 69% of the variation (adjusted R2) in the strength of auditing and reporting standards. All the variables EBOF, EOLFW, EOCB, HET, FMS, LEMF, SER and ROPM are statistically significant at less than 1% level. All our eight hypotheses are empirically supported. These results confirm that institutional infrastructure, financial market development and higher education and training all play significant roles in shaping a developing country’s strength of auditing and reporting standards.
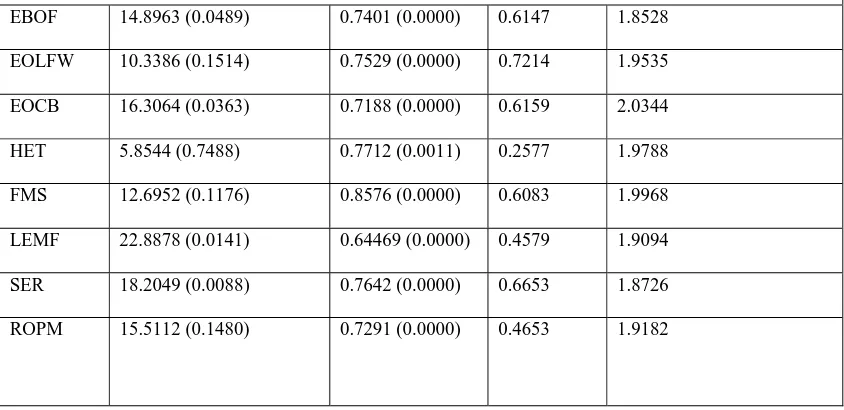
We report our regression results for the subsample of Stage 2 countries in Panel B of Table 4. Our independent variables explain between 26% and 72% of the variation in the strength of auditing and reporting standards. All the variables are highly statistically significant. These results confirm that institutional infrastructure, higher education and training and financial market development explain significantly a middle-income country’s strength of auditing and reporting standards.
We conduct univariate regression tests for the developed countries belonging to Stage 3 and report our results in Panel C of Table 4. Our independent variables explain between 22% and 81% of the variation in the strength of auditing and reporting standards. These results substantiate the view that institutional infrastructure, higher education and training, and financial market development explain significantly a developed country’s strength of auditing and reporting standards.
Although we find empirical support for all our hypotheses, we urge the reader to interpret these results with caution. Firstly, the data used for the project was not specifically collected for our project. We used secondary data collected and disseminated by the World Economic Forum in their report on global competitiveness. Secondly, we cannot infer causality from the results. While we document association, stronger tests are required before one can confirm causality. These tests require panel data covering many years. Since we don’t have such data causality cannot be confirmed.Thirdly, strong multicollinearity between the independent variables precludes us from assessing the marginal impact of each variable. Finally, we cannot rule out the possibility of endogeneity. To properly test for endogeneity, we need to construct instrument variables for each of the independent variables and compute the inverse Mill’s ratio. This would be a stupendous task given that we have included a large number of countries at various stages of development. A likely outcome of this task is that we may lose a substantial section of our sample. As a consequence we may have very few degrees of freedom resulting in lower power of statistical tests.
5.Conclusion
Our study is the first one to examine the determinants of the strength of auditing and reporting standards (SARS) at the global level. We consider SARS as a vital element of institutional transparency that is crucial for businesses, investors and governments. We focus on the role of environmental factors in affecting a country’s strength of auditing and reporting standards. Our empirical work is based on data collected on 133 countries from the 2009-2010 Global Competitiveness Report published by the World Economic Forum. We confirm empirically that institutional infrastructure, financial market development and higher education and training all jointly influence a country’s strength of auditing and reporting standards. In order to examine the moderating role of economic development on the relationships between our independent variables and the strength of auditing and reporting standards, we split our sample into three groups based on the stage of economic development. Our subsample results are qualitatively similar to the results based on the whole sample. Thus we are able to conclude that the three factors studied here—institutional infrastructure, financial market sophistication, and higher education and training—are relevant to countries at all stages of economic development.
References
Adhikari, A & Tondkar, RH 1992, ‘Environmental Factors Influencing Accounting Disclosure Requirements of Global Stock Exchanges’, Journal of International Financial Management and Accounting, vol. 4, no.1, pp. 75-105.
http://dx.doi.org/10.1111/j.1467-646X.1992.tb00024.x
Ang, JS & Ciccone SJ 2001, ‘International differences in analyst forecast properties’, working paper, University of New Hampshire.
Archambault, JJ & Archambault, ME 2003, ‘A multinational test of determinants of
corporate disclosure’, The International Journal of Accounting, vol. 38, no.2, pp. 173-194. http://dx.doi.org/10.1016/S0020-7063(03)00021-9
Ball, R 1995. Making Accounting more international: Why, how, and how far will it go?
Journal of Applied Corporate Finance, vol.8, no.3, pp. 19-29.
http://dx.doi.org/10.1111/j.1745-6622.1995.tb00633.x.
Barth, M, Konchitchki, Y & Landsman, WR 2010, ‘Cost of Capital and Earnings Transparency’, working paper, Stanford University.
Berry, M & Holzer, P 1993, ‘Restructuring the Accounting Function in the Third World’,
Research in Third World Accounting,vol. 2, pp. 225-244.
Black, EL & Carnes, TA 2006, ‘Analysts’ Forecasts in Asian-Pacific Markets: The
Relationship among Macroeconomic Factors, Accounting Systems, Bias and Accuracy’,
Journal of International Financial Management and Accounting, vol.4: pp. 75-105. Briston, RJ 1978, ‘The Evolution of Accounting in Developing Countries’, International
Journal of Accounting, vol.13: pp.18-30.
Chan, K, Chan, LKC, Jegadeesh, N & Lakonishok J 2001, ‘Earnings Quality and Stock Returns: The Evidence from Accruals’, NBER working pape.
Chand, P Pate, C & Day, R 2008, ‘Factors causing differences in the financial reporting practices in selected South Pacific countries in the post-convergence period’, Asian
Academy of Management Journal, vol. 13, no. 2, pp.111-129.
Chen, H, Tang, Q Jiang, Y & Lin, Z 2010, ‘The role of IFRS in accounting quality: Evidence from EU’, Journal of International Financial Management & Accounting, vol.21: no.3, pp. 220- 277. http://dx.doi.org/10.1111/j.1467-646X.2010.01041.x.
David, R & Brierley, JEC 1985, Major Legal Systems in the World Today, London: Stevens. Davis-Friday, PY 2010, Discussion of ‘Financial reporting quality in international settings:A
comparative study of the U.S.A, Japan, Thailand, France and Germany’, International
Journal of Accounting,vol.45: no.2, pp. 35-38.
Doupnik, T & Salter, S 1995, ‘External environment, culture, and accounting practice: A preliminary test of a general model of international accounting development’,
International Journal of Accounting,vol.30: no.1, pp. 189-202
El Ghoul, S, Guedhami, O & Pittman, J 2010, ‘Cross-Country Evidence on the Importance of Big Four Auditors to Equity Pricing: The Mediating Role of Legal Institutions’, working paper, University of Alberta.
Francis, J, LaFond, R, Olsson, P & Schipper, K 2005, ‘The market pricing of accruals quality’, Journal of Accounting and Economics, vol.39:no.2, pp. 295-327.
http://dx.doi.org/10.1016/j.jacceco.2004.06.003.
Frank, J & Mayer, C 1992, ‘Corporate Control: A synthesis of the International Evidence’, working paper of London Business School and University of Warwick.
Gernon, H, Meek, G & Mueller, G 1987, ‘Accounting: An International Perspective’, Homewood, Il: Irwin.
Hagigi, M & Williams, PA 1993, ‘Accounting, Economic and Environmental Influences on Financial Reporting Practices in the Third World: The Case of Morocco’, Research in Third World Accounting, vol. 3, pp. 67-84.
Hail, L & Leuz, C 2006, ‘International Differences in Cost of Equity Capital: Do Legal Institutions and Securities Regulation Matter?’ Journal of Accounting Research, vol.44, no. 3, pp. 485-531. http://dx.doi.org/10.1111/j.1475-679X.2006.00209.x
Hronsky, JJ & Houghton, KA 2001, ‘The meaning of a defined accounting concept: Regulatory changes and the effect on auditor decision making’, Accounting, Organisation and Society, vol. 26, no.2 pp. 123-139.
Jaggi, B & Low, PY 2000, ‘Impact of culture, market forces and legal system on financial disclosures’, International Journal of Accounting, vol. 35, no. 4, pp.495-519.
http://dx.doi.org/10.1016/S0020-7063(00)00076-5
Juchau, R 1978, ‘Accounting practice problems in Papua Guinea and Fiji’, The Australian Accountants, pp. 110-113.
Kenway, P 1994, ‘The Concentration of Ownership and its Implications for Corporate Governance in the Czech Republic’, University of Reading, Discussion papers in Economics, Series A. No. 288.
Kurtzman, J, Yago, G & Phumiwasana, T 2004. ‘The Global Costs of Opacity’, MIT Sloan Management Review, vol.46, no. 1, pp. 38-44.
Labelle, R, Gargoui, RM & Francoeur, C 2010, ‘Ethics, Diversity Management and Financial Reporting Quality’, Journal of Business Ethics, vol. 93, pp. 335-353.
http://dx.doi.org/10.1007/s10551-009-0225-7
La Porta, R, Lopez, de Silanes, F & Shleifer, A 2006, ‘What Works in Securities Laws?’,
Journal of Finance, vol. 61 no. 1, pp. 1-32.
Larson, RK 1993, ‘International Accounting Standards and Economic Growth: An empirical investigation of their relationships in Africa’, Research in Third World Accounting, vol. 2, pp. 27-43.
Leuz, C & Verrecchia, RE 2000, ‘The Economic Consequences of Increased Disclosure’,
Journal of Accounting Research, vol.38, pp. 91–124. http://dx.doi.org/10.2307/2672910
Nobes, CW 1983, ‘A Judgmental International Classification of Financial Reporting Practices’, Journal of Business Finance and Accounting, vol. 10, no.1, pp. 1-19.
Nobes, CW 1992, ‘Classification of Accounting Using Competences as a Discriminating Variable: A Comment’, Journal of Business Finance and Accounting, vol.18, pp.153-155. http://dx.doi.org/10.1111/j.1468-5957.1992.tb00615.x
Nobes, CW 1998, ‘Towards a General Model of the Reasons for International Differences in Financial Reporting’, Abacus, vol.34, no.2, pp. 162-187.
http://dx.doi.org/10.1111/1467-6281.00028
Parker, RH 1989, ‘Importing and Exporting Accounting: the British experience’, in A.G. Hopwood (ed.), International Pressures for Accounting Change, Prentice Hall, London. Parry, M & Grove, R 1990, ‘Does Training More Accountants Raise the Standards of
Accounting in the Third World Countries? A study of Bangladesh’, Research in Third World Accounting, vol. 1, pp.117-140.
Perera, MHB 1989, ‘Towards a framework to analyse the impact of culture on accounting’,
International Journal of Accounting Education and Research, vol. 1 no. 1, pp. 42-56. Radebaugh, LH & Gray, SJ 2002, International Accounting and multinational enterprises,
5th Edition, John Wiley, New York.
Rahman, A, Yammeesri, J & Perera, H 2010, ‘Financial reporting quality in international settings: A comparative study of the U.S.A, Japan, Thailand, France and Germany’
International Journal of Accounting, vol.45, no.1, pp. 1-34.
http://dx.doi.org/10.1016/j.intacc.2010.01.001.
Salter, S & Doupnik, T 1992, ‘The relationship between legal systems and accounting practices: A classification exercise’, Advances in International Accounting, vol. 5 pp. 3-22.
Van de Walle, S 2006, ‘The State of the World’s Bureaucracies’, Journal of Comparative Policy Analysis, 8, pp. 437-448. http://dx.doi.org/10.1080/13876980600971409
Verrecchia, R 2001, ‘Essays on Disclosure’, Journal of Accounting & Economics vol.32, pp. 91– 180. http://dx.doi.org/10.1016/S0165-4101(01)00025-8
WEF 2010, ‘The Global Competitiveness Report 2009-2010’, World Economic
Forum,Geneva, Switzerland.
Wright, DW 1996, ‘Evidence on the relation between corporate governance characteristics and the quality of financial reporting’, Working Paper, (University of Michigan).
Yang, CH & Huang, YJ 1990, ‘Do Intellectual Property Rights Matter to Taiwan’s Exports? A Dynamic Panel Approach’, Pacific Economic Review, vol. 14, pp. 555-578.
http://dx.doi.org/10.1111/j.1468-0106.2009.00460.x
Yee, KK 2006, ‘Earnings Quality and the Equity Risk Premium: A Benchmark Model’,
Contemporary Accounting Research, vol. 23, no. 3, pp. 833-877.
http://dx.doi.org/10.1506/8M44-W1DG-PLG4-8E0M
Appendix A: List of countries by stage of development
Stage 1 Stage 1 to 2 Stage 2 Stage 2 to 3 Stage 3
Bangladesh Benin Bolivia Burkina Faso Burundi Cambodia Cameroon Chad Cote d’Ivoire Ethiopia Gambia, The Ghana Guyana Honduras India Kenya Kyrgyz republic Lesotho Madagascar Malawi Mali Mauritania Mongolia Mozambique Nepal Nicaragua Nigeria Pakistan Philippines Algeria Azerbaijan Botswana Brunei Darussalam Egypt Georgia Guatemala Indonesia Jamaica Kazakhstan Kuwait Libya Morocco Paraguay Qatar Saudi Arabia Syria Venezuela Albania Argentina Armenia Bosnia and Herzegovina Brazil Bulgaria China Colombia Costa Rica Dominican Republic Ecuador El Salvador Jordan Macedonia, FYR Malaysia Mauritius Montenegro Namibia Panama Peru Serbia South Africa Suriname Thailand Tunisia Ukraine Bahrain Barbados Chile Croatia Hungary Latvia Lithuania Mexico Oman Poland Romania Russian Federation Turkey Uruguay Australia Austria Belgium Canada Cyprus Czech republic Denmark Estonia Finland France Germany Greece
Hong Kong SAR
Senegal
Sri Lanka
Tajikistan
Tanzania
Timor-Leste
Uganda
Vietnam
Zambia
Zimbabwe
Spain
Sweden
Switzerland
Taiwan, China
Trinidad and Tobago
United Arab Emirates
United Kingdom
Appendix B: List of Variables
SARS: Strength of auditing and reporting standards refers to the strength of financial auditing and reporting standards in a given country compared to other countries in the sample. This is our dependent variable.
EBOF: Ethical behaviour of firms compares corporate ethics (ethical behaviour in interactions with public officials, politicians, and other enterprises) of firms in one country with firms of other countries in the world.
EOLFW: Efficiency of legal framework in challenging regulations refers to how efficient the legal framework for private businesses is in challenging the legality of government actions and/or regulations.
EOCB: Efficacy of corporate boards refers to the characteristics of corporate governance based on corporate governance pertaining to boards of directors in a country.
HET: Higher education and tertiary enrolment refers to the gross tertiary education enrolment rate in a country (hard data).
FMS: Financial market sophistication refers to how sophisticated the financial market is in a country.
LEMF: Financing through local equity market refers to the ease with which money is raised by issuing shares on the stock market in a country.
SER: Securities exchange regulations refer to the assessment of regulation of securities exchange of a country.
Table 1: Descriptive Statistics of Variables
Statistical measures
Variables
SARS EBOF EOLFW EOCB HET FMS LEMF SER ROPM Mean 67.466 66.98 67.51 67.00 72.37 67.08 67.09 67.53 67.18 Median 68.00 67.00 67.00 67.00 79.00 67.00 67.00 67.00 67.50 Maximum 133.00 133.00 133.00 133.00 130.00 133.00 133.00 133.00 133.00 Minimum 1.00 1.00 1.00 1.00 5.00 1.00 1.00 1.00 1.00 Std. Dev. 38.73 38.59 38.87 38.54 35.145 38.58 38.5877 38.80 38.63 Skewness -0.0104 0.0059 -0.0151 -3.00E-16 -0.3852 -0.0039 -0.0047 -0.0216 -0.0123
Kurtosis 1.8064 1.7955 1.7733 1.7998 2.0534 1.7934 1.7926 1.7688 1.7959 Jarque-Bera 7.8967 8.0397 8.3435 7.9818 8.25603 8.0687 8.0792 8.4102 7.9774
Notes: The sample size is133. SARS (strength of auditing and reporting) is the dependent variable. EBOF (ethical behaviour of firms), EOLFW (Efficiency of legal framework), EOCB (efficacy of corporate boards), HET (higher education and training), FMS (financial market sophistication), LEMF (financing through local equity market), SER (securities exchange regulations) and ROPM (reliance on professional management) are the independent variables.
Table 2: Correlation Matrix
SARS EBOF EOLFW EOCB HET FMS LEMF SER
SARS
EBOF 0.8600
EOLFW 0.7924 0.8543
EOCB 0.8160 0.7595 0.7006
HET 0.7981 0.7508 0.6561 0.7157
FMS 0.8937 0.7860 0.7082 0.7616 0.7667
LEMF 0.6627 0.5439 0.5661 0.6006 0.5149 0.6744
SER 0.8708 0.7442 0.7182 0.7467 0.7198 0.8752 0.7772
ROPM 0.8481 0.7747 0.6951 0.8884 0.8067 0.8215 0.6226 0.7778
[image:18.612.94.504.349.505.2]
Table 3: Regression Analysis for Whole Sample
Panel A: Multivariate Regression Results
Coefficient P-value VIF R2 DW statistic for AR(1)
Constant -3.5818 0.2066 0.8959 2.0183
Variables EBOF 0.2133 0.0030 5.6196 EOLFW 0.0839 0.1101 4.0191 EOCB 0.0808 0.2355 5.2376
HET 0.0861 0.1534 3.4573
FMS 0.2569 0.0006 5.9729
LEMF -0.0049 0.9178 2.6368
SER 0.2464 0.0013 6.4079
ROPM 0.0884 0.2739 7.3833
Panel B: Univariate Regression Results
Variables Constant (P-value) Slope (P-value) R2 DW statistic for AR(1) EBOF 11.1249 (0.0047) 0.8353 (0.0000) 0.7213 2.0086
EOLFW 21.3812 (0.0000) 0.6593 (0.0000) 0.7185 2.1992 EOCB 19.7981 (0.0000) 0.6939 (0.0000) 0.6792 2.1095 HET 1.3119 (0.7665) 0.8948 (0.0000) 0.6627 1.9793 FMS 7.3169 (0.0188) 0.8957 (0.0000) 0.7894 1.9974 LEMF 32.0274 (0.0000) 0.4962 (0.0000) 0.5428 2.3110 SER 11.1911 (0.0029) 0.8181 (0.0000) 0.7716 2.0103 ROPM 13.3316 (0.0011) 0.7937 (0.0000) 0.7284 2.0521
Table 4: Univariate Regression Analysis for Stages 1, 2 and 3 Countries
Variables Constant (P-value) Slope (P-value) R2 DW statistic for AR(1)
Panel A: Stage 1 Countries Regression Results
EBOF 31.2643 (0.0029) 0.6890 (0.0000) 0.4810 1.9691
EOLFW 49.2459 (0.0000) 0.5055 (0.0000) 0.3526 2.0037
EOCB 37.6166 (0.0000) 0.6369 (0.0000) 0.5313 1.9906
HET 1.3435 (0.9190) 0.9342 (0.0000) 0.4845 1.9967
FMS 9.2309 (0.2875) 0.8779 (0.0000) 0.6898 1.9308
LEMF 58.9573 (0.0000) 0.4037 (0.0000) 0.4069 2.0296
SER 28.0365 (0.0026) 0.6887 (0.0000) 0.5940 1.8840
ROPM 20.1469 (0.2464) 0.8691 (0.0000) 0.5216 1.9540
Panel B: Stage 2 Countries Regression Results
EBOF 14.8963 (0.0489) 0.7401 (0.0000) 0.6147 1.8528
EOLFW 10.3386 (0.1514) 0.7529 (0.0000) 0.7214 1.9535
EOCB 16.3064 (0.0363) 0.7188 (0.0000) 0.6159 2.0344
HET 5.8544 (0.7488) 0.7712 (0.0011) 0.2577 1.9788
FMS 12.6952 (0.1176) 0.8576 (0.0000) 0.6083 1.9968
LEMF 22.8878 (0.0141) 0.64469 (0.0000) 0.4579 1.9094
SER 18.2049 (0.0088) 0.7642 (0.0000) 0.6653 1.8726
Panel C: Stage 3 Countries Regression Results
EBOF 10.03109 (0.0171) 0.6292 (0.0000) 0.6055 2.0179
EOLFW 9.1045 (0.0122) 0.5618 (0.0000) 0.8081 2.1679
EOCB 11.0293 (0.0151) 0.4833 (0.0000) 0.4467 1.9485
HET 3.5863 (0.4417) 0.8242 (0.0000) 0.4876 1.9918
FMS 7.2234 (0.1411) 0.7979 (0.0000) 0.4677 1.6438
LEMF 11.5799 (0.0872) 0.3754 (0.0051) 0.2209 2.0095
SER 2.6030 (0.4927) 0.7782 (0.0000) 0.6770 1.9235
ROPM 12.1895 (0.0074) 0.5460 (0.0000) 0.4896 1.9741
Notes: SARS (strength of auditing and reporting) is the dependent variable. EBOF (ethical behaviour of firms), EOLFW (Efficiency of legal framework), EOCB (efficacy of corporate boards), HET (higher education and training), FMS (financial market sophistication), LEMF (financing through local equity market), SER (securities exchange regulations) and ROPM (reliance on professional management) are the independent variables.
Sample size of Stage 1, 2 and 3 countries is 56, 40 and 37, respectively. The list of countries categorised by stage of