Area Analysis of Child Deprivation 2014 (WIMD Indicators 2014)
1This Statistical Article provides an Area Analysis of Child Deprivation in Wales, using some of the
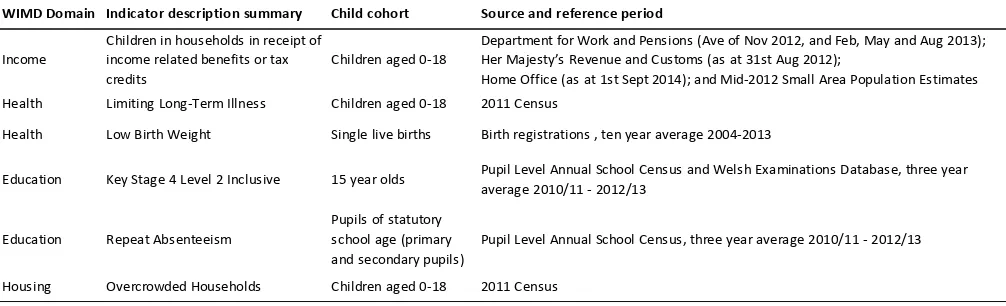
[image:1.595.43.546.289.442.2]indicators underlying the Welsh Index of Multiple Deprivation (WIMD) 2014. It provides summary maps and analysis for 6 different indicators for Lower Super Output Areas (LSOAs). The indicators cover the WIMD domains of: Income, Health, Education and Housing, and are described in the table below. There is also some distributional analysis of how the child population is spread across areas with differing deprivation according to WIMD, and for each of the Community Safety, Access to Services, and Physical Environment domains.
Table of Indicators
WIMD Domain Indicator description summary Child cohort Source and reference period
Income
Children in households in receipt of income related benefits or tax credits
Children aged 0-18
Department for Work and Pensions (Ave of Nov 2012, and Feb, May and Aug 2013); Her Majesty’s Revenue and Customs (as at 31st Aug 2012); Home Office (as at 1st Sept 2014); and Mid-2012 Small Area Population Estimates
Health Limiting Long-Term Illness Children aged 0-18 2011 Census
Health Low Birth Weight Single live births Birth registrations , ten year average 2004-2013
Education Key Stage 4 Level 2 Inclusive 15 year olds Pupil Level Annual School Census and Welsh Examinations Database, three year average 2010/11 - 2012/13
Education Repeat Absenteeism
Pupils of statutory school age (primary and secondary pupils)
Pupil Level Annual School Census, three year average 2010/11 - 2012/13
Housing Overcrowded Households Children aged 0-18 2011 Census
Contents
1. Background ... 2
2. Summary ... 3
3. Income deprivation indicator... 5
4. Limiting long-term illness indicator ... 13
5. Low birth weight indicator ... 19
6. Key Stage 4 level 2 inclusive indicator ... 24
7. Repeat absenteeism indicator ... 30
8. Overcrowded households indicator ... 36
9. Distributional analysis of children across deprivation groups for WIMD 2014 domains... 42
10. Further Information ... 43
11. Notes on the use of statistical articles ... 44
Date of Publication: 1 December 2015 Next update: Not a regular output
Statistician: Nia Jones, Social Justice Statistics, Knowledge and Analytical Services E-mail: statsinclusion@wales.gsi.gov.uk
Telephone: 029 2082 3371
Twitter: www.twitter.com/statisticswales | www.twitter.com/ystadegaucymru
1
1. Background
This Article provides a picture of child deprivation for small areas across a small set of key indicators, both relative to other areas, and also showing actual levels such as rates of children reporting Limiting Long-Term Illness. Its possible uses include area profiling and resource allocation, as well as providing a general picture of how deprivation levels of children vary across Wales and between the different indicators. It is intended as the first in a series of Articles accompanying the annual Indicator data, and we welcome feedback on topics to cover, content and format of the Articles.
Alongside the Article we have published new data on StatsWales for a range of age groups (including some finer detail for children e.g. ages 0-4) and also other indicators such as rates of unemployment-related benefit claimants, and people with no qualifications.
We have also published a guidance article for users of WIMD Indicator data, which provides a guide to what indicator data has been published, how to access it, “do's and don'ts” for analysis, how well indicator data can be combined for comparisons overtime and links to existing analysis.
This package of outputs replaces plans to update the Child Index with information and analysis which will be more useful and relevant to users. These new outputs will support analysis of deprivation of children (and other age groups), allowing some analysis over time, comparisons between areas beyond a simple ranking, and potential future addition of other useful indicators not included in the main Index. Previous WIMD Child Indices have been cut-down versions of the full Index, including selected indicators which are relevant to children. They did not necessarily include the best available indicators of child deprivation. Responses to our overall WIMD 2014 consultation showed only limited use of the previous Child Indices, and the majority of respondents agreed with prioritising analysis of the WIMD indicator data.
This analysis relies on administrative data and Census data. At a small area level and for specific age groups numbers can be low, which can lead to rates showing large fluctuations given relatively small changes in the underlying population. Some sections of this Article include counts of children (rather than indicator rates) as contextual information, and whilst the counts are not in general published on StatsWales, we have provided links to further information where possible. However these “indicator counts” may also be small and in some cases suppressed due to the potential for disclosure. Care should therefore be taken in interpreting the data.
2. Summary
2.1 Child deprivation for Wales as a whole
Children are more likely to live in households in income deprivation (27 per cent) compared to the overall population (17 per cent).
Children had lower levels of limiting long term illness (4,615 per 100,000) compared to the overall population (22,715 per 100,000).
The percentage of babies born with a low birth weight was 5.6 per cent.
The percentage of 15 year olds achieving the Key Stage 4 level 2 inclusive indicator was 51.8 per cent.
The percentage of repeat absenteeism for school aged children was 9.9 per cent.
Children are more likely to live in overcrowded households (9.2 per cent) than the overall population (5.5 per cent).2.2 Distribution of children across deprived areas
As would be expected, there is a relationship between overall WIMD 2014 deprivation and the deprivation distribution of children for all the indicators within the article. This relationship is strongest for the income deprivation indicator, followed by the two education-related indicators. However for each of the six indicators for children, at least one area in the least deprived 50%
according to WIMD 2014 showed relatively high deprivation against that child indicator. That is, some areas in the least deprived half overall still had relatively high rates of deprived children in terms of income, education, health or overcrowded households.
The indicator with the strongest geographical concentration of child deprivation was the income deprivation indicator (25.7 per cent of income deprived children are concentrated in the 10% most deprived LSOAs), followed by the overcrowded households indicator (22.2 per cent of children in overcrowded households are concentrated in the 10% most deprived LSOAs). Using population estimates for small areas we can examine the share of all children living in the
most deprived areas in Wales. Using the overall WIMD 2014 ranks, 12 per cent of children live in the top 10% most deprived areas. Equivalent shares were 10.6 per cent for the community safety domain, and 11.1 per cent for the physical environment domain.
Similar analysis for the access to services domain shows a slightly lower concentration of children living in the most deprived 10% of LSOAs than would be expected if spread equally between LSOAs (9.3 per cent).
2.3 Analysis of most deprived Local Authorities
Cardiff, Blaenau Gwent and Merthyr Tydfil had the highest or second highest proportions of their LSOAs within the 10% most deprived LSOAs for 3 of the 6 indicators each. For Rhondda Cynon Taf the same was true for 2 of the 6 indicators.
Powys had no LSOAs in the 10% most deprived for 3 of the 6 indicators, and Monmouthshire for 2 of the 6 indicators.
Although Cardiff had a large proportion of its LSOAs within the 10% most deprived LSOAs for multiple indicators, it showed the most dispersed pattern of deprivation. That is, the rates for its middle half of LSOAs (the Inter-Quartile range) are spread across a relatively wide range for multiple indicators. This was also the case to a lesser extent in many indicators for other major urban areas (e.g. Swansea, Newport and Wrexham).
Blaenau Gwent had its middle half of LSOAs spread across the narrowest range of values for multiple indicators (3 of the 6), suggesting a condensed pattern of deprivation. The Local
Authorities with the narrowest range of values for the other indicators tended to fall within more rural authorities (e.g. Gwynedd and Powys in particular), suggesting less variation in deprivation patterns.
2.4 Analysis of most deprived LSOAs
In general, when mapped the indicators for children show broadly similar patterns of deprivation as the overall WIMD 2014, with pockets of high deprivation in the South Wales valleys and large cities, and in some north Wales coastal towns. The two health-related indicators and the overcrowded households indicator tend to show more areas in mid and West Wales in the more deprived groups than the other three indicators (income deprivation and the two education-related indicators).
The following points focus on the top 10 most deprived LSOAs for each of the six child deprivation indicators included in this Article.
Cardiff has at least 1 of its LSOAs in the top 10 most deprived LSOAs for each indicator. Within Cardiff the Cathays area appears in 4 of the 6 indicators’ top 10 lists, and specifically the LSOAs Cathays 5, 6 and 9 each appear in 2 indicators’ top 10 lists.
Rhondda Cynon Taf, Blaenau Gwent, Bridgend and Newport all have LSOAs in the top 10 most deprived LSOAs for multiple indicators and each have at least 1 LSOA appearing repeatedly (at least twice) for these indicators.
Over a third (8 of the 22) of Local Authorities had no LSOAs appear in the top 10 most deprived LSOAs for any indicator in this article. These were Gwynedd, Flintshire, Powys, Ceredigion,
Carmarthenshire, Torfaen, Merthyr Tydfil and Monmouthshire. The Cardiff Local Authority has 9 of the 10 most deprived LSOAs for child overcrowding, with
three neighbouring LSOAs in Butetown and four other neighbouring LSOAs (Cathays 9, Cathays 6, Cathays 7 and Plasnewydd 4).
3. Income deprivation indicator
The income deprivation indicator is a composite indicator which measures three elements: households with 1) Income-Related Benefit claimants, 2) Tax Credit recipients and 3) Supported Asylum Seekers and the definition is described in further detail below in section 3.5.
3.1 Key results
Children have a higher rate of income deprivation, 27 per cent (which amounted to 177,580 children in households in income deprivation) compared to the overall population, 17 per cent (which amounted to 525,300 individuals in households in income deprivation).
Rates for the middle half (the Inter-Quartile Range) of LSOAs across Wales range from 13 to 35 per cent for this indicator. Powys had the most condensed middle half of LSOA ranges (11-20.5 per cent) compared to Newport which was the most dispersed (12-44.5 per cent), closely followed by Cardiff (11-42.8 per cent).
The child income deprivation indicator follows a similar pattern to that of the overall population in the income domain of WIMD 2014.
In the child income deprivation indicator there were pockets of high deprivation in the south Wales valleys and large cities, and in some north Wales coastal towns.
The Local Authority with the highest proportion of LSOAs in the most deprived 10%in Wales for this indicator was Cardiff (20.1 per cent) followed by Blaenau Gwent (19.1 per cent). Powys had no LSOAs in the most deprived 10% and only 17.7 per cent in the most deprived 50% in Wales. These Local Authorities had similar equivalent proportions for the overall population in the income domain of WIMD 2014.
For the child income deprivation indicator, the most deprived LSOA in Wales was Rhyl West 2, in Denbighshire.
25.7 per cent of children in income deprivation are found in the most deprived 10% of small areas for this indicator. This compares to the equivalent figure of 21.7 per cent of all people in income deprivation.
3.2 Children in households in income deprivation indicator, LSOA analysis
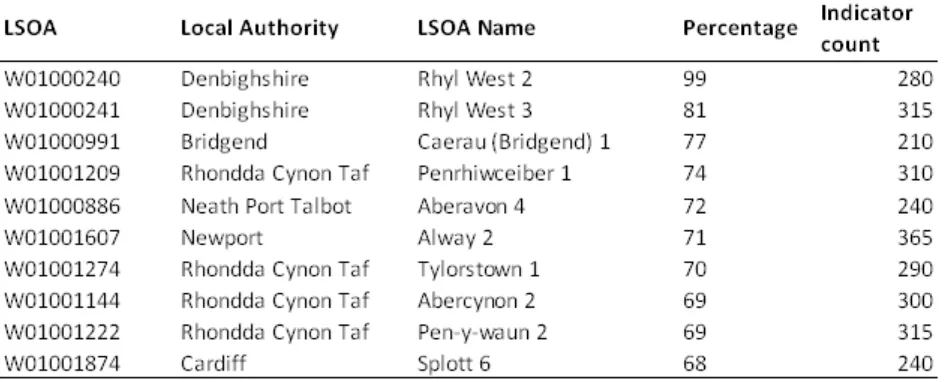
Table 3.1 below shows the top ten most deprived small areas (LSOAs) for income deprivation of those aged 0-18 (percentage). Care should be taken in interpreting these rates as definitive measures of child poverty levels in any given area, and users should note the quality information provided in section 3.5 and footnotes 1.
The LSOA with the highest percentage of children living in households in income deprivation was Rhyl West 2 in Denbighshire, with 99 per cent 2 of children in households in income deprivation. The neighbouring LSOA of Rhyl West 3 had the second highest percentage.
The remaining eight of the ten most deprived LSOAs are found within the south Wales valleys and large cities.
[image:7.595.43.516.304.495.2] Four of the ten most deprived LSOAs are found within the Rhondda Cynon Taf Local Authority.
Table 3.1: Top ten most deprived LSOAs for children in households in income
deprivation
3.3 Distribution of the children in households in income deprivation indicator
The plot overleaf shows the child income deprivation indicator ranks of LSOAs (light blue line) and the WIMD 2014 income domain LSOA ranks for all people (dark blue line) against the percentage of those in income deprivation.
1
Some LSOAs may contain small populations of children, which may lead to unreliable results for the indicator in that LSOA. Mid-2012 population estimates were used as the denominator for this indicator, and are published by the ONS at: http://www.ons.gov.uk/ons/publications/re-reference-tables.html?edition=tcm%3A77-320861
2
The plot shows that there is a similar pattern of distribution between the percentage of children in income deprivation and the wider population. However the percentage of children in income
deprivation is higher than the wider population. At the most deprived end of the distribution there is a steep increase in the percentage of children in income deprivation. The percentage falls by half in the first 148 ranks, from 99 per cent at rank = 1, to 49 per cent at rank = 148.
[image:8.595.58.477.148.459.2]Chart 3.1 Income deprivation indicator distribution
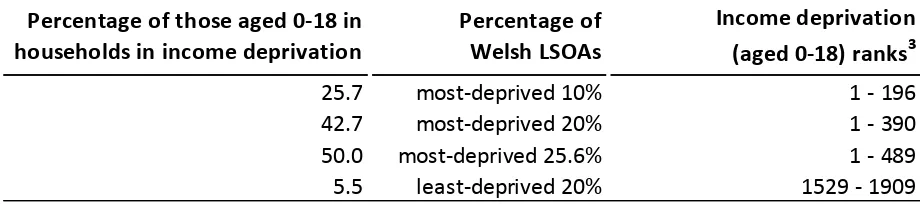
Table 3.2 below relates some numbers to the plot above. Around half of those children in income
deprivation are found in the most-deprived 25.6 per cent of LSOAs in Wales (according to this indicator). More than one in four (25.7 per cent) are found at a rank less than or equal to 196, that is, in the most deprived 10% of areas in Wales3.
Table 3.2: Distribution of children in households in income deprivation
Percentage of those aged 0-18 in households in income deprivation
Percentage of Welsh LSOAs
Income deprivation
[image:8.595.41.501.611.713.2]Chart 3.2 below shows the spread of children in income deprivation (percentage) for each overall WIMD 2014 group described. The blue boxes contain half the total number of LSOAs in each WIMD group, centred on the median (middle) rate for each WIMD group. The lines show the full range of rates in LSOAs for each WIMD group, some LSOAs may contain small numbers of children, leading to possibly unreliable results.
As would be expected, there is a strong relationship between overall WIMD 2014 deprivation and the child income deprivation indicator. The average (median) percentage of children in income deprivation in the 10% most deprived LSOAs in WIMD 2014 was 53 per cent compared to 13 per cent in the 50% least deprived LSOAs in WIMD 2014. There is almost no overlap between the blue boxes (representing the “middle half”) for each group. However each group has at least one LSOA with more than half its children in income deprivation.
Chart 3.2: Percentage of children in households in income deprivation, by WIMD 2014
groups
0 10 20 30 40 50 60 70 80 90 10010% most deprived 10-20% most deprived 20-30% most deprived 30-50% most deprived 50% least deprived
Overall WIMD 2014 Group
In co m e d ep ri va ti o n -a g ed 0 -1 8 ( p er cen ta g e)
3.4 Children in households in income deprivation indicator, Local Authority analysis
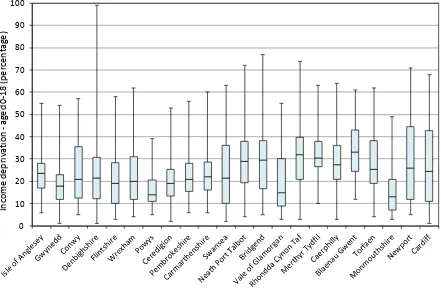
Chart 3.3 overleaf shows the spread of percentagesofchildren in households in income deprivation for each Local Authority in Wales. The blue boxes contain half the total number of LSOAs in each Local Authority, centred on the median (middle) rate for each Local Authority. The lines show the full range of rates in LSOAs for each Local Authority, some of these LSOAs may contain small numbers of children, leading to possibly unreliable results.
Chart 3.3: Percentage of children in households in income deprivation, by Local
Authority
0 10 20 30 40 50 60 70 80 90 100 In co me d e p ri va ti o n -a ge d 0 -1 8 (p e rc e n ta ge )Table 3.3 overleaf shows for the child income deprivation indicator, the percentage of small areas (LSOAs) in each Local Authority which were in each of the following cumulative groups: the most deprived 10%, 20%, 30%and 50% of LSOAs in Wales. This analysis can be seen as identifying the concentration of the most deprived areas in a Local Authority, rather than an average level of deprivation.
The Local Authority with the highest proportion of LSOAs in the most deprived 10% in Wales for child income deprivation was Cardiff (20.1 per cent) followed by Blaenau Gwent (19.1 per cent). Both had a similar equivalent proportion for the overall population in the income domain of WIMD 2014.
Powys had no LSOAs in the most deprived 10% and only 17.7 per cent in the most deprived 50%in Wales. This was again similar to the overall population in the income domain of WIMD 2014.
Table 3.3: Distribution of LSOAs by child income deprivation, within Local Authorities
Local authority
Number of LSOAs in local
authority
% LSOAs with the 10% highest rates
(46 - 99%)
% LSOAs with the 20% highest rates
(37 - 99%)
% LSOAs with the 30% highest rates
(31 - 99%)
% LSOAs with the 50% highest rates
(22 - 99%)
Isle of Anglesey 44 11.4 13.6 18.2 54.5
Gwynedd 73 4.1 4.1 6.8 31.5
Conwy 71 8.5 21.1 31.0 43.7
Denbighshire 58 12.1 17.2 24.1 48.3
Flintshire 92 1.1 8.7 18.5 38.0
Wrexham 85 4.7 12.9 23.5 42.4
Powys 79 0.0 2.5 10.1 17.7
Ceredigion 46 2.2 6.5 8.7 30.4
Pembrokeshire 71 4.2 7.0 19.7 40.8
Carmarthenshire 112 2.7 10.7 19.6 46.4
Swansea 148 12.2 23.6 33.8 47.3
Neath Port Talbot 91 13.2 26.4 40.7 67.0
Bridgend 88 12.5 26.1 42.0 63.6
Vale of Glamorgan 79 5.1 13.9 20.3 38.0
Rhondda Cynon Taf 154 13.0 28.6 50.6 72.7
Merthyr Tydfil 36 16.7 30.6 44.4 83.3
Caerphilly 110 10.0 22.7 35.5 70.0
Blaenau Gwent 47 19.1 42.6 55.3 83.0
Torfaen 60 18.3 26.7 38.3 63.3
Monmouthshire 56 1.8 1.8 8.9 21.4
Newport 95 17.9 35.8 44.2 54.7
Cardiff 214 20.1 33.2 42.5 52.3
Wales 1909 10.0 20.0 30.0 50.0
3.5 Children in households in income deprivation indicator background information
Definition
The indicator on income is a composite indicator which contains three elements: 1) Income-Related Benefit claimants, 2) Tax Credit recipients and 3) Supported Asylum Seekers. The indicator sums claimants and their dependents for the three elements, then expresses the sum as a percentage of the total residential population for each LSOA, based on Mid-2012 Small Area Population Estimates (from the Office for National Statistics). The counts are of unique individuals (i.e. those who claim multiple benefits are only counted once). For this article, the indicator is restricted to those aged 0-18 years old.
Income-Related Benefit claimants are defined as including Income Support claimants, Jobseekers Allowance claimants, Pension Credit claimants, and Income Based Employment and Support Allowance claimants and collected for the average of the individuals who were in receipt of these benefits during November 2012, February 2013, May 2013, and August 2013.
median income for Wales (Before Housing Costs) and collected for those in receipt of tax credits at 31 August 2012.
Supported Asylum Seekers data includes those who were supported under Section 95, at 1 September 2014.
Comparability over time
There were no methodological changes in the income domain between WIMD 2011 and WIMD 2014. However, recent changes to the welfare system mean that eligibility thresholds and criteria for some benefits have changed. This means that the indicator data will not be strictly comparable with earlier years.
Indicator data on children in households in income deprivation were published for 2011, 2012 and 2013 on StatsWales. The definition of “child” used for these years was slightly different from the 2014
indicator data. Data for these years define children as dependent children (within a claimant’s family) aged 0-19, which for 16-19 year olds means they are in full time education. However for 2014 the data on claimants and their dependents is simply split by age, and for this article we refer to all those aged 0-18 as children.
We have not included analysis of children in income deprivation over time in this article due to the changes to the welfare system and the definition of “child” mentioned above. However, although care should be taken in interpreting absolute changes in rates, it is still possible to analyse relative changes over time. For example, to compare relative deprivation between 2011 and 2014 users can group LSOAs into deciles according to the relevant indicator data, and look at those areas which have moved up or down deciles. So an area moving from the third decile (20-30% most deprived) in 2011 to the first decile (10% most deprived) in 2014 would have worsened in terms of its relative child income deprivation.
Data Quality note
The WIMD income deprivation indicator uses administrative data combined with population estimates to provide estimates of rates of relative low income. There is an alternative small area poverty measure for children produced by the Child Poverty Unit within HMRC, called the Children in Low Income Families measure. It is similar (but not identical) in its use of benefit and tax credit claimant counts as a
numerator, but the denominator used is different. HMRC use the counts of children derived from Child Benefit datasets. Both measures rely on the accuracy of several administrative systems, and (for WIMD) the accuracy of the ONS’ Small Area Population Estimates for 0-18 year olds. Users are advised to be mindful of the potential quality issues, especially when using data for narrower (e.g. 5 year) age bands, and when using absolute values. In interpreting the WIMD indicator data at a local level, it is
recommended that users seek other sources of evidence and use local knowledge to corroborate findings. Notes provided in the HMRC report apply equally to the WIMD indicator data:
4. Limiting long-term illness indicator
The limiting long-term illness indicator measures the number of people who selected the responses “Yes, limited a lot” and “Yes, limited a little” in the 2011 Census and is discussed in further detail below in section 4.5.
4.1 Key results
Children have a much lower rate of limiting long-term illness, 4,615 per 100,000 (which amounted to just under 31,000 children in Wales with limiting long-term illness) compared to the rate of the overall population, 22,715 per 100,000 (which amounted to just under 696,000 people in Wales with limiting long-term illness).
Rates for the middle half (the Inter-Quartile Range) of LSOAs across Wales range from 3,315 to 5,665 per 100,000 for this indicator. Blaenau Gwent had the most condensed middle half of LSOA ranges (3,696-5,388 per 100,000) compared to Vale of Glamorgan which was the most dispersed (2,359-5,595 per 100,000).
Broadly speaking the child limiting long-term illness indicator follows a similar pattern to that of the overall population in the Health domain of WIMD 2014.
In the limiting long-term illness indicator amongst children there were pockets of high
deprivation in the south Wales valleys and large cities, and in some north Wales coastal towns.
The Local Authority with the highest proportion of its LSOAs in the most deprived 10% in Wales for this indicator was Neath Port Talbot (28.6 per cent). This was considerably higher than the equivalent figure (17.6 per cent) for the area in the overall Health domain of WIMD 2014. Gwynedd and Monmouthshire had no LSOAs in the most deprived 10%.
For the limiting long-term illness indicator amongst children, the most deprived LSOA in Wales was Cathays 5, in Cardiff4.
17.7 per cent of children with limiting long-term illness are found in the most deprived 10% of small areas for this indicator (the LSOAs ranked 1–191).
Around half of those children with limiting long-term illness are concentrated in the most deprived 34.2 per cent of LSOAs for the indicator.
4
Some LSOAs may contain small populations of children, which may lead to unreliable results for the indicator in that LSOA e.g. Cathays 5 in Cardiff, which contained only 97 children. Census 2011 population estimates were used as the denominator for this indicator, and are published by the ONS at: http://www.ons.gov.uk/ons/about-
4.2 Limiting long-term illness indicator amongst children LSOA analysis
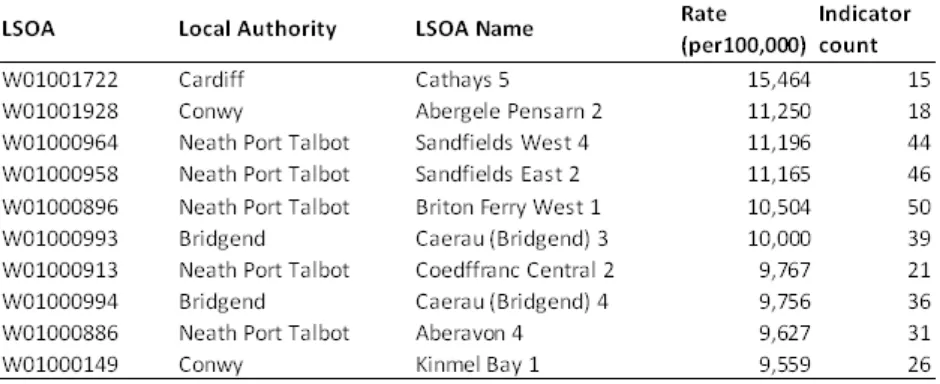
Table 4.1 below shows the rate of the top ten most deprived small areas (LSOAs) for limiting long-term illness amongst those aged 0-18 (per 100,000) 4:
The most deprived LSOA for limiting long-term illness amongst children was Cathays 5 in Cardiff, with a rate of 15,464 per 100,000. However this LSOA did contain a small population of children (97), which may have a disproportionate effect on the indicator.
Five of the ten most deprived LSOAs are found within the Neath Port Talbot Local Authority, two of which are neighbouring LSOAs (Sandfields West 4 and East 2).
[image:15.595.44.514.274.466.2] Eight of the ten most deprived LSOAs are found within south Wales. The remaining two are found in Conwy in the north of Wales.
Table 4.1: Top ten most deprived LSOAs for children with limiting long-term illness
14.3 Distribution of the limiting long-term illness indicator for children
[image:15.595.40.503.613.716.2]Table 4.2 below shows around half of those children with limiting long-term illness are found in the most-deprived 34.2 per cent of LSOAs in Wales, according to this indicator. Nearly one in five (17.7 per cent) are found at a rank less than or equal to 191, that is, in the most deprived 10% of areas in Wales.
Table 4.2: Distribution of children with limiting long-term illness
Percentage of those aged 0-18 with Limiting long term illness
Percentage of Welsh LSOAs
Limiting long term illness ranks (aged 0-18)
17.7 most-deprived 10% 1 - 191
32.2 most-deprived 20% 1 - 382
50.0 most-deprived 34.2% 1 - 652
Chart 4.1 below shows the spread of child limiting long-term illness ratesfor each WIMD 2014 group described. The blue boxes contain half the total number of LSOAs in each WIMD group, centred on the median (middle) rate for each WIMD group. The lines show the full range of rates in LSOAs for each WIMD group, some of these LSOAs may contain small numbers of children, leading to possibly unreliable results.
There is a relationship between overall WIMD 2014 deprivation and the limiting long-term illness indicator. The average (median) limiting long-term illness rate for children in the 10% most deprived LSOAs in WIMD 2014 was 6,280 per 100,000 compared to 3,626 per 100,000 in the 50% least deprived LSOAs in WIMD 2014.
Chart 4.1: Rate of children with limiting long-term illness, by WIMD 2014 groups
0 2,000 4,000 6,000 8,000 10,000 12,000 14,000 16,000
10% most deprived 10-20% most deprived 20-30% most deprived 30-50% most deprived 50% least deprived Overall WIMD 2014 Group
Li m it in g lo ng t er m il ln es s -ag ed 0 -1 8 (r at e per 1 00 ,0 00 )
4.4 Limiting long-term illness indicator amongst children Local Authority analysis
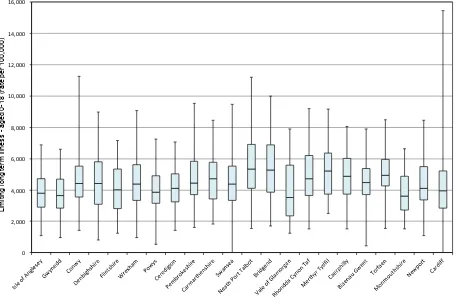
Chart 4.2 overleaf shows the spread of limiting long-term illness ratesfor each Local Authority in Wales. The blue boxes contain half the total number of LSOAs in each Local Authority, centred on the median (middle) rate for each Local Authority. The lines show the full range of rates in LSOAs for each Local Authority, some of these LSOAs may contain small numbers of children, leading to possibly unreliable results.
Chart 4.2: Child limiting long-term illness rates, by Local Authority
0 2,000 4,000 6,000 8,000 10,000 12,000 14,000 16,000
Li
m
iti
ng
lo
ng
te
rm
il
ln
es
s
-ag
ed
0
-1
8
(ra
te
p
er
10
0,
00
[image:17.595.54.509.63.360.2]0)
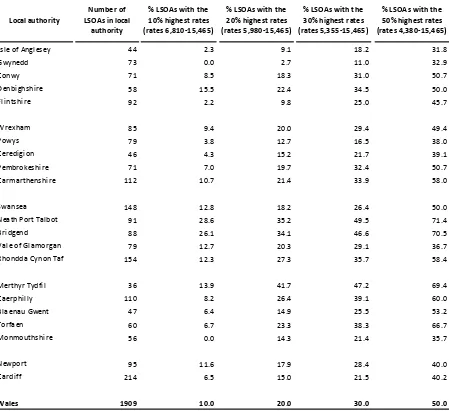
Table 4.3 overleaf shows for limiting long-term illness rates, the percentage of small areas (LSOAs) in each Local Authority which were in each of the following cumulative groups: the most deprived 10%, 20%, 30% and 50% of LSOAs in Wales. This analysis can be seen as identifying the concentration of the most deprived areas in a Local Authority, rather than an average level of deprivation.
The Local Authority with the highest proportion of LSOAs in the most deprived 10% in Wales for limiting long-term illness was Neath Port Talbot (28.6 per cent) followed by Bridgend (26.1 per cent).
Gwynedd and Monmouthshire had no LSOAs in the most deprived 10%. Only 31.8 per cent of the LSOAs in the Isle of Anglesey were in the most deprived 50% in Wales.
Table 4.3: Distribution of LSOAs by child limiting long-term illness, within Local
Authorities
Local authority
Number of LSOAs in local
authority
% LSOAs with the 10% highest rates (rates 6,810-15,465)
% LSOAs with the 20% highest rates (rates 5,980-15,465)
% LSOAs with the 30% highest rates (rates 5,355-15,465)
% LSOAs with the 50% highest rates (rates 4,380-15,465)
Isle of Anglesey 44 2.3 9.1 18.2 31.8
Gwynedd 73 0.0 2.7 11.0 32.9
Conwy 71 8.5 18.3 31.0 50.7
Denbighshire 58 15.5 22.4 34.5 50.0
Flintshire 92 2.2 9.8 25.0 45.7
Wrexham 85 9.4 20.0 29.4 49.4
Powys 79 3.8 12.7 16.5 38.0
Ceredigion 46 4.3 15.2 21.7 39.1
Pembrokeshire 71 7.0 19.7 32.4 50.7
Carmarthenshire 112 10.7 21.4 33.9 58.0
Swansea 148 12.8 18.2 26.4 50.0
Neath Port Talbot 91 28.6 35.2 49.5 71.4
Bridgend 88 26.1 34.1 46.6 70.5
Vale of Glamorgan 79 12.7 20.3 29.1 36.7
Rhondda Cynon Taf 154 12.3 27.3 35.7 58.4
Merthyr Tydfil 36 13.9 41.7 47.2 69.4
Caerphilly 110 8.2 26.4 39.1 60.0
Blaenau Gwent 47 6.4 14.9 25.5 53.2
Torfaen 60 6.7 23.3 38.3 66.7
Monmouthshire 56 0.0 14.3 21.4 35.7
Newport 95 11.6 17.9 28.4 40.0
Cardiff 214 6.5 15.0 21.5 40.2
Wales 1909 10.0 20.0 30.0 50.0
4.5 Limiting long-term illness indicator background information
The limiting long-term illness indicator measures the number of people with a limiting long-term illness per 100,000 people (i.e. in the 2011 Census the responses “Yes, limited a lot” and “Yes, limited a little”), and is based on 2011 Census data (from the ONS). The question relating to limiting long-term illness was altered between the 2011 and 2001 Censuses. Therefore comparisons cannot be made directly with older data. For further information on analysis over time please see section 3.5 and Guidance Article.
In 2001 the question asked “Do you have any long-term illness, health problem or disability which limits your daily activities or the work you can do?” and the available responses were “Yes” or “No”.
5. Low birth weight indicator
The low birth weight indicator measures the percentage of live single births (that is, excluding twins and other multiple births) where the birth weight is less than 2.5 Kg and is discussed in further detail below in section 5.5.
Please note, this section on low birth weight is shortened compared to other sections within this Article. This is due to the suppression of large numbers of LSOAs (364 of 1909) due to the potential for
disclosure. The supressed LSOAs all fall within the least deprived quintile, therefore the analysis within this section should be treated with caution.
5.1 Key results
The percentage of babies born with a low birth weight was 5.6 per cent, which amounted to nearly 19,000 babies in Wales Rates for the middle half of LSOAs (the Inter-Quartile Range) across Wales range from 3.9 to 6.9 per cent for this indicator. Blaenau Gwent had the most condensed middle half of LSOA ranges (5.6-7.6 per cent) compared to Merthyr Tydfil which was the most dispersed (4.4-8.2 per cent).
In the low birth weight indicator high levels of deprivation were found in the south Wales valleys and large cities.
Broadly speaking the low birth weight indicator follows a similar pattern to that of the overall population in the Health domain of WIMD 2014 and the limiting long-term illness indicator in this article (though there was not the same concentration of deprivation in the Neath Port Talbot and Bridgend Local Authorities as in the limiting long-term illness indicator).
The Local Authority with the highest proportion of LSOAs in the most deprived 10% in Wales for this indicator was Merthyr Tydfil (25.0 per cent) followed by Rhondda Cynon Taf (21.4 per cent). These Local Authorities also had the highest proportion of LSOAs in the most deprived 10% in the Health domain of WIMD 2014.
For the low birth weight indicator, the most deprived LSOA in Wales was Cathays 6 in Cardiff 5, with a percentage of 13.6. The neighbouring LSOA Cathays 5 was the most deprived LSOA for the other health indicator analysed in this article (limiting long-term illness).
18.4 per cent of those born with a low birth weight are found in the most deprived 10% of small areas for this indicator (the LSOAs ranked 1–191).
Around half of those born with a low birth weight are concentrated in the most deprived 32.1 per cent of LSOAs for the indicator, compared to 34.2 per cent for limiting long-term illness. Thus deprivation for low birth weight is slightly more concentrated than deprivation for limiting long-term illness.
5
5.2 Low birth weight indicator, LSOA analysis
Table 5.1 below shows the rate of the top ten most deprived small areas (LSOAs) for low birth weight (percentage):
The most deprived LSOA for those born with a low birth weight was Cathays 65
in Cardiff, with a percentage of 13.6.
Four of the ten most deprived LSOAs are found in the urban Local Authorities of Cardiff and Newport in south Wales.
Three others of the ten most deprived LSOAs are found in the Rhondda Cynon Taf Local Authority.
Nine of the ten most deprived LSOAs are found in south Wales.
[image:21.595.45.514.307.498.2] Within the top ten most deprived LSOAs, two of them are neighbouring LSOAs within the Local Authority of Rhondda Cynon Taf (Tylorstown 1 and Tylorstown 2).
Table 5.1: Top ten most deprived LSOAs for babies with a low birth weight
55.3 Distribution of the low birth weight indicator
[image:21.595.41.489.641.744.2]Table 5.2 below shows around half of those born with a low birth weight are found in the most-deprived 32.1 per cent of LSOAs in Wales, according to this indicator. Nearly one in five (18.4 per cent) are found at a rank less than or equal to 191, that is, in the most deprived 10% of areas in Wales.
Table 5.2: Distribution of babies born with a low birth weight
Percentage of those born with a low birth weight
Percentage of Welsh LSOAs
Low birth weight ranks (aged 0-18)
18.4 most-deprived 10% 1 - 191
33.6 most-deprived 20% 1 - 382
50.0 most-deprived 32.1% 1 - 612
5.4 Low birth weight indicator, Local Authority analysis
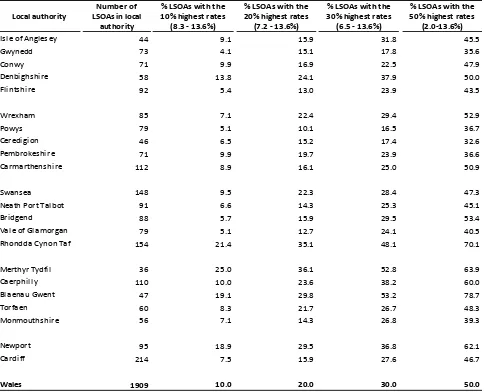
Table 5.3 below shows for the low birth weightindicator, the percentage of small areas (LSOAs) in each Local Authority which were in each of the following cumulative groups: the most deprived 10%, 20%, 30% and 50% of LSOAs in Wales2. This analysis can be seen as identifying the concentration of the most deprived areas in a Local Authority, rather than an average level of deprivation.
The Local Authority with the highest proportion of LSOAs in the most deprived 10% in Wales for those born with a low birth weight was Merthyr Tydfil (25.0 per cent) followed by Rhondda Cynon Taf (21.4 per cent).
[image:22.595.45.529.316.708.2] Blaenau Gwent had the highest proportion of LSOAs in the most deprived 50% in Wales (78.7 per cent). The next highest was again Rhondda Cynon Taf, with 70.1 per cent of its LSOAs in the most deprived half of Wales.
Table 5.3: Distribution of LSOAs by babies born with a low birth weight, within Local
Authorities
6Local authority
Number of LSOAs in local
authority
% LSOAs with the 10% highest rates
(8.3 - 13.6%)
% LSOAs with the 20% highest rates
(7.2 - 13.6%)
% LSOAs with the 30% highest rates
(6.5 - 13.6%)
% LSOAs with the 50% highest rates
(2.0-13.6%)
Isle of Anglesey 44 9.1 15.9 31.8 45.5
Gwynedd 73 4.1 15.1 17.8 35.6
Conwy 71 9.9 16.9 22.5 47.9
Denbighshire 58 13.8 24.1 37.9 50.0
Flintshire 92 5.4 13.0 23.9 43.5
Wrexham 85 7.1 22.4 29.4 52.9
Powys 79 5.1 10.1 16.5 36.7
Ceredigion 46 6.5 15.2 17.4 32.6
Pembrokeshire 71 9.9 19.7 23.9 36.6
Carmarthenshire 112 8.9 16.1 25.0 50.9
Swansea 148 9.5 22.3 28.4 47.3
Neath Port Talbot 91 6.6 14.3 25.3 45.1
Bridgend 88 5.7 15.9 29.5 53.4
Vale of Glamorgan 79 5.1 12.7 24.1 40.5
Rhondda Cynon Taf 154 21.4 35.1 48.1 70.1
Merthyr Tydfil 36 25.0 36.1 52.8 63.9
Caerphilly 110 10.0 23.6 38.2 60.0
Blaenau Gwent 47 19.1 29.8 53.2 78.7
Torfaen 60 8.3 21.7 26.7 48.3
5.5 Low birth weight indicator background information
The indicator on low birth weight measures the percentage of live single births (that is, excluding twins and other multiple births) where the birth weight is less than 2.5 Kg. The data is based on the birth registrations between 2004-2013, published by the ONS. Low birth weight can be linked to the mother’s lifestyle and health, as well as causing problems for the child in later life.
6. Key Stage 4 level 2 inclusive indicator
The Key Stage 4 level 2 inclusive indicator measures the percentage of 15 year olds achieving the equivalent of 5 A*-C grades at GCSE (including Mathematics and English/Welsh) and is discussed in further detail below in section 6.5.
Please note data on other education indicators (including Key Stage 2 average points score and Key Stage 4 capped points score) are available on StatsWales at:
https://statswales.wales.gov.uk/Catalogue/Community-Safety-and-Social-Inclusion/Welsh-Index-of-Multiple-Deprivation/WIMD-Indicator-Analysis/indicatordata-by-lowerlayersuperoutputareas-education
6.1 Key results
The percentage of 15 year olds achieving the Key Stage 4 level 2 inclusive indicator was 51.8 per cent, which amounted to more than 53,000 in Wales over three years Rates for the middle half of LSOAs (the Inter-Quartile Range) across Wales range from 39.4 to 65.2 per cent for this indicator. Blaenau Gwent had the most condensed middle half of LSOA ranges (29.8-45.0 per cent) compared to Cardiff which was the most dispersed (31.7-68.1 per cent).
In the Key Stage 4 Level 2 inclusive indicator there were pockets of high deprivation in south Wales and some north Wales towns. This is broadly a similar pattern to the education domain of WIMD 2014.
The Local Authority with the highest proportion of LSOAs in the most deprived 10% in Wales for this indicator was Merthyr Tydfil (30.6 per cent) followed by Blaenau Gwent (25.5 per cent). These Local Authorities also had the highest proportion of LSOAs in the most deprived 10% in the
education domain of WIMD 2014. Powys had no LSOAs in the most deprived 10%.
For the Key Stage 4 Level 2 inclusive indicator, the most deprived LSOA in Wales was St James 3 in Caerphilly. This was also the most deprived LSOA in the education domain of WIMD 2014.
16.9 per cent of pupils not achieving the Key Stage 4 Level 2 inclusive standard are found in the most deprived 10% of small areas for this indicator (the LSOAs ranked 1–191).
6.2 Key Stage 4 level 2 inclusive indicator, LSOA analysis
Table 6.1 below shows the rate of the top ten most deprived small areas (LSOAs) for the Key Stage 4 Level 2 inclusive indicator7, which measures the percentage achieving the equivalent of 5 A*-C grades at GCSE (including Mathematics and English/Welsh):
The most deprived LSOA for the Key Stage 4 Level 2 inclusive indicator was St. James 3 in Caerphilly, with a percentage of 11.3.
Seven of the ten most deprived LSOAs are found within south Wales and two of the remaining three are found in Wrexham, in north Wales.
[image:26.595.45.551.270.461.2] The two Wrexham LSOAs in the top ten most deprived are neighbouring LSOAs (Queensway 1 and Wynnstay).
Table 6.1: Top ten most deprived LSOAs for 15 year olds achieving the Key Stage 4
Level 2 inclusive standard
76.3 Distribution of the Key Stage 4 Level 2 inclusive indicator
[image:26.595.44.519.631.731.2]Table 6.2 below shows around half of those 15 year olds not achieving the Key Stage 4 Level 2 inclusive standard are found in the most-deprived 35.3 per cent of LSOAs in Wales, according to this indicator. Nearly one in six (16.9 per cent) are found at a rank less than or equal to 191, that is, in the most deprived 10% of areas in Wales.
Table 6.2: Distribution of 15 year olds not achieving the Key Stage 4 Level 2 inclusive
standard
Chart 6.1 below shows the spread of those achieving the Key Stage 4 Level 2 inclusivestandardfor each WIMD 2014 group. The blue boxes contain half the total number of LSOAs in each WIMD group, centred on the median (middle) rate for each WIMD group. The lines show the full range of rates in LSOAs for each WIMD group, some of these LSOAs may contain small numbers of 15 year olds, leading to possibly unreliable results.
There is a relationship between overall WIMD 2014 deprivation and the 15 year olds achieving the Key Stage 4 Level 2 inclusive standard. The average (median) percentage of 15 year olds achieving the Key Stage 4 Level 2 inclusive standard in the 10% most deprived LSOAs in WIMD 2014 was 28.3 per cent compared to 64.0 per cent in the 50% least deprived LSOAs in WIMD 2014. Note that, for this indicator, deprivation increases with decreasing percentage (that is, toward the bottom of the plot).
Chart 6.1: Percentage of 15 year olds achieving the Key Stage 4 Level 2 inclusive
standard, by WIMD 2014 groups
0 10 20 30 40 50 60 70 80 90 100
10% most deprived 10-20% most deprived 20-30% most deprived 30-50% most deprived 50% least deprived Overall WIMD 2014 Group
Key S ta ge 4 Lev el 2 in cl us iv e -3 y ea r av er ag e (p er cen ta ge)
6.4 Key Stage 4 level 2 inclusive indicator, Local Authority analysis
Chart 6.2 overleaf shows the spread of percentages achieving Key Stage 4 Level 2 inclusive for each Local Authority in Wales. The blue boxes contain half the total number of LSOAs in each Local Authority, centred on the median (middle) rate for each Local Authority. The lines show the full range of rates in LSOAs for each Local Authority, some of these LSOAs may contain small numbers of 15 year olds, leading to possibly unreliable results. Deprivation increases with decreasing percentage (that is, toward the bottom of the plot).
Chart 6.2: Key Stage 4 Level 2 inclusive percentages, by Local Authority
0 10 20 30 40 50 60 70 80 90 100 Ke y St ag e 4 Le ve l 2 in cl us iv e -3 ye ar av era ge (p erc en ta ge )Table 6.3 overleaf shows, for the Key Stage 4 level 2 inclusive indicator, the percentage of small areas (LSOAs) in each Local Authority which were in each of the following cumulative groups: the most deprived 10%, 20%, 30% and 50% of LSOAs in Wales. This analysis can be seen as identifying the concentration of the most deprived areas in a Local Authority, rather than an average level of deprivation.
The Local Authority with the highest proportion of LSOAs in the most deprived 10% in Wales for the Key Stage 4 level 2 inclusive indicator was Merthyr Tydfil (30.6 per cent) followed by Blaenau Gwent (25.5 per cent).
Powys had no LSOAs in the most deprived 10%. Only 22.8 per cent of the LSOAs in Powys were in the most deprived 50% in Wales.
Table 6.3: Distribution of LSOAs by 15 year olds achieving the Key Stage 4 Level 2
inclusive standard, within Local Authorities
8Local authority
Number of LSOAs in local
authority
% LSOAs with the
10% lowest average (11.3 - 30.1%)
% LSOAs with the
20% lowest average (11.3 - 36.0%)
% LSOAs with the
30% lowest average (11.3 - 42.3%)
% LSOAs with the
50% lowest average (11.3 - 52.2%)
Isle of Anglesey 44 4.5 13.6 22.7 40.9
Gwynedd 73 2.7 9.6 11.0 31.5
Conwy 71 5.6 14.1 19.7 38.0
Denbighshire 58 5.2 13.8 24.1 51.7
Flintshire 92 3.3 7.6 13.0 34.8
Wrexham 85 12.9 18.8 30.6 51.8
Powys 79 0.0 5.1 10.1 22.8
Ceredigion 46 4.3 8.7 13.0 37.0
Pembrokeshire 71 5.6 8.5 21.1 31.0
Carmarthenshire 112 1.8 11.6 22.3 43.8
Swansea 148 6.8 17.6 27.7 42.6
Neath Port Talbot 91 4.4 13.2 22.0 46.2
Bridgend 88 10.2 22.7 33.0 59.1
Vale of Glamorgan 79 8.9 16.5 25.3 40.5
Rhondda Cynon Taf 154 16.2 29.9 44.8 70.8
Merthyr Tydfil 36 30.6 38.9 55.6 86.1
Caerphilly 110 13.6 26.4 38.2 65.5
Blaenau Gwent 47 25.5 44.7 68.1 87.2
Torfaen 60 13.3 25.0 46.7 68.3
Monmouthshire 56 1.8 5.4 10.7 23.2
Newport 95 11.6 27.4 36.8 61.1
Cardiff 214 21.0 35.5 43.5 56.5
Wales 1909 10.0 20.0 30.0 50.0
6.5 Key Stage 4 Level 2 inclusive indicator background information
The Key Stage 4 Level 2 inclusive indicator measures the percentage of 15 year olds achieving the equivalent of 5 A*-C grades at GCSE (including Mathematics and English/Welsh). The data is based on the Pupil Level Annual School Census (PLASC) and Welsh Examinations Database (WED), covering the academic years 2010/11 – 2012/13. This indicator is included as a measure of pupils completing
compulsory school education with adequate numeracy and literacy skills, and only includes maintained schools. A lower percentage score in this indicator indicates a higher level of deprivation.
This indicator is intended to complement the Key Stage 4 Capped Points Score indicator (not included in this Article but data are available on StatsWales). Level 2 Inclusive and Capped Point Score replaced the Key Stage 4 Wider Point Score (used for WIMD 2011), as they measure complementary aspects of deprivation at the end of compulsory education. Therefore this is a new indicator for WIMD 2014 and therefore is not comparable with WIMD 2011.
For further information on analysis over time please see section 3.5 and Guidance Article.
8
7. Repeat absenteeism indicator
The repeat absenteeism indicator measures the percentage of primary and secondary school students missing 15 per cent or more of school sessions (which is used as a proxy for persistent absenteeism) and is discussed in further detail below in section 7.5.
7.1 Key results
The percentage of repeat absenteeism for school aged children in Wales was 9.9 per cent, which amounted to more than 105,000 pupils In the repeat absenteeism indicator high levels of deprivation were found in south Wales, with all of the ten most deprived LSOAs found in this region.
Rates for the middle half of LSOAs (the Inter-Quartile Rage) across Wales range from 5.8 to 12.8 per cent for this indicator. Gwynedd had the most condensed middle half of LSOA ranges (5.5-8.9 per cent) compared to Cardiff which was the most dispersed (4.9-15.0 per cent).
Deprivation in this indicator was more concentrated in south Wales compared to the Key Stage 4 level 2 inclusive indicator and the education domain in WIMD 2014.
The Local Authority with the highest proportion of LSOAs in the most deprived 10% in Wales, for this indicator, was Blaenau Gwent (21.3 per cent) followed by Cardiff and Rhondda Cynon Taf (18.2 per cent).Blaenau Gwent also had one of the highest proportions of LSOAs in the most deprived 10% of the Key Stage 4 Level 2 inclusive indicator and in the education domain of WIMD 2014. Conwy, Powys, Ceredigion and Monmouthshire all had no LSOAs in the most deprived 10%.
For the repeat absenteeism indicator, the most deprived LSOA in Wales was Castle 2 North in Swansea 9.
21.9 per cent of school aged children with repeat absence are found in the most deprived 10% of small areas for this indicator (the LSOAs ranked 1–191).7.2 Repeat absenteeism indicator, LSOA analysis
Table 7.1 below shows the rate of the top ten most deprived small areas (LSOAs) for repeat absenteeism amongst school aged children (percentage) 9:
The most deprived LSOA for repeat absenteeism amongst school aged children was Castle 2 North in Swansea, with a percentage of 38.7. However this LSOA did contain a small population of school aged children (31), which may have a disproportionate effect on the indicator.
Five of the ten most deprived LSOAs are found in the mainly urban Local Authorities of Swansea and Cardiff.
[image:32.595.44.524.259.449.2] All of the ten most deprived LSOAs are found in south Wales.
Table 7.1: Top ten most deprived LSOAs for repeat absenteeism
97.3 Distribution of the repeat absenteeism indicator
Table 7.2 below shows around half of those school aged children with repeat absence are found in the most-deprived 29.2 per cent of LSOAs in Wales (according to this indicator). More than one in five (21.9 per cent) are found at a rank less than or equal to 191, that is, in the most deprived 10% of areas in Wales.
Table 7.2: Distribution of school aged children with repeated absence
Percentage of repeat absenteeism Percentage of
WIMD group, some of these LSOAs may contain small numbers of school aged children, leading to possibly unreliable results.
There is a relationship between overall WIMD 2014 deprivation and the repeat absenteeism indicator. The average (median) percentage for repeat absenteeism in the 10% most deprived LSOAs in WIMD 2014 was 17.7 per cent compared to 5.9 per cent in the 50% least deprived LSOAs in WIMD 2014.
Chart 7.1: Percentage of school aged children with repeated absence, by WIMD 2014
groups
0 5 10 15 20 25 30 35 40
10% most deprived 10-20% most deprived 20-30% most deprived 30-50% most deprived 50% least deprived Overall WIMD 2014 Group
R
ep
ea
t a
b
sen
teei
sm
(
p
er
cen
ta
ge)
7.4 Repeat absenteeism, Local Authority analysis
Chart 7.2 overleaf shows the spread of repeat absenteeism percentages for each Local Authority in Wales. The blue boxes contain half the total number of LSOAs in each Local Authority, centred on the median (middle) rate for each Local Authority. The lines show the full range of rates in LSOAs for each Local Authority, some of these LSOAs may contain small numbers of school aged children, leading to possibly unreliable results.
[image:33.595.52.502.189.463.2]There is notable variation between Local Authorities in terms of the median rates, but also within Local Authorities in terms of the range of values. For example, all (except Ceredigion) contain at least one LSOA with at least 15% repeat absenteeism, and all contain at least one LSOA with at most 5% repeat absenteeism.
Chart 7.2: Repeat absenteeism percentages, by Local Authority
0 5 10 15 20 25 30 35 40 R ep ea t a bs en te ei sm (p erc en ta ge )Table 7.3: Distribution of LSOAs by school aged children with repeated absence, within
Local Authorities
Local authority
Number of LSOAs in local
authority
% LSOAs with the 10% highest rates
(16.6-38.7%)
% LSOAs with the 20% highest rates
(13.6-38.7%)
% LSOAs with the 30% highest rates
(11.9-38.7%)
% LSOAs with the 50% highest rates
(9.0-38.7%)
Isle of Anglesey 44 2.3 9.1 22.7 47.7
Gwynedd 73 5.5 6.8 6.8 24.7
Conwy 71 0.0 2.8 15.5 35.2
Denbighshire 58 6.9 10.3 19.0 32.8
Fl intshire 92 2.2 10.9 22.8 34.8
Wrexham 85 4.7 11.8 21.2 32.9
Powys 79 0.0 3.8 12.7 30.4
Ceredigion 46 0.0 0.0 0.0 19.6
Pembrokeshire 71 7.0 15.5 26.8 46.5
Carmarthenshire 112 9.8 19.6 31.3 67.0
Swansea 148 16.2 31.1 38.5 54.1
Neath Port Talbot 91 11.0 27.5 37.4 65.9
Bridgend 88 10.2 22.7 31.8 54.5
Vale of Glamorgan 79 2.5 10.1 19.0 40.5
This analysis can be seen as identifying the concentration of the most deprived areas in a Local Authority, rather than an average level of deprivation.
The Local Authority with the highest proportion of LSOAs in the most deprived 10% in Wales for repeat absenteeism was Blaenau Gwent (21.3 per cent) followed by Cardiff and Rhondda Cynon Taf (18.2 per cent).
Conwy, Powys, Ceredigion and Monmouthshire all had no LSOAs in the most deprived 10%.
Ceredigion also had no LSOAs in the most deprived 30% and only 19.6 per cent in the most deprived 50% in Wales.
Blaenau Gwent had the highest proportion of LSOAs in the most deprived 50% in Wales (76.6 per cent). The next highest was again Rhondda Cynon Taf, with 71.4 per cent of its LSOAs in the most deprived half of Wales.
7.5 Repeat absenteeism indicator background information
The repeat absenteeism indicator is measured by the percentage of primary and secondary school students missing 15 per cent or more of school sessions (which is used as a proxy for persistent
absenteeism). The data is based on the Pupil Level Annual School Census (PLASC) covering the academic years 2010/11 – 2012/13. Data is based on all pupils of statutory school age attending a maintained school. The indicator only includes maintained schools.
The methodology by which this indicator was constructed changed between WIMD 2014 and WIMD 2011. The two absenteeism indicators from WIMD 2011 have been replaced in WIMD 2014 with a single indicator on repeat absenteeism that covers both primary and secondary absenteeism. Therefore comparisons cannot be made with older data.
8. Overcrowded households indicator
The overcrowded households indicator measures whether a household's accommodation is
overcrowded, based on the number of bedrooms. The number of bedrooms required is subtracted from the number of bedrooms in the household's accommodation to obtain the occupancy rating and is discussed in further detail below in section 8.5.
8.1 Key results
Children have a higher rate of living in overcrowded households, 9.2 per cent (which amounted to over 61,500 overcrowded households with children in Wales) compared to the rate of the overall population, 5.5 per cent (which amounted to over 166,300 overcrowded households in Wales).
Rates for the middle half of LSOAs (the Inter-Quartile Range) across Wales range from 5.1 to 12.0 per cent for this indicator. Powys had the most condensed middle half of LSOA ranges (4.6-8.4 per cent) compared to Cardiff which was the most dispersed (5.3-18.3 per cent).
For children living in overcrowded households there were pockets of high deprivation in the south Wales valleys and large cities, and in some north Wales towns. Large cities in south Wales shared a similar pattern to that seen in the housing domain of WIMD 2014.
The Local Authority with the highest proportion of LSOAs in the most deprived 10% in Wales for this indicator was Cardiff (34.1 per cent) followed by Merthyr Tydfil (19.4 per cent). Cardiff also had the highest proportion of LSOAs in the most deprived 10% in the housing domain of WIMD 2014. Isle of Anglesey had no LSOAs in the most deprived 10%.
For children living in overcrowded households the most deprived LSOA in Wales was Butetown 1, in Cardiff.
23.4 per cent of children who live in overcrowded households are found in the most deprived 10% of small areas for this indicator (the LSOAs ranked 1–191).
8.2 Overcrowding indicator for children LSOA analysis
Table 8.1 below shows the rate of the top ten most deprived small areas (LSOAs) for the overcrowding indicator for those aged 0-18 (percentage) 10:
The most deprived LSOA for overcrowding for children was Butetown 1 in Cardiff, with a rate of 50.7 per cent.
Nine of the ten most deprived LSOAs for child overcrowding are found within the Cardiff Local Authority.
The most deprived LSOAsare highly concentrated within Cardiff, with three neighbouring LSOAs in Butetown and four other neighbouring LSOAs (Cathays 9, Cathays 6, Cathays 7 and
Plasnewydd 4) within the top ten.
[image:38.595.43.515.281.472.2] All of the ten most deprived LSOAs are found within south east Wales.
Table 8.1: Top ten most deprived LSOAs for children living in overcrowded households
108.3 Distribution of the overcrowded households indicator for children
Table 8.2 shows around half of those children who live in overcrowded households are found in the most-deprived 27.3 per cent of LSOAs in Wales, according to this indicator. More than one in five (23.4 per cent) are found at a rank less than or equal to 191, that is, the most deprived 10% of areas in Wales. Within the most deprived 10% of LSOAs, 38.2 per cent (73 of 191) are from the Cardiff Local Authority.
Table 8.2: Distribution of children living in overcrowded households
Chart 8.1 below shows the spread of children in overcrowded households (percentage) for each WIMD 2014 group described. The blue boxes contain half the total number of LSOAs in each WIMD group, centred on the median (middle) rate for each WIMD group. The lines show the full range of rates in LSOAs for each WIMD group, some of these LSOAs may contain small numbers of children, leading to possibly unreliable results.
There is a relationship between overall WIMD 2014 deprivation and the overcrowded households indicator for children. The average (median) percentage of children living in overcrowded households in the 10% most deprived LSOAs in WIMD 2014 was 15.0 per cent compared to 5.4 per cent in the 50% least deprived LSOAs in WIMD 2014. However each group has at least one LSOA with more than 30% of its children in overcrowded households.
Chart 8.1: Percentage of children living in overcrowded households, by WIMD 2014
groups
0 10 20 30 40 50 6010% most deprived 10-20% most deprived 20-30% most deprived 30-50% most deprived 50% least deprived Overall WIMD 2014 Group
O ver cr o wd ed h o u seh o ld s -ag ed 0 -1 8 ( p er cen ta ge)
8.4 Overcrowded households indicator for children, Local Authority analysis
Chart 8.2 overleaf shows the spread of percentages for children living in overcrowded householdsfor each Local Authority in Wales. The blue boxes contain half the total number of LSOAs in each Local Authority, centred on the median (middle) percentage for each Local Authority. The lines show the full range of percentages in LSOAs for each Local Authority, some of these LSOAs may contain small
numbers of children, leading to possibly unreliable results.
Chart 8.2: Percentage of children living in overcrowded households, by Local Authority
0 10 20 30 40 50 60
O
ve
rc
ro
w
de
d
ho
us
eh
ol
ds
-ag
ed
0
-1
8
(p
erc
en
ta
ge
[image:40.595.54.516.63.363.2])
Table 8.3 overleaf shows for the overcrowded households indicator for children, the percentage of small areas (LSOAs) in each Local Authority which were in each of the following cumulative groups: the most deprived 10%, 20%, 30% and 50% of LSOAs in Wales. This analysis can be seen as identifying the concentration of the most deprived areas in a Local Authority, rather than an average level of deprivation.
The Local Authority with the highest proportion of LSOAs in the most deprived 10% in Wales for children living in overcrowded households was Cardiff (34.1 per cent) followed by Merthyr Tydfil (19.4 per cent).
The Isle of Anglesey had no LSOAs in the most deprived 10%.
Only 27.8 per cent of the LSOAs in Powys were in the most deprived 50% in Wales.
Table 8.3: Distribution of LSOAs by children living in overcrowded households, within
Local Authorities
Local authority
Number of LSOAs in local
authority
% LSOAs with the 10% highest rates (16.2-50.7%)
% LSOAs with the 20% highest rates (13.2-50.7%)
% LSOAs with the 30% highest rates (11.1-50.7%)
% LSOAs with the 50% highest rates
(8.1-50.7%)
Isle of Anglesey 44 0.0 4.5 6.8 38.6
Gwynedd 73 5.5 15.1 37.0 63.0
Conwy 71 8.5 18.3 28.2 46.5
Denbighshire 58 12.1 20.7 27.6 44.8
Flintshire 92 9.8 19.6 30.4 46.7
Wrexham 85 18.8 28.2 32.9 55.3
Powys 79 1.3 5.1 10.1 27.8
Ceredigion 46 8.7 17.4 26.1 50.0
Pembrokeshire 71 1.4 9.9 22.5 50.7
Carmarthenshire 112 0.9 11.6 20.5 46.4
Swansea 148 10.1 25.0 33.8 48.0
Neath Port Talbot 91 1.1 6.6 17.6 44.0
Bridgend 88 2.3 10.2 19.3 34.1
Vale of Glamorgan 79 2.5 5.1 12.7 31.6
Rhondda Cynon Taf 154 2.6 9.7 20.1 47.4
Merthyr Tydfil 36 19.4 33.3 55.6 72.2
Caerphilly 110 8.2 18.2 30.9 60.0
Blaenau Gwent 47 8.5 25.5 38.3 72.3
Torfaen 60 11.7 31.7 43.3 60.0
Monmouthshire 56 3.6 12.5 23.2 41.1
Newport 95 16.8 26.3 42.1 52.6
Cardiff 214 34.1 48.6 54.7 63.6
Wales 1909 10.0 20.0 30.0 50.0
8.5 Overcrowded households indicator background information
This indicator provides a measure of whether a household's accommodation is overcrowded (based on the number of bedrooms). The ages of the household members and their relationships to each other are used to derive the number of bedrooms they require, based on a standard formula. The number of bedrooms required is subtracted from the number of bedrooms in the household's accommodation to obtain the occupancy rating. For example, an occupancy rating of -1 implies that a household has one fewer bedroom than required. The data is based on 2011 Census data (from the ONS).
A bedroom is defined as any room that was intended to be used as a bedroom when the property was built, or any room that has been permanently converted for use as a bedroom. It also includes all rooms intended for use as a bedroom even if not being used as a bedroom at the time of the census. Bedsits and studio flats are counted as having one bedroom.
The overcrowded households indicator for WIMD 2014 is not comparable with WIMD 2011. In WIMD 2011, an indicator based on overcrowded households (rooms measure) was used and this excluded all student households. For further information on analysis over time see section 3.5 and Guidance Article.
Links to further information on Census methodology can be found at:
9. Distributional analysis of children across deprivation groups for WIMD 2014 domains
[image:42.595.51.503.246.358.2]Table 9.1 below shows the spread of those aged 0-18 across WIMD deprivation groups, that is, groups of LSOAs categorised by their deprivation rank. This is done for the overall WIMD 2014 and also for the following domains: community safety, physical environment and access to services. These domains can be viewed as describing the local area (broadly speaking how unsafe, polluted, or inaccessible it is), rather than capturing characteristics of the people or households within the area. The analysis below provides an indication of how the population of children in Wales is spread across the different deprivation categories of areas.
Table 9.1: Distribution of all children between deprivation groups for WIMD 2014
domains
Percentage of all children
Deprivation
grouping for LSOAs
Overall WIMD 2014
Community safety domain
Physical
Environment domain
Access to
Services domain
most-deprived 10% 12.0 10.6 11.1 9.3
most-deprived 20% 22.8 21.5 20.7 19.3
most-deprived 30% 33.2 31.9 30.7 30.0
most-deprived 50% 53.1 52.3 50.9 50.9
least-deprived 50% 46.9 47.7 49.1 49.1
A greater proportion of children live in the most deprived 10% of LSOAs in WIMD 2014 (12.0 per cent) than would be expected if evenly distributed. Only 46.9 per cent of those aged 0-18 live within the least deprived 50% of LSOAs in WIMD 2014.
A slightly larger percentage of children live in the most deprived 10% of LSOAs for the WIMD 2014 community safety (10.6 per cent) andphysical environment (11.1 per cent) domains than would be expected if evenly distributed.
10. Further Information
You can find more background information on WIMD at the following sources:
The WIMD Webpage
WIMD - Annual indicator data
WIMD – A Guide to Analysing Indicator Data
WIMD 2014 Main Report
WIMD 2014 Interactive Webpage
WIMD 2014 Guidance on Use
WIMD 2014 Frequently Asked Questions
WIMD 2014 Technical Report
WIMD 2014: A guide to analysing deprivation in rural areas
Other UK nations produce their own Indices of Multiple Deprivation, including some analysis relevant to children:
English indices of deprivation 2015 and sub-index for children
Scottish Index of Multiple Deprivation 2012
Northern Ireland Multiple Deprivation Measure 2010
On 11 December Welsh Government plan to update the Children and Young People’s wellbeing monitor for Wales, which will be available at the following link:
http://gov.wales/statistics-and-research/children-young-peoples-wellbeing-monitor-wales/?lang=en
This article is intended as the first in a series of Articles accompanying the annual Indicator data, and we welcome feedback on topics to cover, content and format of the Articles. Feedback can be sent to
11. Notes on the use of statistical articles
Statistical articles generally relate to one-off analyses for which there are no updates planned, at least in the short-term, and serve to make such analyses available to a wider audience than might otherwise be the case. They are mainly used to publish analyses that are exploratory in some way, for example:
Introducing a new experimental series of data;
A partial analysis of an issue which provides a useful starting point for further research but that nevertheless is a useful analysis in its own right;
Drawing attention to research undertaken by other organisations, either commissioned by the Welsh Government or otherwise, where it is useful to highlight the conclusions, or to build further upon the research;
An analysis where the results may not be of as high quality as those in our routine statistical releases and bulletins, but where meaningful conclusions can still be drawn from the results.
Where quality is an issue, this may arise in one or more of the following ways:
being unable to accurately specify the timeframe used (as can be the case when using an administrative source);
the quality of the data source or data used; or other specified reasons.
However, the level of quality will be such that it does not significantly impact upon the conclusions. For example, the exact timeframe may not be central to the conclusions that can be drawn, or it is the order of magnitude of the results, rather than the exact results, that are of interest to the audience.
The analysis presented does not constitute a National Statistic, but may be based on National Statistics outputs and will nevertheless have been subject to careful consideration and detailed checking before publication. An assessment of the strengths and weaknesses in the analysis will be included in the article, for example comparisons with other sources, along with guidance on how the analysis might be used, and a description of the methodology applied.
Articles are subject to the release practices as defined by the release practices protocol, and so, for example, are published on a pre-announced date in the same way as other statistical outputs. Missing value symbols used in the article follow the standards used in other statistical outputs, as outlined below.
.. The data item is not available
. The data item is not applicable