Social Research Number: 73/2015
Publication Date: 30/12/2015
Learner Voice Wales survey
Learner Voice Wales: Sixth-forms pilot
Ipsos MORI
Views expressed in this report are those of the researcher and not necessarily those of the Welsh Government
For further information please contact: Siân Hughes
Department: Economy, Skills and Natural Resources Welsh Government
Rhodfa Padarn Llanbadarn Fawr Aberystwyth SY23 3UR Tel: 0300 062 2239
Email: [email protected]
Welsh Government Social Research, 30 December 2015
ISBN: 978-1-4734-5571-9 © Crown Copyright 2015
All content is available under the Open Government Licence v3.0, except where otherwise stated.
i
Table of contents
Table of contents ... i
List of tables ... ii
List of figures ... iii
Glossary ... iv
1. Executive summary ... 1
2. Background and Introduction... 7
3. Methodology ... 10
4. Learner Datasets ... 24
5. Reporting and findings ... 36
6. School feedback ... 47
7. Going forward ... 53
Annex A ... 59
Annex B – Fields requested in the Data Sharing Agreement ... 67
Annex C – List of 1st and 2nd tier Sector Subject Areas ... 71
ii
List of tables
Table 1: Schools invited to take part in the Learner Voice Wales sixth-form pilot ... 11 Table 2: Response per school taking part in the pilot ... 18 Table 3: Representativeness of learners in three schools taking part in the
survey: by gender ... 20 Table 4: Representativeness of learners in three schools taking part in the
survey: by school year... 21 Table 5: Number of qualifications being studied by sixth-form learners
responding to the survey ... 22 Table 6: Dataset quality ... 28 Table 7: First-tier SSAs with above and below average ‘very good’ responses
to Teaching and Training... 42 Table 8: Question 10 categories: things mentioned by sixth-formers that they
like best ... 44 Table 9: Question 11 categories: things mentioned by sixth-formers that they
iii
List of figures
iv
Glossary
Adult Community Learning
Adult community learning (ACL) can be defined as flexible learning opportunities for adults, delivered in community venues to meet local needs. ACL that is funded by the Welsh Government covers a diverse range of provision. It embraces learning opportunities which are offered by further education institutions and local authorities.
Base (size) The ‘base’ is the number of responses given to a particular question in the survey.
Benchmarks Benchmarks are used to compare like-for-like data. They compare the percentage of learners from two sub-groups giving the same answer to a specific question.
Census A census is a complete population count for a given area or place taken on a specific date. In this instance, the survey was intended to be completed by all sixth-form learners enrolled in each of the participating schools. Cognitive testing Cognitive testing involves face-to-face interviews with
learners to find out how they interpret and respond to questionnaire wording. The purpose of this is to ensure the questions are interpreted consistently across all respondents, and are asking what the researcher intends them to.
Composite scores
Composite scores have been created for five themes within the survey: information and advice, teaching and training, responsiveness, help and support, and health and well-being. They are calculated at the individual level, taking an average of a learner’s response to each of the questions within that theme.
v loop the repetition of the battery of statements at Q6, for each of
the courses that a learner is studying. This allows them to comment on their experience of and satisfaction with the teaching/ training they receive for each course.
Data Sharing Agreement
A Data Sharing Agreement was signed by named
employees of Ipsos MORI and the Welsh Government and set out the legal situation regarding the protection and use of personal data. In this instance, the data being held and transferred was for all sixth-form learners enrolled at the schools that participated in the survey. It set out the rules under which the learner data would be handled, once conferred from the school to the research agency and draws on the Data Protection Act (1998).
DfES Department for Education and Skills: department in the Welsh Government responsible for education and skills provision.
Easy Read A version of written material that is designed to be more accessible to learners with learning difficulties or
disabilities (LLDD), or for learners with English as a second language (ESOL). It uses pictures instead of or as well as words and a different response scale than the core survey (with fewer points).
Estyn Her Majesty's Inspectorate for Education and Training in Wales, responsible for inspecting quality and standards in education and training in Wales.
Further Education
Institutions in the Further Education (FE) sector are educational establishments that are publicly funded to deliver education and training to learners aged 16 and over.
vi data courses they are studying are detailed in one row of a
spreadsheet or dataset, as opposed to a column. In-scope
learners
Refers to learners who are eligible to take the Learner Voice Wales survey.
KAS Welsh Government statisticians mainly work in Knowledge and Analytical Services (KAS), a central unit of analysts organised by subject area. In addition to statistical staff, KAS includes economists, social researchers, the geography and technology team and library services. LLDD Learners with learning difficulties and/or disabilities. Lifelong
Learning Wales Record (LLWR)
The Lifelong Learning Wales Record. LLWR is a system used to collect data on learners, their learning activities and achievements across further education, work-based learning and adult community learning. This data is used as the basis for running management information reports and benchmarking data. Schools in Wales are required to submit learner data to the LLWR: see instead descriptions for MIS and Post-16 PLASC below.
Local Education Authority
Local education authorities (LEAs) are the local councils in England and Wales that are responsible for education within their jurisdiction. The term is used to identify which council (district or county) is locally responsible for
education in a system with several layers of local government.
Matching The process that attempts to link learners’ survey
vii instance the ULN and provider/ school code) and other fields are needed.
Metadata Data are collected ‘behind the scenes’ of many surveys while fieldwork is ongoing. It can be broadly understood as ‘data about the data’ and can include time taken to
complete the survey and the device and browser type on which an online survey was taken.
MIS / SIMS Management Information System: a generic term for the method and software used by schools to record learner details.
Participation rate
The number of learners to complete the survey as a proportion of all learners eligible to take the survey (in-scope learners).
Portal A website was created to inform providers taking part in the Learner Voice Wales survey about the processes and timetable. Providers are able to log in securely to access their reports using a unique ID and password provided to them by the research agency.
PLASC Every January, all schools that are maintained by the Welsh Government are required to provide pupil and school level data to ensure more accurate targeting of funding and to help the Welsh Government to develop and monitor policy. This Pupil Level Annual School Census (PLASC) is mandatory for all sectors to complete including nursery, primary, middle, secondary and special. All pupils on roll on the census date must be included in the return. The post-16 PLASC contains data for all learners aged 16 or over on the date of the census.
viii code code. The codes known to the schools are four digits long. Question Bank In addition to the core questions of the survey, providers
can choose to ask a more few more from a list of 37 approved by the Welsh Government. These ‘Question Bank’ questions were intended to cover areas of particular interest or significance for individual providers or learning sectors in more detail, such as provider resources and facilities, learning materials, and learners’ skills
development. Qualification
type
The courses that are available for sixth-form learners in Wales to study are grouped together into different types depending on whether they are academic, vocational or skills-related on and on their level of difficulty. Analysis in the pilot was completed using six different types: GCSEs, GCE AS Level, GCE A2 Level, BTECs, Advanced
Vocational Certificates of Education and any others not otherwise included under another type.
RAGed tables These are the tables in the PowerPoint report by which the composite scores are broken down by first and second tier Sector Subject Areas and a red or green cell indicates if the score is six or more points higher or lower than the benchmark.
Reportal Providers that take part in the Learner Voice Wales survey are able to access anonymised data submitted by their learners via an online site. The site is an interactive tool, and allows providers to filter their data or compare the results for specific sub-groups.
Sixth-form learners
sixth-ix form there are three recognised school years: Year 12 (also known as lower-sixth), 13 (also known as upper-sixth) and sometimes Year 14.
Sector Subject Areas
All regulated qualifications are assigned a Sector Subject Area (SSA) code by the Awarding Organisation. These classifications can be used to group qualifications together into one of fifteen categories (such as Social Sciences or Health, Public Services and Care) for the purposes of analysis.
‘This Does Not Apply to Me’
TDNATM is an answer option available at some questions in the survey. In the main survey, TDNATM responses are not shown in the PowerPoint reports and are removed from the base. TDNATM responses have been retained in the bases for the pilot and shown in the PowerPoint reports however for reasons explained in this report.
Unique Learner Number
Learners in Wales are designated a ULN that is known both to the learning provider and Welsh Government and is used, for example, in examinations, the Post-16 PLASC and LLWR.
Verbatim responses
A verbatim is the exact wording given in response to an open-ended question, where learners are able to write/type in full sentences, as opposed to selecting a pre-specified response.
Welsh for Adults (WfA)
A national initiative based at six Welsh language centres across Wales that offer Welsh language courses as a specific part of adult community learning (ACL) provision. Work Based
Learning (WBL)
x learning programmes offered support employed and
unemployed learners, and include: Apprenticeship
programmes; Flexible learning; Traineeship programmes; and Work Ready programmes.
Weighting A process to adjust the profile of the survey sample (those who took part) so that it is representative of the real learner population (everyone who could take part).
Welsh-medium school
1
1.
Executive summary
Introduction to the pilot
1.1 The Learner Voice Wales survey forms part of the ‘Responsiveness’ element of the Welsh Government’s Quality and Effectiveness
Framework and was introduced by the Department for Education and Skills (DfES) in 2013 to understand and respond to the views of learners in the Further Education (FE), work-based learning (WBL), adult community learning (ACL) and Welsh for adults (WfA) sectors across Wales. The survey findings also:
•
Inform Estyn1 inspections of post-16 learning providers;•
Help providers to understand aspects of their delivery that may need improvement; and•
Allow providers to compare satisfaction with their provision against a national benchmark.1.2 In order to meet these aims for all post-16 learners across Wales, DfES commissioned Ipsos MORI to explore the logistics of how the survey could be delivered in a school setting, to sixth-form learners. This report details how the pilot was conducted and concludes with suggestions for the future implementation of the survey in schools with sixth-form learners.
Methodology
1.3 The questionnaire that is usually distributed to learners in the FE sector was adapted for use in a sixth-form setting and then cognitively tested with sixth-form learners. Two schools volunteered to take part in the testing in December 2014, one of which was a Welsh-medium school. Some revisions were made following the testing and the course-level loop was extended from three to five subjects.
1 Her Majesty's Inspectorate for Education and Training in Wales, responsible for inspecting
2 1.4 Ten schools in South Wales were then invited to take part in the pilot
survey. The survey was made available to sixth-form learners in these schools to answer online between 2nd -27th March 2015, in English and in Welsh. A paper version was made available for the schools to download from a secure webpage but it was not used.
1.5 Completed surveys were received from 816 sixth-form learners, which represented a participation rate of 43 per cent of the total sixth-form population in the eight schools that took part. Responses in Welsh made up one per cent of the completed surveys, as in the main Learner Voice Wales survey2. The average length was 11 minutes and 10 seconds and a higher proportion of surveys were completed on a mobile device than in the main Learner Voice Wales survey. 1.6 While feedback about the questionnaire was positive from both
learners and the schools, participation rates were lower than in the main survey. This would need to be addressed if the survey is rolled out across Wales, to ensure that the findings are representative. The highest participation rates were from the school where an Academic Registrar, rather than teacher, took charge of engaging the learners. They achieved a high participation rate by booking each tutor group into the IT suite during ‘study periods’ (time when there is no other lessons scheduled and which the students use for completing homework or coursework) to complete the survey and otherwise telling the learners to complete it at home.
1.7 Overall, the fieldwork period went very well: no queries or complaints were made by the schools and they did not encounter any technical difficulties in using the online survey. More detail on the methodology is given in Chapter 3 and the questionnaire used in the pilot can be seen in Annex A.
2 It should be borne in mind that the survey was administered in schools in South Wales only,
3
Matching to learner datasets
1.8 Ahead of fieldwork taking place for the main survey the Welsh Government provides an extract from the Lifelong Learning Wales Record (LLWR). This is so learners can be matched -as they take part in the survey - to the courses they are recorded as studying. As
described in more detail in Chapter 4, the Welsh Government has different data requirements for schools and so there is no comparable dataset for sixth-form students in Wales. As live matching could therefore not take place, a course-level loop was built from the courses that were known to be available for sixth-form learners in Wales to study. To determine the effectiveness of the loop, the
participating schools were asked for a dataset of their learners’ details so that retrospective matching could be undertaken.
1.9 Three of the eight schools that participated in the survey submitted a dataset. These showed that the loop captured 96 per cent of courses that were being studied by the learners that responded to the survey (and which were successfully retrospectively matched). A decision should be made before the future roll out of the survey as to whether the loop is accurate enough or if live matching (as for the main survey) is preferable.
1.10 Data on the learner profile of each school is needed, even if the built course-level loop is deemed accurate without needing to
retrospectively match survey responses, in order to weight the data. Without weighting, the findings cannot be considered to be
4
Reporting the findings
1.11 Chapter 5 has more on each of the three individualised reports that were made available for the schools to download from an online portal. In brief, these were:
• A PowerPoint report of 27 slides comprised of composite scores for the main ‘themes’ in the survey (for example, ‘Information and Advice’) by first and second tier Sector Subject Areas, response to each question (for example, the per cent saying ‘very good’ through to ‘very poor’ for Q1) and benchmarks (consisting of the average ‘very good’ response across the eight schools);
• An Excel report, which broke down answers to all of the questions by key learner demographics (gender, school year and qualification type) and first and second tier Sector Subject Areas;
• An Excel sheet of the verbatim answers given by their learners to the two open-ended questions in the survey (Q10 and Q11): these ask learners to comment on the best thing about their provider and suggestions for improvement.
1.12 Feedback from the schools indicated that the PowerPoint report was most easily and readily used: indeed some had already shown it to colleagues and other stakeholders.
1.13 An overview of the findings is also provided in Chapter 5, including a discussion of composite scores, overall satisfaction and a comparison of verbatim responses given in the pilot to those received from FE students in the 2013/14 survey.
5 learners said that their experience was ‘very good’ or ‘good’. In terms of satisfaction with courses, 77 per cent of sixth-form learners in the pilot said they were as expected or better.
1.15 Analysis was undertaken to compare the verbatim responses given by sixth-form and Further Education learners to the two open-ended questions in the survey. It is important to note that only very broad comparisons between these two learner groups can be drawn, given that response to the sixth-form survey was not representative and relies on far fewer responses than for the main survey.
1.16 For both sectors, the ‘best thing’ about their provider related to aspects of learning. Within ‘learning’, FE learners commented on having enjoyable courses, gaining or learning new skills, liking the assignments or practical work components, and having small class sizes. While sixth-form learners also mentioned having enjoyable courses, they tended to focus more on having study periods in which to work or revise and the freedom to study at their own pace.
1.17 In terms of areas for improvement, the verbatim responses from both FE and sixth-form learners suggested that ‘teaching and learning’ was of the highest priority. In particular, sixth-formers wanted more help and support from teachers and requested changes to the Welsh Baccalaureate.
School feedback and rolling out the survey
1.18 The participating schools were asked to provide feedback on the pilot, in order to inform suggestions for change ahead of the survey being rolled out across all sixth-forms in Wales. Five of the schools provided responses in writing and these are summarised in Chapter 6. Briefly, schools reported that:
• their sixth-form learners were happy to take part in the survey; • the Survey Guidance was useful for reminders about how the
6 • the PowerPoint report was the most visually appealing and had
already been used to feedback to students, staff and governors. 1.19 The final chapter of this report presents a summary of the key
challenges of the pilot and suggestions for change should the Learner Voice Wales survey be rolled out to all sixth-form learners in Wales. It is split between recommendations for survey processes, methodology and reporting. Mainly it will be important to:
• improve school engagement with the survey, perhaps by asking an intermediary that is familiar with schools in a particular region to communicate on an ad-hoc basis with them;
• achieve a representative response and obtain learner datasets needed for matching and weighting; and
7
2.
Background and Introduction
Introduction to the Learner Voice Wales Survey
2.1 The Learner Voice Wales (LVW) survey has been conducted by Ipsos MORI on behalf of the Welsh Government since it began in 2013. The survey allows learners to provide anonymous feedback on their
learning experience and it is the largest post-16 survey undertaken in Wales. It currently includes learners in further education (FE), work-based learning (WBL), adult community learning (ACL), and Welsh for Adults (WfA).
2.2 Full and part-time learners funded by the Department for Education and Skills (DfES) are eligible to complete the survey, with fieldwork taking place between December and February each year. In 2014/15, the core survey was completed by 61,894 learners3, which represents
a participation rate of 68 per cent of the total sample. The survey is available online and on paper: response per mode was 78 and 22 per cent respectively. A total of 676 learners completed the survey in Welsh (1 per cent of all responses).
2.3 The questionnaire consists of questions ordered across five themes:
Information and advice;
Help and support;
Health and wellbeing;
Responsiveness;
Teaching and training.
2.4 Learners are also asked a series of questions relating to their
preferences for learning in Welsh, in English, or in a mixture or Welsh and English (bilingually), and the opportunity to do so; whether their learning has met their expectations; and their overall rating for their provider. In addition, the survey includes two ‘open’ questions
3 The core survey does not include questions that have been added from the Question Bank
8 regarding what learners like best about their provider, and what they think could be improved.
2.5 Learners taking part in the survey online are able to answer the Teaching and Training questions (Q6) for each course they are studying, up to a maximum of three courses. This is called the
‘course-level loop’. The courses the learner is studying are fed into the survey as a result of matching certain aspects of their details to their record in the Lifelong Learning Wales Record (LLWR)4.
2.6 A Question Bank is also provided, whereby each learning provider can choose additional questions to further tailor their survey for their learners. An Easy Read version of the questionnaire is also available. It offers learners who would struggle to complete the core survey, even with assistance, the opportunity to take part using a more
accessible format and on paper. This version of the survey is typically used with learners who have learning difficulties or low levels of basic literacy.
2.7 All learning providers with in-scope learners are asked to participate and are asked to achieve a minimum response rate of 50 per cent and a representative sample of learners by age, gender, qualification and course type (full or part-time).
Aims of the pilot
2.8 The Learner Voice Wales survey forms part of the ‘Responsiveness’ element of the Welsh Government’s Quality and Effectiveness Framework and was introduced by DfES to understand and respond to the views of learners in the FE, WBL, ACL and WfA sectors across Wales. The survey findings also:
4 Schools do not currently submit learner data to the LLWR. This reflects the different Welsh
9
Inform Estyn5 inspections of post-16 learning providers;
Help providers to understand aspects of their delivery that may need improvement. The standardised set of ‘core’ questions (albeit with slight differences in wording between the FE, ACL, WFA and WBL sectors) also allow providers to compare satisfaction with their provision against a national benchmark.
2.9 In order to meet these aims for all post-16 learners, DfES
commissioned Ipsos MORI to explore the logistics of how the survey could be delivered in a school setting, ahead of describing how the survey might be rolled out to sixth-form learners in future. The pilot, while not intended to provide representative findings, was therefore tasked with testing how well the existing survey questions, processes and reporting would work in a school sixth-form setting. This report therefore details how the pilot was conducted and concludes with recommendations for a potential future roll-out of the Learner Voice Wales survey among sixth-forms in Wales.
5 Her Majesty's Inspectorate for Education and Training in Wales, responsible for inspecting
10
3.
Methodology
Schools involved in the pilot
3.1 Ten schools in South Wales with sixth-forms learners were invited to take part in the pilot by a representative of the Central South
Consortium Joint Education Service. The schools were selected to be representative across:
• Local Education Authority as a proxy for urban/ rural location: four LEAs were chosen;
• School type (with Welsh or English-medium being of particular interest);
• Free School Meal (FSM) provision by per cent of students accessing it, and;
• Size (by number of sixth-formers enrolled in 2014).
11
Table 1: Schools invited to take part in the Learner Voice Wales sixth-form pilot
School Authority School type FSM Size
Coleg Cymunedol y
Dderwen Bridgend Comprehensive 25 207
Porthcawl Bridgend Comprehensive 10 340
St John the Baptist Rhondda Cynon Taf
Maintained (Church in
Wales) 14 217
Ferndale Community School
Rhondda
Cynon Taf Comprehensive 37 130
Michaelston
Community College Cardiff Comprehensive 43 236
Ysgol Gyfun Bro Morgannwg
Vale of
Glamorgan Welsh-medium 7 142
Stanwell School Vale of
Glamorgan Comprehensive 6 472
Llanishen High
School Cardiff Comprehensive 14 291
Ysgol Gyfun Rhydywaun
Rhondda
Cynon Taf Welsh-medium 14 201
Pontypridd High School
Rhondda
12
School workshop
3.3 The ten schools were invited to a workshop on 27th November, 2014
at Central South Consortium’s conference centre in Nantgarw, South Wales to explain about the Learner Voice Wales survey and to
introduce the pilot. Eight of the schools were able to attend, with two receiving follow-up calls shortly after the workshop to gain their views. 3.4 A document was circulated shortly after with the decisions made
following discussions at the workshop between Ipsos MORI, DfES, statisticians from the Welsh Government’s Knowledge and Analytical Services (KAS), teachers from the eight schools and representatives from the Central South Consortium.
3.5 The main points decided upon were:
• The survey questions would be cognitively tested with sixth-form learners in two schools (one to be Welsh-medium) to decide how appropriate they were for sixth-form learners.
• The survey would be available to complete online, twenty-four hours a day for three weeks: schools did not see the need for paper questionnaires or for a two month fieldwork period as is currently the case for the main LVW survey. This was because all of their learners are classroom-based and therefore a ‘captive audience’ that would need much less chasing than learners taking part in the main LVW survey. Schools planned to book their IT suites, for their sixth-form learners to complete the survey a class at a time.
• Schools would aim to achieve a census of their sixth-form
learners, considering the lower number of sixth-form students at each school as compared with the number of learners per
13 • Posters and other branded materials would be made available to
the schools to download from the portal, to display around the school to encourage participation.
• The course-level loop would be extended from three courses to five.
• Findings would be reported for first and second tier Sector Subject Area (SSAs), while preserving student anonymity by supressing findings where less than five students in one school were studying a particular SSA.
• Schools would receive three reports each: a PowerPoint deck of key findings, an Excel sheet containing response to each question by key learner demographics and first and second tier SSAs and, thirdly, an anonymised sheet listing the verbatim responses to the two open-ended questions in the survey.
• Schools would receive their reports via the portal, as is the case for the main LVW survey and guidance on delivering the survey would also be made available in this way.
• For ease, the Question Bank was not made available to schools taking part in the pilot and, after consultation, it was decided that the Easy Read questionnaire would be unnecessary.
Cognitive testing
3.6 It was decided that the Further Education (FE) version of the questionnaire, with slight amendments, would be the base for the questionnaire to be used in the pilot. Cognitive testing6 with learners in two schools would then judge the appropriateness of the questions for sixth-form students.
6 Cognitive testing is a method used to judge comprehension of new or complex questions. It
14 3.7 Cognitive testing of the questionnaire took place on 17th and 18th
December with 16 sixth-form learners at two schools: Coleg
Cymunedol y Dderwen and Ysgol Gyfun Bro Morgannwg. A Welsh-speaking Ipsos MORI researcher interviewed six sixth-form students at the Welsh-medium school, Ysgol Gyfun Bro Morgannwg, so that the appropriateness and accuracy of the translations could also be tested.
3.8 Each student was asked all of the questions intended for the pilot and asked to comment on how well they understood the questions and were able to answer them, and about the layout of the questionnaire. A report was delivered to DfES in January 2015 containing feedback and recommendations for change to the questionnaire, including: reference to ‘your sixth-form’ throughout to prompt response specifically about their post-16 experience and tighter Welsh translations for some questions.
The questionnaire used in the pilot
3.9 The questionnaire used in the pilot was comprised of eighteen questions and can be seen at Annex A. Largely it was based on the questionnaire administered to FE learners as part of the main survey, with adaptations suggested as a result of cognitive testing with sixth-formers. The questionnaire was translated into Welsh and also underwent adaptation for online use.
Differences from the main survey
15 3.11 As well as expanding the course-level loop, two questions in the main
survey were exchanged for replacements from the Question Bank. Schools are not required to offer all of their courses in Welsh so the questions about preference for learning bilingually (or exclusively through the medium of Welsh) and whether the learning provider offers a chance to learn in Welsh, were exchanged for questions on: • frequency of using or hearing Welsh informally at school; and
• the extent the school raises awareness of Welsh culture and history.
Beginning the survey
3.12 In order to begin the survey, the sixth-form learners needed to enter a school code. This field was locked to the codes for the ten
participating schools. As such, the schools needed to tell their
learners the correct code to progress. The learners also needed to be given their Unique Learner Number (ULN), which is known to the Welsh Government. In the main LVW Survey, this is ‘live matched’ to records in the LLWR and cross-referenced against the provider code. This was not possible for the pilot, on account of not having a sample to match to. However, the field did demand a ten digit number to improve accuracy.
3.13 In the workshop, a few of the schools asked how entering a specific school code and ULN might impact on learners who were studying one or more of their courses away from their ‘home’ school, at a ‘host’ institution. It was agreed that they would be given the ‘home’ school code and that the ULN was a unique reference which ‘follows the learner’ across different settings and learning episodes. In a future roll out, it will be important to explain that ‘home’ schools should take responsibility for learners that might be studying away, in terms of response and that ‘host’ schools do not need to ask a learner to take part again if they have done so at their home school.
16 not required in the main LVW survey if the provider code and ULN match to the LLWR. These details were asked for the pilot so that retrospective matching (see an explanation of fuzzy matching at paragraph 4.14) could take place.
Participation
3.15 The survey was made available for sixth-form students in the ten participating schools to answer online from 2nd to 27th March, 2015. A link to the survey was sent to the schools in an email, which they could then circulate to their learners. Guidance about the survey was made available to the schools via the portal, for which they needed a unique username and password which was emailed to them ahead of fieldwork starting. Branding materials, which they could use to
promote the survey and which displayed the link, were also made available on the portal.
3.16 Due to unforeseen circumstances, not all of the schools were able to take part in the pilot: eight of ten participated. In total, 816 completed surveys were received, which represents a participation rate of 43 per cent based on 1,877 sixth-form students enrolled across the eight schools. This compares with a participation rate of 68 per cent to the main LVW survey in 2014/15.
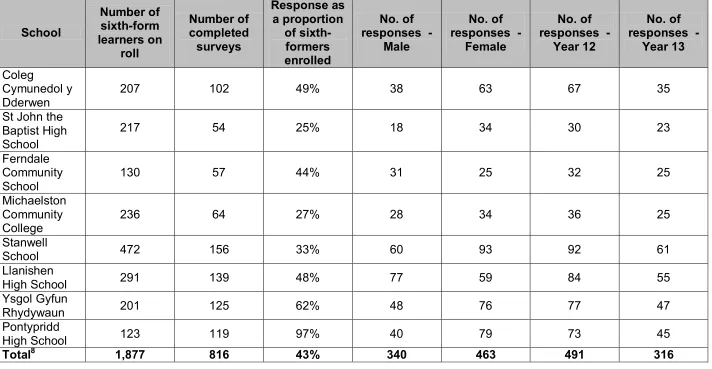
3.17 Table 2 presents response per school, as a proportion of sixth-form learners enrolled at the time7. Although the aim was to achieve a
census of sixth-form learners in each school and the highest
participation rate was 97 per cent, the lowest was 25 per cent. As a result, response cannot be assumed to be representative of the wider sixth-form population, or even representative of sixth-form views within a school. As such, findings should be taken as an indication of satisfaction only.
7 Enrolment numbers were provided by the Welsh Government from the September 2015
17 3.18 More completed surveys were received from female sixth-form
18
Table 2: Response per school taking part in the pilot
8 Learners were able to tick ‘prefer not to say’ with regards to their gender or school year. As such, the total for each school may not add to the number of
completed surveys. There were also learners in Year 14 who have not been included at this table.
School Number of sixth-form learners on roll Number of completed surveys Response as a proportion of sixth-formers enrolled No. of responses -
Male
No. of responses -
Female
No. of responses -
Year 12
No. of responses -
Year 13
Coleg
Cymunedol y Dderwen
207 102 49% 38 63 67 35
St John the Baptist High School
217 54 25% 18 34 30 23
Ferndale Community School
130 57 44% 31 25 32 25
Michaelston Community College
236 64 27% 28 34 36 25
Stanwell
School 472 156 33% 60 93 92 61
Llanishen
High School 291 139 48% 77 59 84 55
Ysgol Gyfun
Rhydywaun 201 125 62% 48 76 77 47
Pontypridd
High School 123 119 97% 40 79 73 45
19
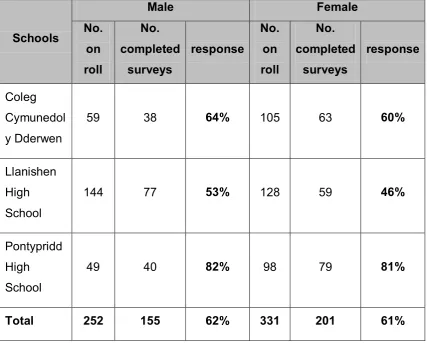
Participation among the three schools that submitted a dataset
3.19 Three of the schools that participated in the survey did later submit a dataset containing demographic and course details for each of their sixth-form learners on roll (see more on the datasets at Chapter 4). As a result of having this data, it was possible to determine the
representativeness of the learners that took part in the survey compared with the population of sixth-formers at each of the three. 3.20 This is shown at Tables 3 and 4 below. It should be noted that the
number of students that data were provided for is different than the number the Welsh Government understood to be enrolled at each school, according to the Post-16 PLASC returns in September 2015.9 In the tables below, the numbers on roll are taken from the datasets the schools submitted.
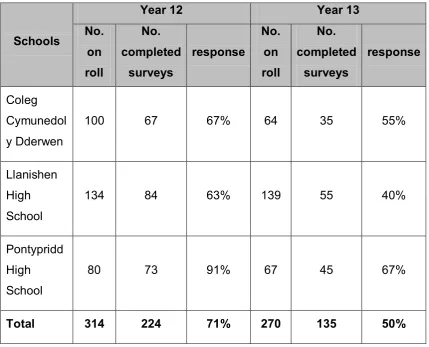
3.21 On the face of it, more completed surveys were received from female sixth-formers in the three schools compared with the number received from males but, proportionally, response was equal (Table 3). This is not the same for school year however, where the survey was
disproportionately completed by Year 12 learners as opposed to those in Year 13 (Table 4). This skew would need to be monitored in the future if the survey is rolled out, so that findings can be claimed to be representative of Year 13 learners as well as those in Year 12.
9 According to the enrolment data provided by the Welsh Government following the
20
Table 3: Representativeness of learners in three schools taking part in the survey: by gender
Schools
Male Female
No. on roll
No. completed
surveys
response
No. on roll
No. completed
surveys
response
Coleg Cymunedol y Dderwen
59 38 64% 105 63 60%
Llanishen High School
144 77 53% 128 59 46%
Pontypridd High School
49 40 82% 98 79 81%
21
Table 4: Representativeness of learners in three schools taking part in the survey: by school year
Schools
Year 12 Year 13
No. on roll
No. completed
surveys
response
No. on roll
No. completed
surveys
response
Coleg Cymunedol y Dderwen
100 67 67% 64 35 55%
Llanishen High School
134 84 63% 139 55 40%
Pontypridd High School
80 73 91% 67 45 67%
Total 314 224 71% 270 135 50%
Response by qualification type and language
22
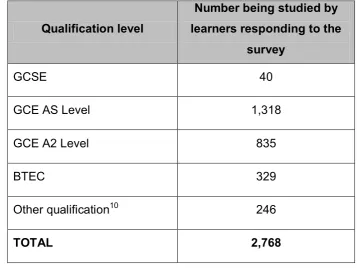
Table 5: Number of qualifications being studied by sixth-form learners responding to the survey
Qualification level
Number being studied by learners responding to the
survey
GCSE 40
GCE AS Level 1,318
GCE A2 Level 835
BTEC 329
Other qualification10 246
TOTAL 2,768
3.23 Of the 816 responses, nine surveys were completed in Welsh, representing 1 per cent of those who participated, as per the main LVW survey in 2014. All responses in Welsh were from sixth-form learners studying at Ysgol Gyfun Rhydywaun, a Welsh-medium school.
Survey metadata
3.24 Data are collected ‘behind the scenes’ of many surveys while fieldwork is ongoing. This ‘meta data’ provides a rich source of
information. The mean length of the pilot survey, for example, was 11 minutes and 10 seconds. The number of ‘drop outs’: that is the number of learners that started the survey but who failed to complete it, was 529, or 40 per cent of those clicking on the link. The majority of these (90 per cent) dropped out at the question asking for their ULN.
10 ‘Other’ qualifications include Advanced Vocational Certificates of Education, the Duke of
23 This might indicate they were unaware they needed it before
beginning and presumably then stopped to seek it out, but a small proportion of teachers testing the link may also be represented in this figure.
3.25 The survey was designed to be compatible with the most popular mobile devices. Coleg Cymunedol y Dderwen had said during the workshop that this would be particularly useful for them because all of their learners are issued with tablets and the school thought they would try to get their sixth-form learners to complete the survey on their tablet while connected to the school WiFi. The meta-data shows that 150 surveys were completed on a mobile device (18 per cent), with three per cent not traceable and the remainder being completed on a desktop computer. This compares with twelve per cent of
24
4.
Learner Datasets
Use of the LLWR to validate learner response
4.1 Learner response to the main Learner Voice Wales survey is validated by ‘live’ and retrospectively matching against their details held on the DfES funded and maintained Lifelong Learning Wales Record (LLWR). This has two benefits:
4.2 Learners can be asked a range of questions about each of the courses that they are recorded as studying on the LLWR;
4.3 Deeper analysis can be conducted by comparing question response to demographic details without needing to ask each learner several more questions, which shortens the survey.
4.4 It was established during the workshop and in the weeks afterward that there is not a comparable dataset for sixth-form students in Wales. While the schools hold the data separately, the multiple datasets are not combined. This reflects the different Welsh
Government data requirements for schools, which are based on an annual census rather than the ongoing data collection methodology used for the LLWR. It was also unclear if the schools held the same data fields as the LLWR, or as each other.
4.5 In order not to delay the survey past the Easter vacation and into the summer term when there are examinations, it was decided to
investigate after fieldwork took place. In the hopes of being able to retrospectively match learner response to the survey to the school datasets, the learners were asked for the school code, their unique learner number (ULN), full name and date of birth. This is different from the main LVW survey in that if the ULN the learner enters at the beginning matches with a ULN held in the LLWR, then their response is live matched to their record in the LLWR and they therefore do not need to enter their name or date of birth.
25 resulted in building several filters based on a comprehensive course list provided to Ipsos MORI by DfES. More is explained about the course-level loop that was built below (see paragraph 4.17).
Obtaining the datasets
4.7 A template dataset with the fields needed to retrospectively match learner responses against was circulated to the schools after the fieldwork period. The fields were selected from the Post-16 PLASC specification, in order to align with the LLWR fields used in the main LVW survey. The template requested learner details in a ‘flat’ rather than ‘stacked’ format, as is usually provided in the LLWR extract for the main survey. A stacked format contains one course per row of data, and thus learners appear multiple times in the dataset. A flat format contains one learner per row of data, and thus learners appear only once in the dataset, with all course information contained in multiple columns per learner. This meant that the data would not need excessive re-formatting and would reduce both the time needed to clean the datasets and the cost.
4.8 The Data Sharing Agreement signed by Ipsos MORI before
26 4.9 Three datasets of sixth-form learner details were received by Ipsos
MORI via the Welsh Government’s secure data exchange portal on 19th May, 2015. The three schools that submitted the datasets were:
Llanishen High School: submitted details for 273 sixth-form learners (or cases);
Pontypridd High School: submitted details for 147 cases;
Coleg Cymunedol y Dderwen (CCyD): submitted 164 cases. 4.10 The steps taken to assess the quality of the datasets and to conjoin
the data are described in the section below.
Quality of the datasets
4.11 The three datasets were merged into one and assessed for having duplicate cases across four fields: the Unique Learner Number (ULN), Forename, Surname and Date of Birth (in that order). No duplications were found. The data in each field that had been filled by the schools was assessed for:
Completeness: whether the field had been filled at all and whether there was data in each field, for each case;
Accuracy: to compare the format of the data given in each field with the expected format.
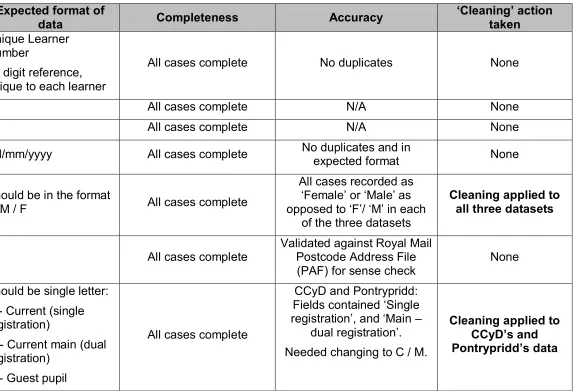
4.12 A summary can be found in the table below (Table 6). Where a field was filled using an unexpected format, the data were then ‘cleaned’ to match the expected format. For example, all date fields should be filled with the dd/mm/yyyy format but some contained a full written date, for example ‘20 September 2014’. In such instances, the data were cleaned to match the expected format. A summary of the ‘cleaning’ action taken per field, for each school, can be seen in the final column of the three tables below.
28
Table 6: Dataset quality
Field in dataset Expected format of
data Completeness Accuracy
‘Cleaning’ action taken
ULN
Unique Learner Number
10 digit reference, unique to each learner
All cases complete No duplicates None
Forename All cases complete N/A None
Surname All cases complete N/A None
Date of Birth Dd/mm/yyyy All cases complete No duplicates and in expected format None
Gender Should be in the format of M / F All cases complete
All cases recorded as ‘Female’ or ‘Male’ as opposed to ‘F’/ ‘M’ in each
of the three datasets
Cleaning applied to all three datasets
Pupil postcode All cases complete Validated against Royal Mail Postcode Address File (PAF) for sense check
None
Enrolment status
Should be single letter: C - Current (single registration)
M - Current main (dual registration)
G - Guest pupil
All cases complete
CCyD and Pontrypridd: Fields contained ‘Single registration’, and ‘Main –
dual registration’. Needed changing to C / M.
29
Date of entry to
current school Dd/mm/yyyy
CCyD: All cases complete Llanishen: Field not completed for any learner
Checked first for dates in the future: none found
Cleaning applied to CCyD’s data as dates
were provided in full written format (e.g. 5
September 2014)
Part-time indicator
This should be in the format of:
True / False
Llanishen and Pontypridd: Field not completed for
any learner
CCyD: All cases completed but recorded as ‘F’: assumed to be ‘false’ for part-time but equally could
have been ‘F’ for full-time.
None
Pupil NC* Year
Group School year, i.e. 12, 13 or 14 All cases complete In expected format: no cleaning required None
Learning Activity
Identifier A two digit reference
Incomplete: all cases blank N/A N/A Learning Activity Reference
Each course that is available for study by sixth-form students in Wales has a unique alpha-numeric code of 8 digits
All students had course code for at least one
course
All courses codes were eight digits N/A Date commenced learning activity
Dd/mm/yyyy Complete where there was a course
Checked first for dates in the future: none found
Pontypridd recorded all cases as 01/09/2014
Cleaning applied to CCyD’s data as dates
were provided in full written format (e.g. 5
30 whether the learner was in
Year 12 or Year 13, which suggests this field is inaccurate
Expected End Date of
Learning Activity
Dd/mm/yyyy Complete where there was a course
Checked first for dates in the future
Pontypridd has recorded all cases as 20/07/2015 whether the learner was in Year 12 or Year 13, which
suggests this field is inaccurate
Cleaning applied to CCyD’s data as dates
were provided in full written format (e.g. 5
September 2014) Actual End Date of Learning Activity Dd/mm/yyyy
CCyD: Some complete, as expected
Llanishen and Pontypridd: none complete, indicating the datasets may be out of
date or inaccurate as it is likely that at least a few students at each school have finished courses
earlier than expected
Checked first for dates in the future and removed if
found
Cleaning applied to CCyD’s data as dates
were provided in full written format (e.g. 5
September
Learning Activity
A one digit reference:
W = Welsh CCyD: Some incomplete
Pontypridd used ‘English’
31
Delivered Through the Medium of Welsh
E = English P = Bilingual
were recorded as studying any courses through the
medium of Welsh)
Provider Delivering Learning
An eight digit
alphanumeric code. If the student is studying a course at a ‘host’ institution, rather than their ‘home’ institution, this will be flagged here.
CCyD: Some incomplete
CCyD and Llanishen: Where complete, all codes
were 8 digit, as expected. Pontypridd: named the provider in full, rather than
using an 8 digit codes CCyD and Pontypridd: Some students receiving
learning at another institution.
None –data in this field for Pontypridd could not be cleaned from the provider name to
the relevant 8 digit code as the codes were not know. This
would be requested from the Welsh Government in future,
if needed.
Completion Status
Indicates whether the student has finished the course.
A one digit reference.
CCyD: Some cases complete, i.e. where there was an ‘Actual End Date of
Learning Activity’
Llanishen and Pontypridd: field filled for all cases
CCyD: ‘Withdrawn’ given for cases where there was an
‘Actual End Date of Learning Activity’. Format
presumed inaccurate as expecting a one digit
reference.
Llanishen: all cases filled with ‘1’, unable to ascertain
if this is accurate. Pontypridd: all cases filled
with ‘Continuing’
CCyD and Pontypridd: Unable to clean as one
32
Fuzzy matching
4.14 After cleaning, the datasets underwent a fuzzy matching process. Fuzzy matching is used to find matching cases in two datasets where no single, unique identifier exists in either (for example, the ULN). The process combines fields in each dataset and attempts to match the combinations: for example name, date of birth and gender. In this instance, matching was undertaken to assess how well the course-level loop worked, given that live-matching could not take place. 4.15 The fuzzy-matching rate for the pilot was high: 98 per cent of the
learners that responded to the survey were matched to the datasets the schools provided. This compares favourably with a
fuzzy-matching rate for the main LVW survey 2015 of 82 per cent. The high match-rate indicates that the data given in the name, date of birth and gender fields by the schools were of very high accuracy. This is to be expected given that:
the schools were provided with the template for the fields that were needed for the match;
that they constructed the dataset purposefully for the pilot; and
the learner population is more stable than that surveyed for the main LVW survey, given that courses are delivered over a set academic year.
33
Validating the course loop
4.17 The course-level loop asks a series of questions for each course that a learner is studying. The course loop for the pilot was built using a list of courses that are delivered by sixth-forms in Wales. It used drop-down filters, in the absence of being able to live-match to a learner dataset. A mock-up of this is presented on the next page.
Question 1: number of courses with which to fill the loop
Question 2: courses being studied
4.18 Fuzzy-matching enabled us to compare the courses sixth-form
34 in the survey by learners at CCyD, Llanishen and Pontypridd was 1,216, compared with 1,267 courses the three schools indicated their learners were studying. This means the loop captured 96 per cent of courses that the schools said were being studied.
4.19 The correct number of courses were entered into the loop by 191 learners but 162 entered too few (or too many) compared with the courses the schools had on record. Of the 162 students that did not enter the correct number of courses into the loop 70 (43 per cent) resorted to recording one of more of their courses as ‘Other’. Of those who did enter the correct number of courses into the loop, 75 (39 per cent) also chose ‘Other’ for one or more courses. This could indicate that the learners:
could not find their course in the list; or
did not know what the qualification type and/or course description was, in order to find it.
4.20 If the first, this would mean that the courses available in the loop are not definitive. Asking students to describe the courses in an ‘Other specify’ field afterward would help to improve accuracy of recording as responses could then be back-coded into the list, or the list could be extended. The back-coding would have an associated cost but would improve the ability to report findings against courses and qualification type.
Weighting the data
4.21 The data could not be weighted for the pilot as only three datasets of learners’ data were received, after the survey data had been
processed and analysis completed. However, given the completeness and accuracy of the data from the three schools, within-school
35 particularly important given the skew in response by school year that emerged in the pilot.
36
5.
Reporting and findings
School level reports
5.1 One of the aims of the pilot was to assess how well the reporting processes used for the main LVW survey would work in a school setting and how useful the schools would find the reports in assessing sixth-formers’ satisfaction. In order to deliver findings within the school year, the depth of reporting provided on the main LVW survey was not possible, given that the pilot fieldwork took place much later. However the schools were provided with three different reports, which are detailed below.
5.2 As mentioned previously, the data are not weighted so the schools were instructed to use the findings as an indication of sixth-form satisfaction only, rather than as being truly representative of the strength of feeling with their school.
PowerPoint report
5.3 A 27 page PowerPoint deck was produced for each of the eight participating schools, containing:
The number of completed surveys by gender, year group,
qualification level, ethnicity and first and second tier sector subject areas (for further detail on these see paragraphs 5.11 to 5.14 );
Composite scores for each of the five themes mentioned at paragraph 2.3;
The percent of students responding ‘very good’ through to ‘very poor’ for each question (or the scale that was used);
37
Comparison of the per cent saying ’very good’ within the school against a benchmark11;
Tables for the three Welsh language questions.
Excel report
5.4 An Excel sheet was produced for each school, showing response from ‘Very good’ to ‘Very poor’ (or applicable scale) for each question, by gender, school year group, qualification levels and first and second tier SSAs. Where fewer than five learners were studying a
qualification level and first or second tier SSA, the scores for the questions were supressed to ensure learner anonymity.
5.5 The Excel sheet was provided in lieu of the giving the schools access to the Reportal (an online interactive reporting tool), which is available to providers participating in the main LVW survey. Feedback on the Excel sheet is provided at paragraph 6.12 below.
Report of verbatim comments
5.6 Finally, each of the participating schools was provided with the
verbatim comments given by their sixth-form learners at the two open-ended questions in the survey (Q10 and Q11). These were manually cleaned by an experienced coding team using specialist software to correct spelling and grammatical errors, remove obscenities and redact student and teacher names (to protect anonymity). A flag was added to indicate where a comment might have indicated a
safeguarding concern12. Where a student responded in Welsh, the
responses were checked by a Welsh-speaking researcher for obscenities, names and safeguarding concerns but not otherwise translated.
11 The benchmark is the average per cent of ‘very good’ responses to each question by all
816 learners that answered the survey.
12 For example where a learner indicated that they were at risk of harm, either from
38
Reporting conventions
Rules of suppression
5.7 In line with research codes of conduct 13, all data was subject to rules
of suppression meaning that learner-level details were withheld to ensure that data remained anonymous where it might have been possible for a learner to be identified. Findings were also not reported if five or fewer learners were studying a particular Sector Subject Area (discussed in more detail below at paragraph 5.11), given the risk of identification this could pose and the need to avoid schools
approaching the learners to ask about the rating they gave.
5.8 Rules of suppression do not mean that any learners were excluded from the dataset, but only that it was not possible to breakdown data to certain specific levels.
Benchmarks and composite scores
5.9 Benchmarks were provided to the schools for most questions or themes so that the schools could compare their results against the average ‘very good’ response. This average is based on all sixth-form learners across the eight schools that participated. However, the benchmarks should be treated as indicative only, given that the profile of learners that participated was not representative at the school or national level and because the data are not weighted.
5.10 Composite scores were created to help summarise the views of learners across a battery of questions relating to the same theme. They are calculated at the individual level, taking an average of a learner’s response to each of the questions within that theme. The scores are discussed in more detail below (at paragraphs 5.17 and 5.18).
13 Adhering to the Data Protection Act (1998) and the Market Research Society code of
39
Sector Subject Areas
5.11 The main LVW survey reports on first tier Sector Subject Areas (SSAs) only (a list of first and second tier SSAs can be found at
Annex C). Given that schools deliver a narrower range of courses that fall under fewer first-tier SSAs than FE providers, which tend to offer a broader range of vocational qualifications, it was felt that reporting by second tier SSAs would prove more useful. In order to report by SSAs, each course on the list used to build the course-level loop needed to be allocated to a first and second tier SSA. This was done manually as no definitive list existed, with DfES making the final decision on where to allocate some of the courses that proved difficult to categorise.
5.12 As the PowerPoint report was intended as an overview of findings and the Excel report to provide more detail, the findings were broken down by more SSAs in the Excel report than in the PowerPoint. For
example, ‘Media and arts’ was broken down into three second-tier SSAs in the PowerPoint report but by five in the Excel report. In total, there are 16 first-tier SSAs in the PowerPoint report and 17 in the Excel report, while there are 22 second-tier SSAs in the PowerPoint and 36 in the Excel.
40 Arabic. The second-tier ‘Languages of the British Isles’ was not used in either report as it was not descriptive enough.
5.14 In both reports, some SSAs were renamed for simplicity when reporting, for example ‘Arts, Media and Publishing’ became ‘Media and arts’.
Findings
Overall satisfaction
5.15 Two questions in the main LVW survey are used to determine
learners’ overall satisfaction. The first, Q8, asks learners to rate their provider14 overall (by use of a six-point range from ‘very good’ to very poor’). Fifty-seven per cent of sixth-form learners answered ‘very good’ or ‘good’.
5.16 The second question, Q9 asks if their course(s) are what they expected. Responses to this question are ‘better than I expected’, ‘about what I expected’, ‘worse than I expected’ and ‘did not have any expectations’. Seventy-seven per cent of sixth-form learners said their courses were ‘better’ or ‘as expected’.
Composite scores
5.17 Teaching and Training, which is calculated from responses to the battery of questions forming Q6 and which are asked for each course being studied (in the course-level loop) was the theme with the
highest proportion of ‘very good’ responses (62 per cent). Information and Advice, calculated from responses to Q1 and Q2 was rated the lowest (19 per cent said ‘very good’). The remaining three themes scored as follows:
Help and support (calculated from responses to Q3): 34 per cent;
41
Health and Wellbeing (calculated from responses to Q4): 39 per cent; and
Responsiveness (calculated from responses to Q5): 31 per cent. 5.18 These findings can be used by the schools to determine broad areas
for improvement, in order to provide an all-round satisfactory learning experience to their sixth-form students. If the findings were replicated at a national level following the roll-out of the survey to all sixth-forms in Wales, then it would indicate that the provision of information and advice would need most improvement.
‘Very good’ versus ‘Good’ responses
5.19 It was noted that the sixth-form learners participating in the pilot were more likely to offer a ‘good’ response across the questions, compared with ‘very good’. It is outside the scope of this research to explain why this might be the case.
This Does Not Apply to Me (TDNATM)
5.20 A higher proportion of sixth-form learners chose ‘This does not apply to me’ (where available) than is usually the case for the main LVW survey, which could indicate that these questions do not resonate with sixth-form learners particularly well. Rather than remove these
responses from the base, as happens when reporting for the main survey, it was decided to leave them in the PowerPoint reports so as to help the Welsh Government decide whether they should be
included in the future.
42
Sector Subject Areas
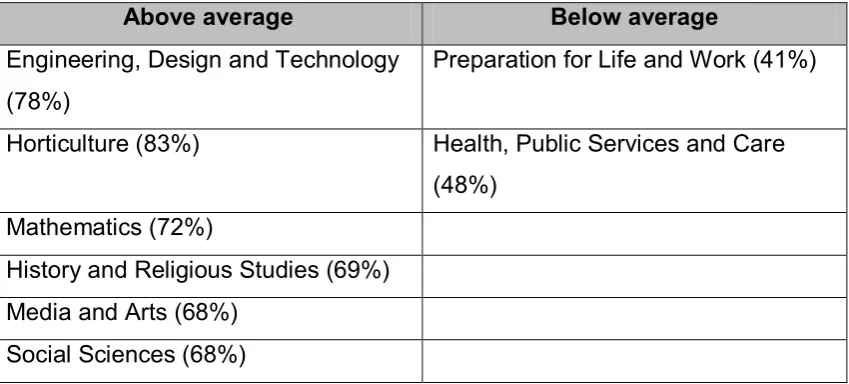
5.22 The ‘very good’ responses to the composite themes and Q8 (overall satisfaction) were broken down in the PowerPoint report by first and second tier Sector Subject Areas. The score was then indicated in green if it was six or more percentage points above the benchmark and indicated in red if six or less percentage points below the average. Scores within six points of the average were left white. 5.23 As mentioned above, Teaching and Training received the highest
[image:54.595.87.512.377.569.2]proportion of ‘very good’ responses, compared with the other themes. The first-tier Sector Subject Areas with an above and below average response for Teaching and Training15 are presented in the table below.
Table 7: First-tier SSAs with above and below average ‘very good’ responses to Teaching and Training
Above average Below average
Engineering, Design and Technology (78%)
Preparation for Life and Work (41%)
Horticulture (83%) Health, Public Services and Care (48%)
Mathematics (72%)
History and Religious Studies (69%) Media and Arts (68%)
Social Sciences (68%)
Verbatim responses
5.24 There were two open-ended questions included in the survey. Question 10, which asked learners to comment on the best thing about their provider, was answered by 352 sixth-form learners.
Question 11, which asked what could be improved, was answered by
43 38116. Analysis was conducted to compare these verbatim responses
against those given by Further Education learners in the main
2014/15 LVW survey.17 For this purpose, the responses were coded against five categories, for both questions 10 and 11. The five meta-codes for each of Q10 and Q11 are given below, alongside the types of things mentioned by the sixth-form learners that took part in the survey.
16 Not included in the base: completed surveys where learners did not provide any verbatim
response, learners that said ‘don’t know’ or ‘nothing’ and three nondescript responses that could not be categorised.
17 Data for the Schools Pilot was analysed through manual coding. Data for the main FE
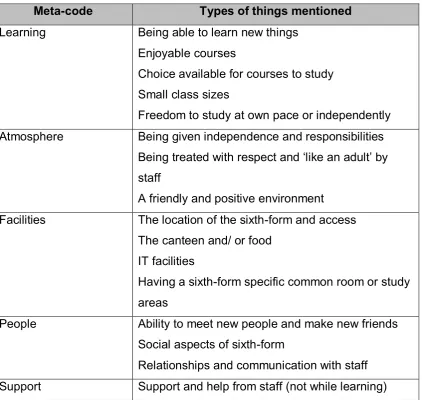
44
Table 8: Question 10 categories: things mentioned by sixth-formers that they like best
Meta-code Types of things mentioned
Learning Being able to learn new things Enjoyable courses
Choice available for courses to study Small class sizes
Freedom to study at own pace or independently Atmosphere Being given independence and responsibilities
Being treated with respect and ‘like an adult’ by staff
A friendly and positive environment Facilities The location of the sixth-form and access
The canteen and/ or food IT facilities
Having a sixth-form specific common room or study areas
People Ability to meet new people and make new friends Social aspects of sixth-form
45
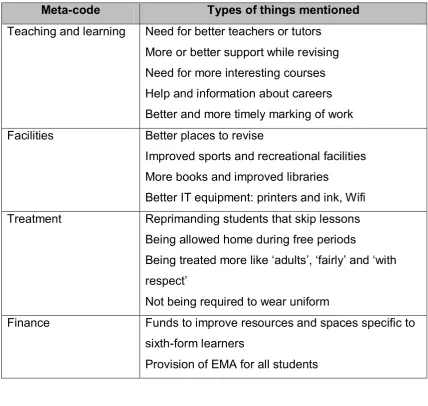
Table 9: Question 11 categories: things mentioned by sixth-formers that they would like to be improved
Meta-code Types of things mentioned
Teaching and learning Need for better teachers or tutors More or better support while revising Need for more interesting courses Help and information about careers Better and more timely marking of work Facilities Better places to revise
Improved sports and recreational facilities More books and improved libraries
Better IT equipment: printers and ink, Wifi Treatment Reprimanding students that skip lessons
Being allowed home during free periods
Being treated more like ‘adults’, ‘fairly’ and ‘with respect’
Not being required to wear uniform
Finance Funds to improve resources and spaces specific to sixth-form learners
Provision of EMA for all students
5.25 It is important to note that only very broad comparisons between these two learner groups can be drawn, given that response to the sixth-form survey was not representative and relies on far fewer responses than for the main survey. In terms of their response to Q10, both sixth-form and FE learners said that the best thing about their provider was the learning experience. However, the proportion of learners mentioning this was higher in the FE sector: just over half (51 per cent) of FE learners in 2014/15 referred to aspects relating to ‘learning’, as compared with 41 per cent of sixth-formers.