SB 47/2015 13 August 2015
Initial Teacher Training in Wales, 2013/14
This bulletin provides information about students on courses of Initial Teacher Training (ITT) leading to Qualified Teacher Status (QTS) in 2013/14. It mainly focuses on information about students on courses provided through higher education institutions (HEIs) in Wales.
Following an internal assessment and a subsequent review, published in 2006, the Welsh Government has been reducing the number of new entrants to ITT courses to better meet the needs of maintained schools in Wales.
In 2013/14, numbers stayed at 750 for Primary phase and decreased from 930 to 880 for Secondary phase. Both primary phase undergraduate courses and postgraduate courses stayed the same.
Secondary phase undergraduate courses stayed at 95, but postgraduate courses were reduced from 835 to 785. These figures do not include an additional 25 postgraduate secondary places at the Open
University.
There are alternative employment-based routes to obtaining QTS but these are not covered in this bulletin. The data included here are taken from the Higher Education Statistics Agency’s (HESA) Student Record. Unless otherwise stated, comparisons are with 2012/13 figures.
Key points
There has been a year on year decline in first year enrolments on ITT courses in Wales in recent
years, but this must be viewed in the context of the policy to reduce the number of new entrants to ITT courses.
There were 1,650 first year enrolments on ITT courses in Wales, five per cent lower than in 2012/13
and 29 per cent lower than in 2005/06.
The number of first year Welsh domiciled students enrolled on ITT courses in Wales decreased by
four per cent over the last year to 1,370. There was a seven per cent decrease in enrolments from outside Wales.
83 per cent of first year students on ITT courses in Wales were Welsh domiciled, one per cent higher
than in 2012/13 and six percentage points higher than in 2005/06.
The number of students completing ITT courses in Wales was three per cent lower than in 2012/13.
Of these completers, 21 per cent completed a course that either enabled them to teach bilingually or led to a formal certificate of bilingual education, four percentage points higher than in 2012/13.
Statistician: IanShipley Tel: 029 2082 3528 E-mail: [email protected]
Next update: August 2016 (Provisional)
Policy context
Each year the Welsh Government sets intake targets for recruitment to ITT courses in Wales. Following an internal assessment and subsequent review, the Welsh Government has, since 2004/05, been
reducing the number of new entrants to ITT courses to better meet the needs of maintained schools in Wales. The Review of ITT Provision in Wales was held in 2005/06 and reported in January 2006. A copy of the report can be seen on the Welsh Government’s website at:
Welsh Government: ITT Provision Report
Following this, the then Minister for Education, Lifelong Learning and Skills published a statement on 29 March 2006 setting out an ITT Change Plan to restructure ITT so that intake targets, courses and course availability could deliver teachers with Qualified Teacher Status to better meet the needs of maintained schools in Wales. A copy of this can be seen on the National Assembly for Wales’s website at:
National Assembly for Wales: Statement on ITT Restructuring
The intake targets set by the Welsh Government are notified to the Higher Education Funding Council for Wales (HEFCW). HEFCW allocates the total intake figures, varying the figures within agreed limits if necessary, to individual institutions. Further details can be found on the HEFCW website at:
HEFCW: Intake Targets
Section A: ITT students and qualifiers from Welsh HEIs
Chart A.1: First year students on ITT courses in Wales by phase
Between 2012/13 and 2013/14, first year enrolments on Primary phase courses in Wales decreased
slightly to 765, a two percent decrease on the previous year (Table A.1).
Enrolments on Secondary phase courses decreased by eight per cent to 885, after a three per cent
Chart A.2: First year ITT students in Wales, by country of domicile (a)
(a) Other includes Scotland, Northern Ireland, UK unknown, Republic of Ireland, Other EU, Other Europe and Other Overseas
The number of all first year enrolments on ITT courses (1,650) was five per cent lower than the
previous year and 29 per cent lower than in 2005/06, (Table A.2).
The number of first year Welsh domiciled students enrolled on ITT courses in Wales decreased by
four per cent over the last year to 1,370. There was a seven per cent decrease in enrolments from outside Wales.
83 per cent of first year ITT students were Welsh domiciled and 14 per cent were English domiciled
(Table A.2).
First year female enrolments decreased by seven per cent in the past year whilst first year male
enrolments decreased by two per cent (Table A.1).
Compared with five years earlier both first year female and first year male enrolments have
decreased, female enrolments by 24 per cent and male enrolments by six per cent (Table A.1).
First year ITT students by level of study, language, ethnicity and age
In 2013/14, 78 per centof first year ITT students were enrolled on PGCE courses, one per cent higher
than the previous year, and 12 percentage points higher than in 2005/06. (Table A.1).
19 per cent of first year ITT students opted to take a course that either enables them to teach
bilingually or leads to a formal certificate of bilingual education, two percentage points higher than in 2012/13 (Table A.1).
94 per cent of first year ITT students recorded their ethnicity as white in 2013/14, while 54 per cent of
students were aged between 21 and 24, a one percent decrease from the previous year. (Table A.3).
Chart A.4: First year ITT students in Wales, by secondary subject grouping 2013/14
The highest proportions of first year Secondary phase enrolments were Mathematics (13 per cent)
and English (12 per cent).(Table A.4).
Biology accounted for six per cent of all first year enrolments to Secondary phase ITT courses
compared to five per cent for Chemistry and three percent for Physics and General Science.
Business studies made up only one per cent of all first year enrolments to Secondary phase ITT
courses.
All students on ITT courses in 2013/14
In total, 2,365 students were enrolled on ITT courses in Welsh HEIs, a decrease of four per cent from
Students completing ITT courses in 2013/14
The number of students completing ITT courses in Welsh HEIs was 1,425, three per cent lower than
in 2012/13 (Table A.6).
78 per cent of students in Welsh HEIs completing ITT courses were from PGCE courses (Table A.6).
21 per cent of students (255) in Welsh HEIs completed a course that either enabled them to teach
bilingually or led to a formal certificate of bilingual education, three percentage points higher than in
2012/13 (Table A.6).
Section B: Welsh domicile ITT students
First year Welsh domicile ITT students at UK HEIs, 2013/14
There were 1,805 Welsh domiciled entrants onto ITT courses at UK HEIs. Of those, 76 per cent were
enrolled at a Welsh HEI. The rest were almost entirely studying at English HEIs (Table B.1).
The number of male Welsh domiciled entrants onto PGCE courses at Welsh HEIs was six per cent
higher than in 2012/13, however the corresponding number of females was six per cent lower over
the same period (Table B.1).
All students on ITT courses, 2013/14
In total, there were 2,655 Welsh domiciled enrolments onto ITT courses. Of these 73 per cent were
enrolled at a Welsh HEI and 57 per cent of these students were enrolled on a PGCE course while the
rest were enrolled on a first degree leading to QTS (Table B.2).
Section C: All ITT students and qualifiers from English HEIs
First year ITT students in English HEIs, 2013/14
The number of all first year enrolments to English HEIs in 2013/14 was 24,260, a 13 per cent decrease
on the previous year, and 24 per cent lower than in 2005/06 (Table C.1).
The majority of first year ITT students at English HEIs were female, 73 per cent (Table C.1).
All students on ITT courses at English HEIs in 2013/14
There were 40,600 students enrolled on ITT courses at English HEIs, of these 51 per cent were
enrolled on a PGCE and 77 per cent were female. (Table C.2).
Students completing ITT courses in 2013/14
25,490 students completed ITT courses in England in 2012/13. Of these completers, 79 per cent
Tables
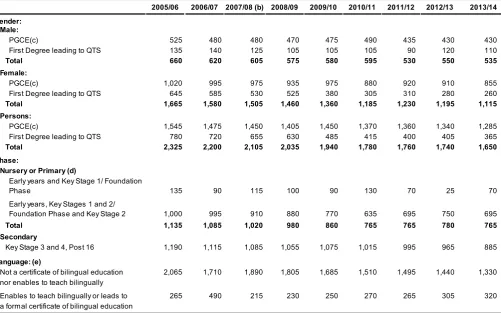
Table A.1: First year students on ITT courses in Wales, by gender, level of study, phase and language (a)
2005/06 2006/07 2007/08 (b) 2008/09 2009/10 2010/11 2011/12 2012/13 2013/14 Gender:
Male:
PGCE(c) 525 480 480 470 475 490 435 430 430 First Degree leading to QTS 135 140 125 105 105 105 90 120 110
Total 660 620 605 575 580 595 530 550 535 Female:
PGCE(c) 1,020 995 975 935 975 880 920 910 855 First Degree leading to QTS 645 585 530 525 380 305 310 280 260
Total 1,665 1,580 1,505 1,460 1,360 1,185 1,230 1,195 1,115 Persons:
PGCE(c) 1,545 1,475 1,450 1,405 1,450 1,370 1,360 1,340 1,285 First Degree leading to QTS 780 720 655 630 485 415 400 405 365
Total 2,325 2,200 2,105 2,035 1,940 1,780 1,760 1,740 1,650 Phase:
Nursery or Primary (d)
Early years and Key Stage 1/ Foundation
Phase 135 90 115 100 90 130 70 25 70 Early years, Key Stages 1 and 2/
Foundation Phase and Key Stage 2 1,000 995 910 * 880 * 770 * 635 * 695 * 750 * 695
Total 1,135 1,085 1,020 980 860 765 765 780 765 Secondary
Key Stage 3 and 4, Post 16 1,190 1,115 1,085 1,055 1,075 1,015 995 965 885
Language: (e)
Not a certificate of bilingual education 2,065 1,710 1,890 1,805 1,685 1,510 1,495 1,440 1,330 nor enables to teach bilingually
Enables to teach bilingually or leads to 265 490 215 230 250 270 265 305 320 a formal certificate of bilingual education
Source:Higher Education Statistics Agency (HESA) (a) Enrolments throughout the year.
(b) From 2007/08 students w ho w ere studying at the Open University and w ere funded by HEFCW are included in the figures.
(c) PGCE includes Postgraduate Certificate in Education, Professional Graduate Certificate in Education and Postgraduate Diploma in Education.
and Key Stage1/ Foundation Phase.
certificate of bilingual education'. (f) Data are rounded to the nearest 5.
(d) In 2006/07 one institution incorrectly coded some students to the Early years, Key Stages 1 and 2/Key Stage 2 instead of the Early years
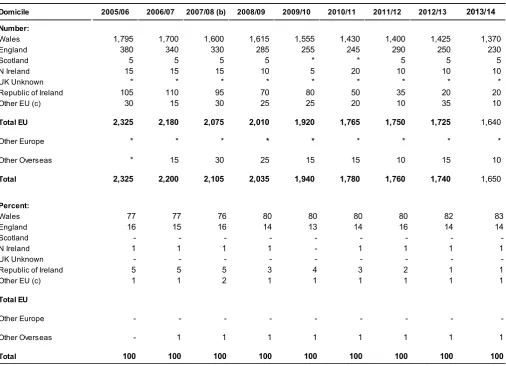
Table A.2: First year students on ITT courses in Wales, by country of domicile (a)
Domicile 2005/06 2006/07 2007/08 (b) 2008/09 2009/10 2010/11 2011/12 2012/13 2013/14
Number:
Wales 1,795 1,700 1,600 1,615 1,555 1,430 1,400 1,425 1,370
England 380 340 330 285 255 245 290 250 230
Scotland 5 5 5 5 * * 5 5 5
N Ireland 15 15 15 10 5 20 10 10 10
UK Unknown * * * * * * * * *
Republic of Ireland 105 110 95 70 80 50 35 20 20
Other EU (c) 30 15 30 25 25 20 10 35 10
Total EU 2,325 2,180 2,075 2,010 1,920 1,765 1,750 1,725 1,640
Other Europe * * * * * * * * *
Other Overseas * 15 30 25 15 15 10 15 10
Total 2,325 2,200 2,105 2,035 1,940 1,780 1,760 1,740 1,650
Percent:
Wales 77 77 76 80 80 80 80 82 83
England 16 15 16 14 13 14 16 14 14
Scotland - - -
-N Ireland 1 1 1 1 - 1 1 1 1
UK Unknown - - -
-Republic of Ireland 5 5 5 3 4 3 2 1 1
Other EU (c) 1 1 2 1 1 1 1 1 1
Total EU
Other Europe - - -
-Other Overseas - 1 1 1 1 1 1 1 1
Total 100 100 100 100 100 100 100 100 100*
Source: Higher Education Statistics Agency (HESA) (a) Enrolments throughout the year. Percentages may not add to 100 due to rounding.
(b) From 2007/08 students w ho w ere studying at the Open University and w ere funded by HEFCW are included in the figures. (c) Includes Channel Islands and Isle of Man.
(d) 0, 1, 2 are rounded to 0 and represented as ‘*’. (e) All other numbers are rounded to the nearest 5.
(f) Percentages have been calculated using precise raw numbers. Percentages less than 0.5 per cent are represented by ‘-‘.
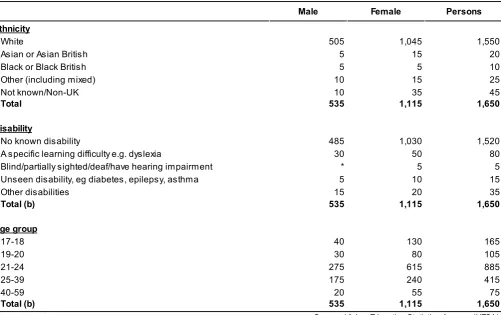
Table A.3: First year students on ITT courses in Wales, by ethnicity, disability status and age, 2013/14 (a)
Male Female Persons
Ethnicity
White 505 1,045 1,550
Asian or Asian British 5 15 20
Black or Black British 5 5 10
Other (including mixed) 10 15 25
Not known/Non-UK 10 35 45
Total 535 1,115 1,650
Disability
No known disability 485 1,030 1,520
A specific learning difficulty e.g. dyslexia 30 50 80
Blind/partially sighted/deaf/have hearing impairment * 5 5
Unseen disability, eg diabetes, epilepsy, asthma 5 10 15
Other disabilities 15 20 35
Total (b) 535 1,115 1,650
Age group
17-18 40 130 165
19-20 30 80 105
21-24 275 615 885
25-39 175 240 415
40-59 20 55 75
Total (b) 535 1,115 1,650
Source: Higher Education Statistics Agency (HESA) (a) Enrolments throughout the year.
(b) Total includes unknow n.
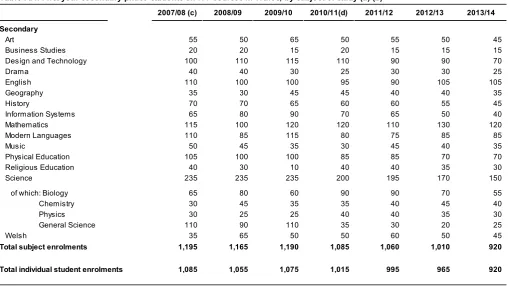
Table A.4: First year secondary phase students on ITT courses in Wales, by subject of study (a) (b)
2007/08 (c) 2008/09 2009/10 2010/11(d) 2011/12 2012/13 2013/14
Secondary
Art 55 50 65 50 55 50 45
Business Studies 20 20 15 20 15 15 15
Design and Technology 100 110 115 110 90 90 70
Drama 40 40 30 25 30 30 25
English 110 100 100 95 90 105 105
Geography 35 30 45 45 40 40 35
History 70 70 65 60 60 55 45
Information Systems 65 80 90 70 65 50 40
Mathematics 115 100 120 120 110 130 120
Modern Languages 110 85 115 80 75 85 85
Music 50 45 35 30 45 40 35
Physical Education 105 100 100 85 85 70 70
Religious Education 40 30 10 40 40 35 30
Science 235 235 235 200 195 170 150
of which: Biology 65 80 60 90 90 70 55
Chemistry 30 45 35 35 40 45 40
Physics 30 25 25 40 40 35 30
General Science 110 90 110 35 30 20 25
Welsh 35 65 50 50 60 50 45
Total subject enrolments 1,195 1,165 1,190 1,085 1,060 1,010 920
Total individual student enrolments 1,085 1,055 1,075 1,015 995 965 920
Source: Higher Education Statistics Agency (HESA) (a) Enrolments throughout the year.
under both subjects. This table provides tw o lines, the number of subject enrolments and the number of individual student
(c) Students w ho w ere studying at the Open University and w ere funded by HEFCW are included in the figures.
specific. Providers w ere told that chemistry and physics subjects could be linked w ith w ider science content, but only courses (b) Students may be recorded under more than one subject e.g. if a student studies Mathematics and IT then that student w ill appear
enrolments. The number of individual student enrolments matches the secondary phase totals in Table A.1.
(d) From 2010/11 the ITT intake targets in respect of science (previously one figure for all science courses) have become more
w here chemistry or physics w ere the main component w ould qualify for inclusion in the priority subject intake grouping. Providers
(f) From 2012/13 students studying 'Information Technology' are now coded as studying 'Information Systems'. (e) All numbers are rounded to the nearest 5.
courses are being recorded, rather than changes in enrolment patterns.
Table A.5: Students on courses of ITT in Wales, by gender, level of study and phase, 2013/14
Male Female Persons
Level:
PGCE(b) 450 880 1,330
First Degree leading to QTS 265 770 1,035
Total 715 1,650 2,365
Phase:
Nursery or Primary 330 1,005 1,335
Early years and Key Stage 1/ Foundation Phase 10 70 80
Early years, Key Stages 1 and 2/ Foundation phase and Key Stage 2 320 935 1,255
Secondary
Key Stages 3 and 4, Post-16 380 650 1,030
Total 715 1,650 2,365
Source: Higher Education Statistics Agency (HESA) (a) Enrolments throughout the year.
Education.
(c) All numbers are rounded to the nearest 5.
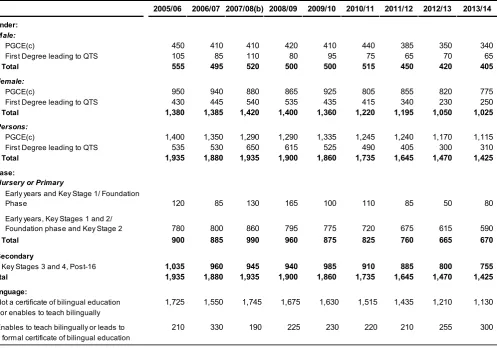
Table A.6: Students completing ITT courses in Wales, by gender, level of study, phase and language (a) (Please refer to revisions section of the notes)
2005/06 2006/07 2007/08(b) 2008/09 2009/10 2010/11 2011/12 2012/13 2013/14
Gender: Male:
PGCE(c) 450 410 410 420 410 440 385 350 340 First Degree leading to QTS 105 85 110 80 95 75 65 70 65
Total 555 495 520 500 500 515 450 420 405
Female:
PGCE(c) 950 940 880 865 925 805 855 820 775 First Degree leading to QTS 430 445 540 535 435 415 340 230 250
Total 1,380 1,385 1,420 1,400 1,360 1,220 1,195 1,050 1,025
Persons:
PGCE(c) 1,400 1,350 1,290 1,290 1,335 1,245 1,240 1,170 1,115 First Degree leading to QTS 535 530 650 615 525 490 405 300 310
Total 1,935 1,880 1,935 1,900 1,860 1,735 1,645 1,470 1,425
Phase:
Nursery or Primary
Early years and Key Stage 1/ Foundation
Phase 120 85 130 165 100 110 85 50 80 Early years, Key Stages 1 and 2/
Foundation phase and Key Stage 2 780 800 860 795 775 720 675 615 590
Total 900 885 990 960 875 825 760 665 670
Secondary
Key Stages 3 and 4, Post-16 1,035 960 945 940 985 910 885 800 755 Total 1,935 1,880 1,935 1,900 1,860 1,735 1,645 1,470 1,425
Language:
Not a certificate of bilingual education 1,725 1,550 1,745 1,675 1,630 1,515 1,435* 1,210 1,130
nor enables to teach bilingually ** * *
Enables to teach bilingually or leads to 210 330 190 225 230 220 *210 255 300 a formal certificate of bilingual education
Source: Higher Education Statistics Agency (HESA) (a) All student enrolments associated w ith an aw ard of an ITT qualification during the academic year.
(b) From 2007/08 students w ho w ere studying at the Open University and w ere funded by HEFCW are included in the figures.
Table B.1: First year Welsh domicile ITT students at UK HEIs, by country of institution, level of study and
gender (a)
2005/06 2006/07 2007/08(b) 2008/09 2009/10 2010/11 2011/12 2012/13 2013/14
Studying in Welsh HEIs Male:
PGCE(c) 385 355 340 350 370 375 320 325 340 First Degree leading to QTS 105 115 90 85 75 85 70 95 90
Total 490 470 430 435 445 460 390 420 435
Female:
PGCE(c) 780 760 735 740 800 710 760 775 725 First Degree leading to QTS 525 470 435 440 310 260 250 230 210
Total 1,305 1,230 1,170 1,180 1,110 970 1,010 1,005 935
Persons:
PGCE(c) 1,165 1,115 1,075 1,095 1,170 1,085 1,080 1,100 1,070 First Degree leading to QTS 630 585 525 525 385 345 320 330 300
Total 1,795 1,700 1,600 1,615 1,555 1,430 1,400 1,425 1,370
Studying in English HEIs Male:
PGCE(c) 125 100 105 115 110 100 105 100 95 First Degree leading to QTS 20 15 10 15 15 15 20 35 20
Total 145 115 115 130 125 115 125 135 115
Female:
PGCE(c) 225 230 210 205 220 215 205 235 240 First Degree leading to QTS 70 90 50 50 55 90 65 115 80
Total 295 320 260 255 275 310 270 345 320
Persons:
PGCE(c) 350 330 310 320 325 315 310 335 335 First Degree leading to QTS 90 105 65 65 70 105 85 145 105
Total 445 435 375 385 400 420 395 480 435
Total (d) 2,245 2,135 1,980 2,005 1,955 1,850 1,795 1,905 1,805
(a) Enrolments throughout the year.
(c) PGCE includes Postgraduate Certificate in Education, Professional Graduate Certificate in Education and Postgraduate Diploma in Education.
(d) Some years include a small number of enrolments at Scottish HEIs. (e) All numbers are rounded to the nearest 5.
(b) From 2007/08 students at the Open University w ho w ere funded by HEFCW are included under ‘Studying in Welsh HEIs’ rather than ‘Studying in English HEIs’. Please refer to the notes for further explanation.
Table B.2: All Welsh domicile ITT students at UK HEIs, by Country of Institution, level of study and gender (a)
2005/06 2006/07 2007/08 (b) 2008/09 2009/10 2010/11 2011/12 2012/13 2013/14
Studying in Welsh HEIs Male
PGCE(c) 390 365 350 365 380 390 335 340 360 First Degree leading to QTS 290 275 270 240 220 200 185 210 215
Total 680 640 620 610 600 590 525 550 575
Female * * * *
PGCE(c) 790 780 750 775 820 725 785 800 750 First Degree leading to QTS 1,520 1,455 1,325 1,250 1,075 910 750 660 625
Total 2,310 2,235 2,075 2,020 1,895 1,640 1,535 1,460 1,375
Persons * * * *
PGCE(c) 1,180 1,145 1,100 1,140 1,200 1,120 1,120 1,140 1,110 First Degree leading to QTS 1,810 1,730 1,590 1,490 1,295 1,110 940 870 840
Total 2,990 2,875 2,695 2,630 2,500 2,230 2,060 2,010 1,945
Studying in English HEIs
Male * * * *
PGCE(c) 145 115 115 125 125 105 110 110 105 First Degree leading to QTS 45 40 45 45 50 50 50 60 70
Total 190 160 160 170 175 155 160 170 175
Female * * * *
PGCE(c) 250 250 225 225 230 235 215 240 255 First Degree leading to QTS 250 275 225 200 165 195 215 280 275
Total 500 525 450 420 400 430 435 520 530
* * * *
Persons * * * *
PGCE(c) 390 365 340 345 360 340 330 350 360 First Degree leading to QTS 295 315 270 245 215 245 265 340 345
Total 690 680 610 590 575 585 595 690 705
Total (d) 3,685 3,560 3,305 3,225 3,075 2,815 2,655 2,705 2,655 Source: Higher Education Statistics Agency (HESA) (a) Enrolments throughout the year.
(c) PGCE includes Postgraduate Certificate in Education, Professional Graduate Certificate in Education and Postgraduate Diploma in Education.
(d) Some years include a small number of enrolments at Scottish HEIs. (e) All numbers are rounded to the nearest 5.
English HEIs’. Please refer to the notes for further explanation.
2005/06 2006/07 2007/08 (b) 2008/09 2009/10 2010/11 2011/12 2012/13 2013/14
Male:
PGCE(c) 7,060 6,625 6,425 6,640 7,110 7,210 6,345 6,320 5,505 First Degree leading to QTS 1,285 1,155 1,180 1,100 1,295 1,350 1,190 1,075 960
Total 8,345 7,775 7,605 7,740 8,405 8,560 7,540 7,395 6,460 Female:
PGCE(c) 16,635 16,140 15,550 15,390 16,075 15,875 14,955 15,145 13,200 First Degree leading to QTS 6,850 6,725 6,420 6,465 6,655 6,230 6,015 5,325 4,600
Total 23,485 22,865 21,970 21,855 22,730 22,105 20,970 20,470 17,800 Persons:
PGCE(c) 23,690 22,760 21,975 22,030 23,185 23,085 21,300 21,465 18,705 First Degree leading to QTS 8,135 7,880 7,600 7,565 7,950 7,580 7,210 6,400 5,555
Total 31,830 30,640 29,575 29,595 31,135 30,665 28,510 27,865 24,260 Source: Higher Education Statistics Agency (HESA) (a) Enrolments throughout the year.
(b) From 2007/08 students w ho w ere at the Open University and funded by HEFCW w ere excluded from this table (please refer to the notes).
[image:14.595.43.563.71.233.2](c) PGCE includes Postgraduate Certificate in Education and Professional Graduate Certificate in Education. (d) All numbers are rounded to the nearest 5.
Table C.1: First year students on ITT courses in England, by level of study (a)
Male Female Persons
Level:
PGCE(b) 6,010 14,695 20,705
First Degree leading to QTS 3,255 16,635 19,895
Total 9,270 31,330 40,600
Source: Higher Education Statistics Agency (HESA) (a) Enrolments throughout the year.
[image:14.595.41.438.331.400.2](c) All numbers are rounded to the nearest 5.
Table C.2: All students on courses of ITT in England, by gender and level of study 2013/14 (a)
(b) PGCE includes Postgraduate Certificate in Education and Professional Graduate Certificate in Education.
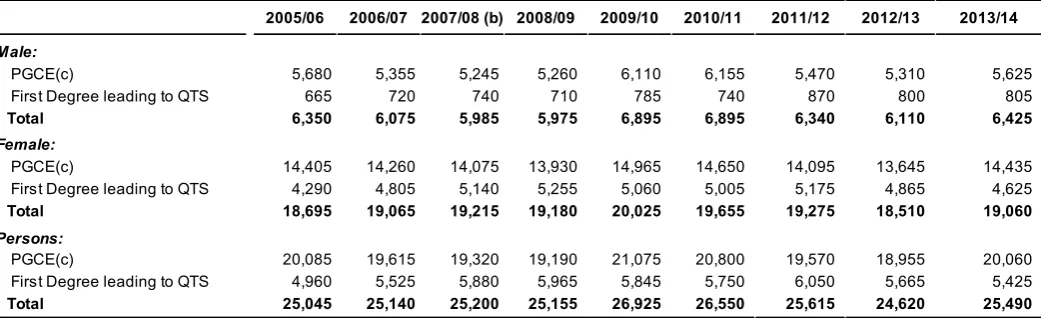
Table C.3: Students completing ITT courses in England, by gender and level of study (a)
2005/06 2006/07 2007/08 (b) 2008/09 2009/10 2010/11 2011/12 2012/13 2013/14
Male:
PGCE(c) 5,680 5,355 5,245 5,260 6,110 6,155 5,470 5,310 5,625 First Degree leading to QTS 665 720 740 710 785 740 870 800 805
Total 6,350 6,075 5,985 5,975 6,895 6,895 6,340 6,110 6,425 Female:
PGCE(c) 14,405 14,260 14,075 13,930 14,965 14,650 14,095 13,645 14,435 First Degree leading to QTS 4,290 4,805 5,140 5,255 5,060 5,005 5,175 4,865 4,625
Total 18,695 19,065 19,215 19,180 20,025 19,655 19,275 18,510 19,060 Persons:
PGCE(c) 20,085 19,615 19,320 19,190 21,075 20,800 19,570 18,955 20,060 First Degree leading to QTS 4,960 5,525 5,880 5,965 5,845 5,750 6,050 5,665 5,425
Total 25,045 25,140 25,200 25,155 26,925 26,550 25,615 24,620 25,490 Source:Higher Education Statistics Agency (HESA) (a) All students enrolments associated w ith an aw ard of an ITT qualification during the academic year.
(b) From 2007/08 students w ho w ere at the Open University and funded by HEFCW w ere excluded from this table (please refer to the notes).
[image:14.595.47.568.462.621.2]Notes
1. Related Publications
The Welsh Government also release tables on StatsWales coveringdestinations data for those
completing ITT courses. These can be found with all the ITT tables at:
https://statswales.wales.gov.uk/Catalogue/Education-and-Skills/Post-16-Education-and-Training/Higher-Education/Initial-Teacher-Training-ITT
2. Data Source
The Higher Education Statistics Agency (HESA) collects data on students, staff and resources of Higher Education Institutions (HEIs) in the UK. The data presented in this bulletin are taken primarily from the HESA Student Record which contains information on all students enrolled on credit bearing courses at UK HEIs, including those enrolled on ITT courses.
A summary of the Student data collection process for 2013/14 covering timescales, validation and business rules and checking processes is included on the HESA website at:
https://www.hesa.ac.uk/index.php?option=com_studrec&Itemid=232&mnl=13051
In addition, HESA published a circular in July 2009 (REF: C08051) to provide further guidance to
institutions returning data, covering a summary of previously announced changes to the data collection system, guidance on fields identified as having data quality issues in 2007/08, plus a summary of the data collection system and timetable and checks required to optimise the quality of data returned. A link to circular C08051 is provided here:
http://www.hesa.ac.uk/index.php?option=com_content&task=view&id=1543&Itemid=233
3. Definitions 3.1 Coverage
This bulletin provides information about courses of Initial Teacher Training (ITT) leading to Qualified Teacher Status (QTS) provided through higher education institutions.
To teach as a qualified teacherin a maintained school or non-maintained special school in Wales or
England, students need to obtain QTS. Students can do this at higher education institutions by either undertaking a first degree course which combines a degree – usually a BEd, BA or BSc – with QTS or by completing a postgraduate course which leads to QTS. PGCE courses are usually postgraduate courses; however, some non postgraduate courses such as the Professional Graduate Certificate in Education (which is pitched at an undergraduate level) are classified as PGCE. Other levels such as Postgraduate Diploma in Education may also be offered.
Professional Graduate Certificate in Education courses are offered by English providers as a level 6 qualification which is classed as ‘other undergraduate’, but requires a first degree on entry. In Wales only the Open University offers this qualification with the ‘leading to QTS’ option, although other Welsh HEIs may award this qualification if a student studying for a Postgraduate Certificate in Education is deemed not to have achieved sufficient credits at masters level.
In this Bulletin figures for English HEIs includes the numbers on Training and Development Agency for Schools (TDA) funded flexible provision.
3.2 Level of study and length of course
Initial teacher training courses vary in length. Most first degree courses which combine a degree with QTS are 3 year courses but 2 and 4 year courses are also offered, depending upon qualifications on entry and the type of course. Postgraduate Certificate in Education (PGCE) courses which lead to QTS are almost all one year courses taken following completion of a degree course.
Course lengths can change: for example, many previously 4 year first degree courses are now 3 year courses, which can make comparisons with previous years difficult.
3.3 Year of study
Figures for first year students cover those entering both types of course in one academic year.
Figures for allstudents on ITT courses will also include those on first degree courses, which started in
the previous academic years. Similarly figures for allstudents completing ITT courses include the
completion of courses which started in different academic years. 3.4 Disabilities
With the introduction of the Disability Equality Duty, and on the recommendation of the Equality Challenge Unit (ECU), HESA has introduced a version of the coding frame introduced by the Disability Rights Commission (DRC). The disability categories indicate the type of disability that a student has on the basis of their own self-assessment, and are consistent with those used by the Universities and Colleges Admissions Service (UCAS). For continuing students, where the information is not already known, institutions have the option of recording the student's disability as not sought. As a result, some institutions have not returned disability data for some of their students. In addition, students are not obliged to report a disability. HESA therefore advises that the figures reported in analyses are derived from a subset which may not be representative of the total student population.
3.5 Subject of study
All secondary ITT students must be trained in at least one specialism. Prior to 2007/08 the main specialism was recorded in the first subject of study field. Up to two other specialisms may also have been recorded. The analysis by subject of study is a headcount of enrolments by main specialism. From 2007/08 students were counted under more than one subject grouping rather than being placed under their subject of specialism. Table A.4 provides a count of enrolments falling within each subject area but also gives a count of individual student enrolments. These student level totals match those in Tables A1, A2 and A3 and eliminate the double counting which occurs at subject level. From 2012/13 the JACS3 subject coding framework was used.
3.7 Open University
The Open University restarted ITT provision in Wales in July 2008. From 2007/08 the tables and charts showing students on ITT courses in Wales include those students at the Open University who were funded by HEFCW. Those charts and tables showing students on or completing ITT courses in England now exclude those students who are at the Open University and funded by HEFCW.
4. Rounding Strategy
The presentation of figures in this Statistical Bulletin follows the principals of the HESA rounding strategy. The strategy is intended to prevent the disclosure of personal information about any
individual. This strategy involves rounding all numbers to the nearest 5. A summary of this strategy is as follows:
0, 1, 2 are rounded to 0 and represented as ‘*’.
All other numbers are rounded to the nearest multiple of 5.
Total figures are also subject to this rounding methodology; the consequence of which is that the sum of numbers in each row or column may not match the total shown precisely. Percentages have been
5. Key Quality Information
This section provides a summary of information on this output against five dimensions of quality: Relevance, Accuracy, Timeliness and Punctuality, Accessibility and Clarity, and Comparability. It also covers specific issues relating to quality of 2012/13 data, and describes the quality management tool applied to this area of work.
5.1 Relevance
HESA is the official agency for the collection, analysis and dissemination of quantitative information about higher education. It was set up by agreement between the relevant government departments, the higher education funding councils and the universities and colleges. The primary purpose of the Student data collection is to provide each of the bodies listed above with accurate and comprehensive statistical information regarding student enrolments.
The statistics are used both within and outside the Welsh Government to monitor trends in ITT provision at Welsh HEIs and also to monitor provision across the UK for Welsh domiciled students. Some of the key users are:
Ministers and the Members Research Service in the National Assembly for Wales;
Officials in the Welsh Government;
Other government departments;
The Higher Education Funding Council for Wales;
Higher Education Institutions and representative bodies;
Students, researchers, and academics;
Individual citizens, private companies, and the media;
These statistics are used in a variety of ways. Some examples of these are:
Advice to Ministers;
To inform the education policy decision-making process in Wales;
To forecast future expenditure of student support schemes for Welsh domiciled students;
To help model future supply and demand for teachers and inform ITT intake targets.
5.2 Accuracy
The Student Record contains information about individual enrolments, which, because a student can be enrolled on more than one programme of study, will exceed the number of students. Previous analysis has shown that for Welsh HEIs full-time enrolments are less than 1 per cent higher than full-time student numbers; part-time enrolments are less than 2 per cent higher than part-time student numbers.
Postdoctoral students are not included in the HESA Student Record.
The Student record is an annual census of students. The steps taken by HESA to ensure data qualities were outlined in the ‘Data Source’ paragraph earlier in this section.
those completers who were studying towards QTS award. The revised version of Table A.6 also incorporated changes necessitated by coding errors which were discovered at two Welsh HEIs.
The errors occur where completers who were on ITT courses were coded as ‘First degree with honours’ rather than ‘first degree with honours leading to QTS/ registration with a GTC’, which meant that they were missing from the original table. Figures have been revised for all academic years to allow accurate comparisons across years to be made.
5.3 Timeliness and Punctuality
HESA collected student enrolment data for the 2013/14 academic year between August and October 2014.
5.4 Accessibility and Clarity
This statistical bulletin is pre-announced and then published on the Statistics section of the Welsh Government website. It is accompanied by more detailed tables on StatsWales, a free to use service that
allows visitors to view, manipulate, create and download data.
5.5 Comparability
There are no published figures for the 2013/14 academic year for other UK countries that can be directly compared to figures in this bulletin.
The Training and Development Agency for Schools (TDA) operates as a national agency and recognised sector body responsible for the training and development of the school workforce in England; its website
is located here:http://www.tda.co.uk/
5.6 Data quality issues
From 2007/08 those students enrolled at the Open University and funded by HEFCW were no longer counted under English HEIs, but instead were counted under Welsh HEIs. Although the numbers are small, it was felt that these changes helped to better inform funding policy.
The HESA standard registration population is a count of all enrolments with the reporting year 1 August until 31 July. In 2007/08 the standard population was redefined to no longer include students who were writing up or on sabbaticals. This change has not affected the data in this bulletin.
For 2006/07 one institution incorrectly coded postgraduate students with ‘Welsh’ as their main specialism as ‘enables to teach bilingually or leads to a formal qualification’. This accounts for the relatively large change between the years.
For 2006/07 one Welsh institution incorrectly coded some students to the Foundation Phase, Key Stages 1 and 2 rather than the Foundation Phase and Key Stage 1. This accounts for the relatively large change between the years.
Prior to 2007/08 subject level enrolment counts were not available. Table A.4 has been revised for this 2011/12 bulletin to provide both subject level and individual student level counts.
All content is available under the Open Government Licence v3.0 , except where otherwise stated.
http://www.nationalarchives.gov.uk/doc/open-government-licence/version/3/ STATSWALES
Tables associated with this bulletin containing a greater amount of detail are available on the Welsh
Government’s interactive data dissemination service StatsWales (www.statswales.gov.uk).
Prior to 2005/06 the enrolment population used in the Initial Teacher Training (ITT) bulletin was based
on enrolments at 1December. The following link provides a time series from 1994/95 by gender and
level until the academic year 2009/10 based on the December population.