Effect of custom-made probiotic chocolates on
Streptococcus mutans, plaque pH, salivary pH and buffering
capacity in children- A randomized controlled trial
Dissertation submitted to
THE TAMIL NADU Dr M.G.R. MEDICAL UNIVERSITY
In partial fulfilment for the degree of
MASTER OF DENTAL SURGERY
BRANCH – VIII
KSR INSTITUTE OF DENTAL SCIENCE AND RESEARCH
DEPARTMENT OF PEDODONTICS AND PREVENTIVE DENTISTRY
CERTIFICATE
This is to certify that the dissertation titled “Effect of custom-made probiotic chocolates on
Streptococcus mutans, plaque pH, salivary pH and buffering capacity in children- A
randomized controlled trial”is a bonafide work done by Dr.JANANI RG, Postgraduate student, during the course of the study for the degree of “Master of Dental Surgery” in Department of Pedodontics and Preventive Dentistry, KSR Institute of Dental Science and Research,Tiruchengode during the period of 2015-2018.
Date: Dr. G.S. Kumar, M.D.S.,
KSR INSTITUTE OF DENTAL SCIENCE AND RESEARCH
DEPARTMENT OF PEDODONTICS AND PREVENTIVE DENTISTRY
CERTIFICATE
This is to certify that the dissertation titled “Effect of custom-made probiotic chocolates on
Streptococcus mutans, plaque pH, salivary pH and buffering capacity in children- A
randomized controlled trial”is a bonafide work done by Dr.JANANI RG, Postgraduate student, during the course of the study for the degree of “Master of Dental Surgery” in Department of Pedodonticsand Preventive Dentistry, KSR Institute of Dental Science and Research,Tiruchengode during the period of 2015-2018.
Date: Dr. Sharath Asokan, M.D.S., Ph.D
DECLARATION BY THE CANDIDATE
TITLE OF DISSERTATION
Effect of custom-made probiotic chocolates on Streptococcus mutans, plaque pH, salivary pH and buffering capacity in children- A randomized
controlled trial
PLACE OF STUDY K.S.R Institute of Dental Science and Research DURATION OF COURSE 3 Years (2015-2018)
NAME OF THE GUIDE Dr. GeethaPriya PR, M.D.S HEAD OF THE DEPARTMENT Dr. Sharath Asokan, M.D.S, PhD
I hereby declare that no part of the dissertation will be utilized for gaining financial assistance for research or other promotions without obtaining prior permission from the principal, K.S.R Institute of Dental Science and Research, Tiruchengode. In addition, I declare that no part of this work will be published either in print or electronic without the guide who has been actively involved in this dissertation. The author has the rights reserved for publishing the work solely with prior permission of the principal, K.S.R Institute of Dental Science and Research, Tiruchengode.
Acknowlegement
I am extremely grateful to my mother and best friend Late Mrs. R. Rajeswari,
for all the care, love and affection she had given me all her life. Nothing and nobody
can replace her role for building me up personally and professionally. I soulfully
thank her for encouraging me constantly and accepting all my mistakes. My mere
expression of thanks would not suffice for all the debt I am yet to pay her.
It’s my privilege to thank my father Mr. K. Gopalakrishnan, for providing me
with a congenial atmosphere to pursue my studies. My heartfelt thanks for his belief
in my aptitude and his encouragement to pursue my dreams. I thank him for all the
sacrifices he has done all his life to make me happy.
I express my sincere thanks to Dr. G. S. Kumar, M.D.S.,Principal for
providing me an opportunity for doing post-graduation in this college.
course. I thank him for trusting in my abilities. Beyond a teacher he was a great
mentor for all his care and valuable advices for life.
I express my sincere gratitude to my guide Prof.Dr. GeethaPriya PR, M.D.S.,
for her valuable guidance, scholarly inputs and the consistent encouragement I
received throughout my preparation of the thesis. Words wouldn’t be enough to
thank her for the concern and care she has shown me all through my PG course.
I would like to express my sincere thanks to Dr.T.D.Yogesh Kumar,
Dr.G.Thiruvenkadam and Dr.Logeshwari my senior lecturers, for being a pillar of
support and encouragement throughout the course. Thank you for all your valuable
advices and clinical tips. I would also like to thank Dr. Lakshmi Prabha, for her
support and motivation.
At this juncture I extend my deepest gratitude in thanking my lovely sister
Mrs. A.S.Latha Mahaeswari, my brother-in-law Mr. R. Saravana Kumar and my little
bundle of joy Master S.L. Aniruth Nithin
for all the love, encouragement, advices
and happiness they have extended me throughout life.
I would like to extend my heartfelt thanks to Mr. Padmanaban PhD.,
Karunya University, Coimbatore for helping me with the invitro trials. I also thank
Prof. Mr. Sharath Chandekar, Head of the department of microbiology, KSR
institiute of dental sciences and Mr. Munusamy Msc., for helping me with the invivo
cultures.
I also wish to thank my seniors Dr.Seby Thomas, Dr.Saravana Kumar
and Dr. kameshwaran for their advice, motivation and help they have extended all
through my PG course. It’s my immense pleasure in thanking my dearest friends
Dr.Allwyn Sameul , Dr.Vijayasankari V, Dr.Jijo Mon, Dr.Chitravadhana V,
Dr.Sudhandra V, Dr.Kesavaraj B, for being my family who constantly supported,
helped and cared me throughout my PG course. Thank you all for the love which
will be remembered and cherished forever.
Words wouldn’t be enough to thanks my best friends Dr.K. Dhanyashri, and
Mr. R. Prasanth, for listening to all my lamentations patiently. Thank you for being
catalysts and activating me from within. I would also like to thanks my friends Dr.
M.Varshini, Dr. P.Parthiban, Dr. J.Balaji and Dr. Nandini for being a sympathetic
ear in times of dire need.
was needed the most. I would also thank my juniors Dr. Sangavi, Dr. K. Govarthini,
Dr. N.R. Hema and Dr. R.Priyanka for their constant love and support.
Thank you all for making me the person I am today which enabled me to
work with peace of mind. This PG experience has given me the best life lessons
along with a family away from home.
CONTENTS
S.NO
TITLE
PAGE NO.
1. INTRODUCTION 1
2. AIMS 5
3. REVIEW OF LITERATURE 6
4. METHODOLOGY 21
5. RESULTS 35
6. DISCUSSION 54
7. SUMMARY AND CONCLUSION 63
8. REFERENCES 66
World market has tagged Indians to be chocophile, owing to the larger and faster growth in chocolate industries. In 2016, when chocolate sales were stagnant in other countries, India topped the chocolate market. Over 44% of chocolate consumers in India assume chocolates to be healthy on consumption. Owing to the increased incidence of chocolate sales, it’s nearly impossible to completely eradicate it from consumers.10
Chocolate, a solid confectionery is a mixture of cocoa, fat and powdered sugar. Chocolates have been mainly classified based on their cocoa content into three categories- milk, dark, and white chocolate. Milk chocolate is solid chocolate made with milk in the form of milk powder, sugar, cocoa mass, cocoa butter and or vegetable fat. White chocolate is a confection based on sugar, milk, and cocoa butter without the cocoa solids. Dark chocolate is produced by adding fat and sugar to cocoa. Dark chocolate is a suspension of 65% to 70% cocoa particles and sugar in cocoa butter. Particle size of sugar and cocoa particles is controlled to <30 µm to avoid grittiness and obtain a smooth in-mouth flow. Milk chocolate differs from dark chocolate notably through the presence of milk solids (milk powder) and lower content of cocoa.5
Chocolates are sticky in nature and contain large amounts of fermentable sugar making them highly cariogenic.19 Chocolate contains sucrose from sugar particles and lactose from milk making it a fermentable carbohydrate. However chocolate consumption in causing dental caries is debatable. Rugg-Gunn et al75 found a positive association between chocolates and caries which were not statistically significant. It was concluded that chocolate consumption solely was not a strong factor for caries. Verakaki and Duggal94 emphasized the varying cocoa content in chocolates was one of the major factors in determining the acidogenicity of plaque.
the composition and behavior of their microbial residents. The formation of biofilm occurs by adherence of the primary colonizers on the tooth surface, followed by coaggregation of secondary colonizers. Streptococcus and Actinomyces species are the most abundant early colonizers of the soft and hard tissues of the oral cavity. The transition from oral health to disease is as a result of ecological shifts caused by changes in the host oral environment, which finally lead to microbial imbalance within these biofilms.48
Stephan (1940)84 conducted an experiment with 10% sucrose rinse and recorded the pH
at various time intervals. The pH Values plotted as graph showed that after the sucrose rinse, the pH drops rapidly reaching pH 5.5 (critical pH) within 2-5 minutes. The pH remained under the critical level for 10-30 minutes. Then it returned gradually to the resting pH level after 60 minutes. Unless there is additional ingestion of fermentable carbohydrates, the pH of plaque gradually returns to its resting pH of 6 to 7.8 The change in pH after a sugar challenges is mainly
due to rate of acid formation, movement of acids in and out of the plaque, rate of acid neutralization by the plaque, tooth substance, buffer systems and the rate of acid neutralization by the bacteria.25 Frequent consumption of sugars leads to a selective increase in acidogenic and aciduric strains of the oral environment. Hence there is a shift in the demineralization/ remineralization balance toward mineral loss, leading to the caries lesion development.24
The new era of caries prevention aims at altering the oral environment and bringing back microbial homeostasis. The use of probiotics for preventing dental diseases is at an emerging front. Systematic review by Laleman et al43 and Cagetti et al12 have shown probiotics to be a potential agent that can reduce the S. mutans colony count.
well being of Bulgarian population. It was attributed to their practice of yoghurt consumption. He named the Lactobacillus found in curd after the Bulgarians as Lactobacillus bulgaricus. Lilly and Stillwell in 1965 proposed the term probiotic. Hull et al in 1984 introduced the first probiotic bacteria - Lactobacillus acidophilus. Parker in 1974 defined them as: “organisms and substances which contribute to intestinal balance”. FDA/WHO (2002) defined probiotics as ‘Live micro-organisms which, when administered in adequate amounts, confers health benefit on the host’. Bacteria is accepted as probiotic if it has the ability to: (i) exert a beneficial effect on the host; (iii) withstand transport through the GI tract; (ii) withstand in a foodstuff maintaining viability (v) produce antimicrobial substances against pathogens; (iv) adhere to the intestinal epithelial lining and (vi) stabilize the intestinal microflora.65
. The preventive and therapeutic role of probiotics have been studied on different aspects of health including its effect on diarrhea,89 lactose intolerance,49 hepatic diseases,80 arthritis,50
allergies,51 cardiac diseases,53 irritable bowel syndrome,95 cancer,18 Urinary tract71, hyperlipidemia.61 Among the oral disease, its effect has been studied on dental caries,55 periodontitis,41 halitosis,9 aphthous ulcers,90 fungal infections,31 and oral cancer.98
Different probiotic strains have been studied for the prevention of dental caries namely:
Lactobacillus rhamnosus GG,55 Lactobacillus rhamnosus LC 705,2 L.reuteri,57 Lactobacillus reuteri ATCC 55730,13 L. rhamnosus LB21,83 L. paracasei GMNL-33,17 Bacillus coagulans,36 Bifidobacterium lactis Bb-12, Lactobacillus acidophilus La-5,78 Lactobacillus acidophilus, 85
Probiotics has been used with different vehicles such as cheese,2 milk,55,83 yoghurt,57,85 lozenges,15 capsule,52 ice creams,3,78 straw,13 tablet,17 gum,14 powder36 and drink.20 Ideally its
delivery should be suitable for all ages to receive its benefit. Possemiers et al69 added probiotics to dark and milk chocolates. It was observed that coating probiotics in chocolates was an excellent solution to protect it from stress conditions and for optimal delivery into the GI tract. Kanafari et al39 in an invitro experiment proved the effectiveness of probiotic dark chocolate against S.mutans. Literature search did not reveal any invivo trials of probiotic chocolates in general as well as in dental research. Considering the growing sales of chocolate, a pragmatic idea would be to manufacture a tooth friendly chocolate.
AIMS
To formulate 3 types (milk, white and dark) of chocolates with probiotics.
To compare the plaque pH, salivary pH and buffering capacity of the three probiotic chocolates with conventional chocolates in children
Nase L, Hatakka K, Savilahti E, Saxelin M, Ponka A, Puossa T, Korpela R,
Meurman J H (2001)55 evaluated the effect of probiotic milk in preventing caries in children
aged 1-6 years. A randomized control trial was done on 594 children dividing them into experimental (n=296) and control groups (n=298). The experimental group drank milk containing Lactobacillus rhamnosus GG whereas the control group consumed normal milk on weekdays for 7 months. Children’s dental caries status was recorded using WHO criteria. Caries risk was assessed through streptococcus mutans colony count with Dentocult SM Strip mutans kit. Results showed a significant reduction in colony count post intervention in the probiotic group and less incidence of dental caries compared to control group. Long term consumption of probiotic milk reduced the incidence of dental caries.
Ahola AJ, Yli-Knuuttila H, Suomalainen T, Poussa T, Ahlstrom A, Meurman JH,
Korpela R (2002)2 evaluated theshort-term consumption of cheese containing Lactobacillus GG
reduction in these counts in the intervention group compared to the control group. Hence eating cheese in general provides beneficial effect in diminishing caries risk.
Verakaki E, Duggal MS (2003)94 estimated the acidogenic potential for different
European chocolates with varying cocoa content. The test chocolates included diet chocolate (DC), plain European chocolate (PEC 70% cocoa), plain English chocolate (PenC 34% cocoa), milk English chocolate (MenC 20% cocoa), milk European chocolate (MEC 30% cocoa), White chocolate (WC no cocoa), milk chocolate with hazelnuts (MHC 20% cocoa), 10 ml of 10% sucrose and sorbitol solution. Fourteen Participants within 16-50 years consumed 15g of the chocolate. Plaque pH was measured at baseline and at 2, 5, 10, 15, 20 and 30 minutes, after consuming the test chocolates. Diet chocolate was found to have no acidogenic effect on dental plaque. PEC and MHC had a lower acidogenic potential than sucrose.
Nikawa H, Makihira S, Fukushima H, Nishimura H, Ozaki Y, Ishida K, Darmawan
M, Hamada T, Hara K, Matsumoto A, Takemoto T, Aimi R (2004)57evaluated the inhibitory
effect of custom made yogurt containing Lactobacillus reuteri against Streptococcus mutans
reduced the levels of mutans streptococci, than the placebo yogurt. L. reuteri combined with yogurt was found to be effective in reducing the caries risk.
Montalto M, Vastola M, Marigo L, Covino M, Graziosetto R, Curigliano V, Santoro
L, Cuoco L, Manna R,Gasbarrini G (2004)52 evaluated the change in lactobacillus and
streptococcus colony count after probiotic usage through the oral route. Thirty-five healthy volunteers were randomized into 3 groups; group A (n = 14) received probiotics in capsules and placebo in liquid form; group B (n = 16) took liquid probiotics and placebo in capsules, and group C (n = 5) used placebo in both liquid and capsule form. The salivary counts of lactobacilli
species and S. mutans were measured using the CRT® bacteria kit. Results showed a significant improvement in lactobacillus sp. colony count in the saliva with both capsules and gels. There was no significant difference in streptococcus colony counts. The increase in lactobacilli count with inhibitory effect on other bacteria could be a treatment option in the long-term prevention of caries.
Caglar E, Cildir SK, Ergeneli S, Sandalli N, Twetman S (2006)13 investigated the
counts were not statistically significant. Both modes of deliveries probiotic were effective in reducing the Streptococcus mutans colony count.
Caglar E, Kavaloglu SC, Kuscu OO, Sandalli N, Holgerson PL, Twetman S (2007)14
carried out a randomized controlled trial to evaluate the effectiveness of probiotic and xylitol against mutans streptococcus (MS) and lactobaccili (LB). About 80 children aged 21-24 years were randomly assigned to one of the 4 groups: group A- probiotic gum; group B- xylitol gum; group C- probiotic and xylitol gum and group D- placebo gum. The probiotic gum contained
Lactobacilli reuteri ATCC 55730 and ATCC PTA 5289. Children received the gums for a period of 3 weeks. Baseline saliva and 1 day post intervention saliva was collected and tested for MS and LB with chair-side kits. A statistically significant reduction of salivary MS was seen in group A and B after the intervention when compared with baseline. Group C also showed reduction in colony count which was not statistically significant. There was no change in the colony counts in group D. They concluded that use of probiotic and xylitol chewing gums showed reduction in mutans streptococcus but they were ineffective when used in combination.
Caglar E, Kuscu OO, Cildir SK, Kuvvetli SS, Sandalli N (2008)15 investigated the
Stecksen-Blicks C, Sjostrom I, Twetman S (2009)83combined L. rhamnosus LB21 and
fluoride in milk to conduct an invivo trial in 248 preschool children aged 1 to 5 years. The primary aim of the study was to determine the caries-preventive effect while the secondary aim remained at evaluating infections, use of antibiotics and medical care. Children in the intervention group received milk containing fluoride of 2.5 mg/litre and L. rhamnosus LB21. Control group received medium fat milk. Both the groups were provided with the milk, once
daily for 21 months. After the intervention the mean caries experience measured with WHO criteria was lesser in the intervention group than the control group. The intervention group had 60% fewer days with antibiotic therapy and 50% less days with otitis media. The study showed the anti caries effect as well as the general health benefits of long term consumption of probiotics.
Hegde AM, Shetty R, Sequeira AR (2009)34evaluated the acidogenicity of 6 chocolates
available in Indian market, among 30 dental volunteers. Six commercially available chocolates were divided into two subgroups. Unfilled group contained plain milk, dark and diet chocolates whereas the filled group had fruits and nuts, caramel and coconut chocolates. Plaque pH was measured at baseline and at 5, 10, 15, 20, and 30 minutes after consumption of chocolates. In unfilled group, milk chocolate had maximum pH drop at 20 minutes and diet chocolate had minimum pH drop at 10 minutes. Fruit and nut had maximum pH drop at 20 minutes and caramel had minimum pH drop at 15 minutes. Filled chocolates were found to be more acidogenic than unfilled chocolates.
Chuang LC, Huang CS, Ou-Yang LW, Lin SY (2011)17 conducted a double-blinded,
Dentocult SM Strip kit was used to check the bacterial counts of salivary S. mutans, Dentocult LB Dip Slide for lactobacillus and Dentobuff Strip for salivary buffering capacity of saliva. The measurements were done at the baseline (T1), the completion (T2) of study period and 2 weeks post intervention (T3). Though not significant, a reduction in the salivary S. mutans count was detected between T2 and T3 of the intervention group. There was no significant difference in the lactobacillus count and buffering capacity of saliva. Short term consumption of probiotic tablet reduced the risk for caries.
Jindal G, Pandey RK, Agarwal J, Singh M (2011)36 conducted a study with 150
children aged 7-14 years. The children were divided into 3 groups; group A received placebo powder, group B received freeze drided Lactobacillus rhamnosus and Bifidobacterium while group C received Bacillus coagulans. The children were instructed to mix the preparation with 20ml of water to swish and swallow for 14 days. Mutans streptococcus colony count was checked on mitis salivarius bacitracin agar at baseline and 14 days post intervention. There was a significant reduction of colony count in both group B and C at 14 days post intervention. Dietary supplements with probiotics could be a cheap alternative to reduce the incidence of dental caries.
Singh RP, Damle SG, Chawla A (2011)78 conducted a study with ice cream
Sudhir R, Praveen P, Anantharaj A, Venkataraghavan K (2012)85 compared the
effect of probiotic curd containing Lactobacillus acidophilus vs normal curd consumption in children. Forty children were randomly divided into 2 groups for an interventional period of 30 days. Baseline and post intervention saliva samples were collected and cultured in Mitis salivarius bacitracin agar to estimate the S.mutans colony count. There was a significant reduction in the colony count after 30 days of probiotic curd consumption. Short‑term consumption of probiotic curds can reduce oral S. Mutans counts.
Juneja A, Kakade A (2012)37conducted a study to determine the effectiveness of short
time probiotic intake on 40 children aged 12-15 years for 9 weeks. The study was divided into 3 phases of 3 weeks each. First phase was baseline, while in the second phase children were given either milk containing Lactobacillus rhamnosus hct 70 or placebo milk. The third phase was follow up. After each phase salivary samples were collected. The intervention group had a statistically significant reduction of S.mutans counts at post intervention and follow up period. The study suggested a protective and preventive role of probiotic Lactobacillus rhamnosus hct 70 against dental caries.
Khanafari A, Hosseini Porgham S, Tajabadi Ebrahimi M (2012)39 evaluated the
inhibitory potential of S. mutans using three probiotic strains Lactobaccilus plantarum, L. rhamnosus and L. acidophilus. The antimicrobial effect of the probiotic strain against S.mutans
containing L.plantarum showed the maximal inhibitory zone. Chocolates can be used as a means for delivering probiotics.
Dhawan R, Dhawan S (2013)21 assessed the effectiveness of commercially available
probiotic on plaque, gingivitis, and salivary Streptococcus mutans levels in subjects with chronic gingivitis. Commercially available probiotic BIFILAC- HP capsule containing Lactobacillus sporogenes, Streptococcus faecalis T‑110JPC, Clostridium butyrium TO‑A, and Bacillus
mesentericus TO‑A JPC was used. The experimental group (n=17) probiotic capsule and the control group was given placebo capsule to swallow for a period of 2 weeks. Plaque index, gingival index and streptococcus mutans colony count was measured at baseline, post intervention and 2 weeks post intervention. Probiotic group showed a statistically significant difference from the placebo group in all the parameters assessed, throughout the study period. The use of probiotics could decrease the disease processes in oral cavity effectively.
Chinnappa A, Konde H, Konde S, Raj S, Beena JP (2013)16 conducted a clinical trial
Burton JP, Drummond BK, Chilcott CN, Tagg JR, Thomson WM, Hale JD,
Wescombe PA (2013)9evaluated the effect of probiotic lozenges on plaque, gingival health and
oral microflora. Children aged 5- 10 year were divided into probiotic group (n=40) and placebo group (n=43). Probiotic group received 2 lozenges per day containing S. salivarius M18 for 3 months and the placebo group received similar lozenges without probiotic. Plaque, gingival health assessment and salivary assessments were done at 1, 3 and 7 months. Chromogenic agar for Candida spp, Rogosa SL agar for lactobacilli, Mitis Salivarius agar for S. salivarius and
Tryptone Yeast Cystine Sucrose Bacitracin (TYCSB) agar for S.mutans was used. Gingival health and S.salivarius colony count improved while S.mutans colony count reduced in the probiotic group. S. salivarius M18 can provide oral health benefits on long term consumption.
Taipale T, Pienihakkinen K, Alanen P, Jokela J, Soderling E (2013)86 evaluated the
effect of Lactobacillus paracasei SD1 on the number of salivary mutans streptococci, lactobacilli, and yeasts. The study consisted of 40 adults randomly divided into probiotic milk and standard milk group. The probiotic group received milk containing Lactobacillus paracasei
Nishihara T, Suzuki N, Yoneda M, Hirofuji T (2014)59 evaluated the effectiveness of L. salivarius containing tablets on caries risk factors. Sixty four adults were divided into four groups; L. salivarius WB21 (n=17), L. salivarius TI 2711 (n=16), Ovalgen® DC (N=13) (IgY antibody) and xylitol tablet (N=18) group. The participants were instructed to place the tablet on the tongue and then allow it to dissolve. Levels of mutans streptococci and lactobacilli, salivary flow, salivary pH, and salivary buffering capacity were assessed before and after taking the tablets. The level of mutans streptococci was evaluated using Dentocult SM Strip mutans kit. Further a short term trial was conducted with L. salivarius WB21- containing tablets. Participants were given 3 tablets a day for 2 weeks. The levels of mutans streptococci decreased in the L. salivarius WB21, TI 2711 and Ovalgen® DC groups compared to the xylitol group. Lactobacilli levels significantly increased in the L. salivarius WB21 and TI 2711 groups. Salivary flow and salivary pH did not differ significantly between the groups. The salivary buffering capacity significantly increased in the L. salivarius TI 2711 group and Ovalgen® DC group than the xylitol group. The short-term administration trial showed that the L. salivarius
WB21-containing tablets significantly decreased the number of mutans streptococci and therby increases the resistance to caries risk.
Hedayati-Hajikand T, Lundberg U, Eldh C, Twetman S (2015)32 assessed the effect
suggested that early childhood caries development could be reduced through administration of probiotic tablets.
Romani Vestman N, Chen T, Lif Holgerson P, Ohman C, Johansson I (2015)73
conducted a randomized controlled trial to evaluate the effects of L. reuteri(DSM 17938 and PTA 5289) on the oral microbiota composition using 454 pyrosequencing and the HOMD along with L. reuteri specific culturing and PCR detection. Forty adults were randomly divided into probiotic lozenges and placebo group, receiving 2 lozenges per day for 12 weeks. Salivary samples were collected at baseline, 4, 8 and 12 weeks during intervention. Follow-up samples after intervention were collected 1 and 6 months. Streptococcus was the most common genus and the S. oralis/ S. mitis/S. mitis bv2/S. infantis group comprised the dominant species. There was shift in microbiotia with reduced S. mutans, S. anginosus, N. mucosa, Fusobacterium periodicum, F. nucleatum ss vincentii, and Prevotella maculosa detection. This shift was observed upto 1 month post intervention. L.reuteri (DSM 17938 and PTA 5289) was effective in reducing the pathogenic microflora.
Nozari A, Motamedifar M, Seifi N, Hatamizargaran Z, Ranjbar MA (2015)60
The short term consumption of probiotic yogurt did not reduce the streptococcus mutans and
lactobacilli colony count.
Ashwin D, Vijayaprasad KE , Taranath M, Ramagoni NK, Naras A, Sarpangala
M (2015)3 conducted a double blind randomized controlled trial with 60 children of age 6 to 12
years. Probiotic ice cream containing Bifidobacterium lactis Bb-12 and Lactobacillus acidophilus La-5 was given to the children for 7 consecutive days. Streptococcus mutans colony count was assessed at baseline, 7 days, 30 days and six months using Dentocult SM kit. There was a reduction in the colony count at 7 and 30 days but the colony count was similar to baseline after 6 months.
Mahantesha T, Parveen KM, Praveen NH, Asha N, Ashwin D, Vinutna B (2015)46
conducted a randomized controlled trial including 50 children of 6 – 12 years with zero DMFT. Children were randomly divided into either probiotic ice cream group or probiotic milk group. Children were given the probiotic milk for 7 consecutive days. Salivary samples were collected at baseline, one day and 3 months post intervention. The samples were assessed for S.mutans
colony count. Both the probiotic groups showed a statistically significant reduction in colony count at 1 day post intervention period. The probiotic ice cream showed a reduction in colony count after 3 months compared to the baseline. But the probiotic milk group did not show a significant reduction in colony count. Ice cream was as a better vehicle for probiotic delivery compared to probiotic milk.
bacitracin agar from saliva sample. There was a significant reduction in the colony counts between baseline and post intervention. Probiotics have a promising role to play in preventing dental caries.
Yousuf A,Nagaraj A,Ganta S,Sidiq M,Pareek S, Vishnani P, Acharya S, SinghK
(2015)97 conducted a trail in 33 children of 12-15 year old. The children were randomly divided
into 3 groups with 11 in each group. They either received a freeze dried preparation of
Lactobacillus acidophilus, Bifidobacterium longum, Bifidobacterium bifidum and
Bifidobacterium lactis or lactic acid bacillus only. The control group received placebo powder. Saliva samples were collected at baseline, 7, 14 and 21 days and S.muatns colony count was done in Mitis salivarius bacitracin agar. Both the probiotic groups showed a reduced colony count after the second week. It was concluded that oral probiotics showed a short term effect in reducing S. mutans.
Bhalla M, Ingle NA, Kaur N, Yadav P (2015)6evaluated the effect of probiotic curd on
mutans streptococci levels in saliva. Children aged 12-14 years were randomly divided into probiotic curd (n=15) and plain curd (n=15) group. The probiotic curd group was supplied with curd containing B. lactis 12. Both the groups were provided with 200ml of curd for 7 days. Salivary mutans streptococcus level was estimated at baseline, at 1 hour and on the 7th day by
using mitis Salivarius Bacitracin Agar. The colony counts reduced in the probiotic group at 1 hour and 7th day compared to baseline values. There was a statistically significant reduction in the colony count between the groups at 1 hour and 7th day.
Vasanthakumar H, Sharan J, D.Cruz AM (2016)93 evaluated the acidogenecity of 5
pH was estimated at 10, 20, 30 and 45 minutes using pH test strips. Caramel chocolate had the maximum decrease in plaque pH at 20 minutes after consumption. The least drop in pH was noted for dark chocolate. At the end of 45 minutes, the dental retention measured by sugar clearance was highest for the caramel chocolate. Dark chocolates have a greater content of cocoa and less sugar making it the least cariogenic.
Nirmala S, Quadar MA, Veluru S (2016)58 compared the acidogenecity of 6 different
types of chocolates dividing them into unfilled (dark and milk chocolate), filled (wafer and fruit and nuts chocolate), and candy (hard milk and mango-flavored candy) groups. Plaque pH values and salivary sugar clearance rates were assessed at baseline, 5, 10, 15, 20 and 30 mins after consumption. Dark chocolate had a high fall in pH and milk chocolate had low salivary sugar clearance which signifies that unfilled chocolates are more cariogenic than other chocolates.
Rodriguez G, Ruiz B, Faleiros S, Vistoso A, Marró ML, Sanchez J, Urzua I, Cabello
R (2016)72 conducted a randomized controlled study in 2-3 year old children with the aim of a
Srivastava S, Saha S, Kumari M, Mohd S (2016)81estimated the role of probiotic curd
on salivary Streptococcus mutans count after 7 days intervention. Sixty adults aged 20-25 years were randomly divided into probiotic and plain curd groups, with 30 in each group. Participants were supplied with 100ml of curd each day for 7 days. Salivary samples were collected at baseline, half an hour, 1 hour and 7 days after intervention. pH was measured using pH meter and Mitis Salivarius Bacitracin agar to estimate S. mutans count. Results showed a reduction in salivary pH after ½ hour and 1 hour in both the groups but after 7 days, probiotic curd showed a statistically significant increase in salivary pH. Probiotic curd showed statistically significant reduction in S. mutans colony counts compared to normal curd.
Ghasemi E, Mazaheri R, Tahmourespour A (2017)29 investigated the effect of
probiotic yogurt vs xylitol chewing gum on salivary streptococcus mutans colony count. Fifty adults were randomly divided into two groups. Probiotic group received 200g yogurt containing
Lactobacillus acidophilus and Bifidobacterium bifidum once daily for 3 weeks. Xylitol group received 2 chewing gums (xylitol content: 5.58 grams daily) 3 times daily after each meal for 3 weeks. Saliva samples were collected at baseline, 1 day, 2 weeks and 4 weeks after the intervention. Samples were cultured on mitis salivarius bacitracin agar and salivary S. mutans
The present randomized controlled trial was conducted in the Department of Pediatric and Preventive Dentistry, K S R Institute of Dental Science and Research (KSRIDSR). The study was planned and organized in association with various schools in Tiruchengode to determine the plaque pH, salivary pH and buffering capacity after consumption of custom made probiotic chocolates in children. The study design and protocol was analyzed and approved by the Institutional Review Board and Institutional Ethics Committee of KSRIDSR, Tiruchengode, Tamilnadu. The purpose of the study was explained to the school authorities and their approval was obtained. A written consent in mother tongue (Tamil) was also obtained from the parents of the children who participated in the study.
Materials for preparation of chocolates
BifilacTM sachet (Tablets India Ltd, Chennai, India)
Dairy milk (Cadburys, Mumbai ,India)
Milky bar (Nestle, Gurgaon, India )
Dark chocolate (Amul, Gujarat, India)
Sterile bowl and spatula
Chocolate molds
Aluminium foil
Refrigerator
Materials for determining plaque pH salivary pH and buffering capacity
Diagnostic instrument set – consisting of a mouth mirror, explorer and tweezer in kidney tray.
Disposable gloves
Paraffin wax
Sterile sample container (uricups)
3.0 ml disposable pipette
5.0 ml glass measuring pipette
5.0 ml disposable test tubes with caps
Octanol solution 500ml (Himedia, All India laboratories)
Hannah pH meter (Oakton, pH tester 20, Singapore)
Neutral pH 4 and pH 7 tablets (Merck, Mumbai)
Sterile explorer
Distilled water
0.005 mol/litre HCl
Materials for microbial colony count
Thioglycollate agar
Bacitracin disk 10 units
Blood
Hot water bath
Conical flask 2000ml
1000 µl pipette
Disposable micro tips
Petri plates
Ethanol
Plate rotator
Laminar flow chamber
Incubator
Automatic colony counter
Inclusion criteria
School children of 8-12 years.
def/DMFT score ≤ 3
The exclusion criteria includes children
On antibiotics
Under probiotics
Using xylitol chewing gums
Allergic to dairy products
Medically compromised like autoimmune disorders.
Invitro study
Determining the minimum inhibitory concentration
. The probiotic chosen for the present study was BifilacTM sachet which contains:
Prebiotics: Streptococcus faecalis T-110 (30 million)
Clostridium butyricum TO-A (2 million)
It was used for antimicrobial tests against S.mutans. The minimum inhibitory concentration (MIC) of the probiotic against S.mutans was determined to be 0.5µg/mL.
Preparation of probiotic chocolate
Commercially available chocolate bars of white chocolate (Milkybar), milk chocolate (Dairy milk) and dark chocolate (Amul) were used. About 13g of the chocolates were melted at 36–37ºC and the molten chocolates were tempered at 34ºC for 10 minutes. The MIC concentration of probiotic with 108 CFU (according to 0.4 McFarland units) was added to the
13g molten chocolates and thoroughly mixed with a stirrer. The chocolates were then poured in a mould and set for cooling at 4ºC. The hardened chocolates were wrapped in aluminum foil and they were stored in refrigerator.
Antimicrobial effect of probiotic Chocolate on Streptococcus mutans
The antimicrobial effect of the probiotic chocolate was evaluated by agar well diffusion method. Streptococcus mutans ATCC 25175was lawn cultured in Muller Hinton agar following which 6mm sterile cork broker was used to punch holes in agar plates. Each plate had 2 holes, one for the normal chocolate and the other for the probiotic version of the same chocolate. Triplicates of plates were done and incubated at 37ºC for 24- 48 hours to check for the zone of inhibition. Zone of inhibitions were present for all the 3 probiotic chocolates confirming the viability of probiotics after adding to chocolates.
Invivo study
Part 1
blinded investigator randomly divided the children into 3 groups with 30 children in each group using table of random numbers. Primary investigator was not aware of the allocation process. The study was conducted in 2 phases. For phase 1 of the trial the groups were:
Milk chocolate (MC)
White chocolate (WC)
Dark chocolate (DC)
For phase 2 of the trial the groups were:
Probiotic Milk chocolate (PMC)
Probiotic White chocolate (PWC)
Probiotic Dark chocolate (PDC)
Saliva and plaque collection
Children in all the groups were asked not to brush their teeth for 48 hours before the day of sample collection. This ensured the presence of old plaque which would contain representative oral bacterial flora. On the test day, they were refrained from eating or drinking 2 hours before sample collection. All the salivary samples were collected at 11 am to reduce any circadian variation in the salivary flow. Children chewed paraffin wax for the collection of baseline salivary samples. The children were provided with sterile uricups to expectorate saliva into the container. Saliva was collected in drool method until 2 ml of saliva was collected.
Rugg-Gunn(1975) was used for estimation of plaque pH. Each plaque sample was thoroughly
mixed with 20 ml of distilled water, measured by a pipette. The samples were thoroughly mixed
until it dissolved. The plaque and salivary samples were further tested for pH and buffering
capacity.
Determination of plaque pH, salivary pH and buffering capacity
The plaque and salivary pH were measured by two blinded examiners using Hannah pH meter. The head of pH bulb was completely immersed into the sample for each of the salivary and plaque samples. The values displayed digitally were recorded after the fluctuations in the reading stopped. The electrode was cleaned with a stream of distilled water between each measurement.
assessed for salivary pH, plaque pH and buffering capacity at 10 minutes, 30 minutes and 60 minutes post consumption of the chocolates.
Phase 2 of the trail was done after a wash out period of 20 days. The children assigned to the milk, white and dark chocolates were assigned to their respective probiotic groups. Similar methodology was followed in the estimation of the plaque pH, salivary pH and buffering capacity. The results were tabulated and analyzed statistically.
Part 2
Determination of S.mutans colony count:
For the second part of the invivo trial, children were recruited following the inclusion and exclusion criteria. Children were randomly divided into 3 groups with 20 in each group using table of random numbers. Primary investigator was not aware of the allocation process. The groups were:
Group І - Probiotic dairy milk Group ІІ - Probiotic milky bar and Group ІІІ - Probiotic dark chocolate
chocolates. Salivary samples were again collected at 2 weeks and 4 weeks post intervention.
S.mutans count was evaluated using spread plate method.
. Thioglycolate sucrose blood bacitarcin agar (TSBB) was used for culturing S. mutans. For preparation of this selective media, trypticase soy agar 4g, Yeast extracts 1g, Thioglycolate 3g, Sucrose 20g, distilled water 100 ml was used. The medium was autoclaved at 121°C, 15 lbs pressure for 15 mins and then it was cooled at 55°C. Two disk of bacitracin (each contains 10 Units) was added and kept in a water bath to maintain the temperature. Finally 2 ml of blood was added to it and mixed.
Molten cooled agar (approx. 15mL) was then poured into the petri dish. Saliva samples of about 1 ml were serially diluted 3 times upto 10-3 dilution. 1ml of diluted saliva was added in the center of sterile Petri dish using a sterile pipette. After the solidification of the agar, 1 ml of the diluted saliva was plated by using a bent glass rod on the agar media and the plates were inverted and incubated at 37°C for 48 to 72 hours. The colonies were identified by morphology and confirmed using gram staining and catalase test. The results were tabulated and analyzed statistically.
Statistical analysis:
Consort flowchart - Trial 1
Phase 1
Phase 2
Study population (n = 90)
Milk chocolate (MC) (n = 30)
White chocolate (WC) (n = 30)
Dark chocolate (DC) (n = 30) Post intervention 10, 30 and 60 minutes plaque pH, salivary pH and buffering capacity of saliva assessed
Probiotic milk chocolate (PMC)
(n = 30)
Probiotic white chocolate (PWC)
(n = 30)
Probiotic dark chocolate (PDC)
(n = 30)
Post intervention 10, 30 and 60 minutes plaque pH, salivary pH and buffering capacity of saliva assessed
School 1
Children aged 8- 12 years screened for eligibility
(n = 132)
Statistical analysis
Excluded (n = 42) Did not meet eligibility criteria
Randomization
Baseline assessment of plaque pH, salivary pH and buffering capacity
Washout period of 20 days
Consort flow chart –Trial 2
Group І- Probiotic milk chocolate
(PMC) (n=20)
(n = 20)
Group ІІ- Probiotic white chocolate
(PWC) (n=20)
(n = 20)
Group ІІІ- Probiotic dark chocolate
(PDC) (n=20)
(n = 20) School 2
Children aged 8- 12 years screened for eligibility
(n = 103)
Probiotic chocolates given for 5 consecutive days in a week
Immediate post intervention, 15 days post interventions, 30 days post intervention salivary S.mutans colony
count assessed
Statistical analysis
Lost due to follow up (n = 0) Excluded (n = 43) Did not meet eligibility criteria
Study population (n = 60) Randomization
Figure 1. Armamentarium
Figure 2. Probiotic used for chocolate preparation
[image:44.612.111.508.569.708.2]Figure 4. Saliva sample collection
[image:45.612.132.482.306.709.2]Figure 5. Plaque collection using sterile tooth pick
Figure 6. Distribution of chocolates
Figure 8. Samples collected
Figure 8. Preparation of selective media
[image:47.612.175.439.397.661.2]Table 1. Results for invitro comparison of the six chocolate groups against S.mutans
Table 1 shows the results for invitro comparison of the six chocolate groups against
S.mutans. Milk chocolate showed no zone of inhibition against S.mutans. Addition of probiotic to milk chocolate produced zone of inhibition. White chocolate showed inhibition zone which was lesser than probiotic white chocolate. Dark chocolate showed the maximum zone of inhibition among the normal chocolate groups. Probiotic dark chocolate showed the maximum zone of inhibition among all the chocolate groups studied.
Groups
Zone of inhibition (mm)
Mean ± SD
MC No zone observed
WC 3.15±0.54
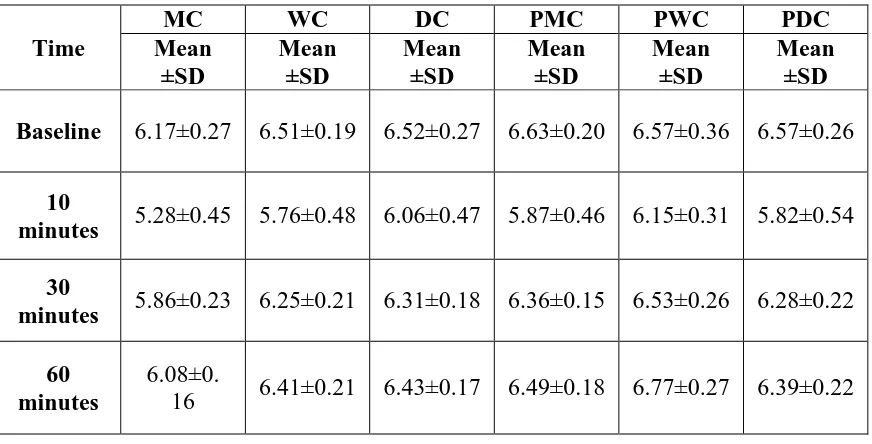
Table 2. Mean distribution of plaque pH in six chocolate groups
Table 2 shows the descriptive statistics of plaque pH in all the six chocolate groups. All the groups showed the minimum pH level at 10 minutes. At the end of 60 minutes PWC showed an increase in plaque pH more than the baseline (6.57±0.36 to 6.77±0.27).
0 1 2 3 4 5 6 7 8
BASELINE 10 MINS 30 MINS 60 MINS
pH
Graph 1. Mean distribution of plaque pH
MC WC DC PMC PWC PDC Time
MC WC DC PMC PWC PDC
Mean ±SD Mean ±SD Mean ±SD Mean ±SD Mean ±SD Mean ±SD
Baseline 6.17±0.27 6.51±0.19 6.52±0.27 6.63±0.20 6.57±0.36 6.57±0.26
10
minutes 5.28±0.45 5.76±0.48 6.06±0.47 5.87±0.46 6.15±0.31 5.82±0.54
30
minutes 5.86±0.23 6.25±0.21 6.31±0.18 6.36±0.15 6.53±0.26 6.28±0.22
60 minutes
6.08±0.
[image:50.612.95.517.446.674.2]Table 3. Mean distribution of salivary pH in six chocolate groups
Table 3 shows the descriptive statistics of salivary pH in all the six chocolate groups. All the groups showed the minimum pH level at 10 minutes.
0 1 2 3 4 5 6 7 8 9
BASELINE 15 MINS 30 MINS 60 MINS
pH
Graph 2. Descriptive Statistics of salivary pH
MC WC DC PMC PWC PDC Time
MC WC DC PMC PWC PDC
Mean ±SD Mean ±SD Mean ±SD Mean ±SD Mean ±SD Mean ±SD
Baseline 7.32±0.31 7.53±0.27 7.43±0.35 7.65±0.19 7.41±0.21 7.59±0.18
10
minutes 5.45±0.72 6.02±1.05 6.41±0.76 5.65±0.92 7.04±0.40 6.93±0.44
30
minutes 6.61±0.49 7.31±0.35 7.23±0.42 7.14±0.28 7.23±0.33 7.36±0.24
60
Table 4. Mean distribution for buffering capacity of saliva in six chocolate groups
Time
MC WC DC PMC PWC PDC
Mean ±SD Mean ±SD Mean ±SD Mean ±SD Mean ±SD Mean ±SD
Baseline 7.10±0.35 7.71±0.19 7.43±0.42 7.66±0.14 6.91±1.23 7.46±0.27
10
minutes 5.28±0.75 5.75±1.21 6.05±0.83 6.95±0.22 6.51±0.96 6.80±0.47
30
minutes 6.46±0.52 7.21±0.31 6.71±0.46 7.27±0.25 6.99±0.83 7.06±0.51
60
minutes 7.02±0.28 7.30±0.21 7.01±0.40 7.44±0.20 7.27±0.31 7.35±0.28
Table 4 shows the mean distribution for buffering capacity of saliva in all the six chocolate groups. All the groups had a minimum pH of saliva at 10 minutes. The pH of saliva after buffering action was higher than baseline in PWC.
0 1 2 3 4 5 6 7 8 9
BASELINE 15 MINS 30 MINS 60 MINS
pH
Graph 3.Buffering capacity of saliva
[image:52.612.92.525.446.695.2]Table 5. Intragroup comparison in the mean difference of plaque pH between different
time intervals studied
* paired t test
Table 5 shows intragroup comparison in the mean difference of plaque pH between different time intervals studied.
Table 6. Intragroup comparison in the mean difference of plaque pH between different
time intervals studied
* paired t test
Table 6 shows intragroup comparison in the mean difference of salivary pH between different time intervals studied.
Table 7. Intragroup comparison in the mean difference of buffering capacity of saliva
between different time intervals studied
[image:55.612.74.563.211.400.2]* paired t test
Table 7 shows intragroup comparison in the mean difference of buffering capacity of saliva between different time intervals studied.
Table 8. Comparison of plaque pH between the six chocolate groups at all the time
intervals studied
Time p value*
Baseline to 10mins <0.001
Baseline to 30 mins <0.001
Baseline to 60 mins <0.001
10 mins to 30 mins 0.026
30 mins to 60 mins <0.001
10 mins to 60 mins 0.005
[image:57.612.153.460.136.391.2]*ANOVA
Table 9. Intergroup comparison for plaque pH among the six chocolate groups at different
time intervals
*Bonferroni post hoc test
Table 9 shows intergroup comparison in plaque pH at all the time intervals. From baseline to 10 mins there was significant difference between groups MC and DC, MC and PWC. From baseline to 30 minutes there was a significant difference between groups MC and PWC, WC and PWC, PMCand PWC and PWC and PDC. From baseline to 60 mins there was a significant difference between groups MC and PWC, WC and PWC and DC and PWC, PMC and PWC and PWC and PDC. From 10 mins to 30 mins there was no significant difference between the groups. From 30 mins to 60 mins there was a statistically significant difference between groups PWC and PDC. From 10 mins to 60 mins there was a statistically significant difference between groups PWC and PDC.
Group Group
Baseline to10 mins p value* Baseline to 30 mins p value* Baseline to 60 mins p value* 10 mins to 30 mins p value* 30 mins to 60 mins p value* 10 mins to 60 mins p value* MC
WC 1.000 1.000 1.000 1.000 1.000 1.000
DC 0.008 1.000 1.000 0.017 0.160 0.160
PMC 1.000 1.000 1.000 1.000 0.192 0.192
PWC 0.002 <0.001 <0.001 0.589 1.000 1.000
PDC 1.000 1.000 1.000 1.000 0.057 0.057
WC
DC 0.296 1.000 1.000 0.294 1.000 1.000 PMC 1.000 1.000 1.000 1.000 1.000 1.000 PWC 0.105 0.004 <0.001 1.000 0.371 0.371 PDC 1.000 1.000 1.000 1.000 1.000 1.000 DC
[image:58.612.75.560.138.454.2]Table 10. Comparison of salivary pH between the six chocolate groups at different time
intervals studied
Time p value*
Baseline to 10 mins <0.001
Baseline to 30 mins 0.003
Baseline to 60mins <0.001
10 mins to 30 mins <0.001
30 mins to 60 mins 0.132 10 mins to 60 mins <0.001
[image:59.612.153.459.135.387.2]*ANOVA
Table 11. Intergroup comparison of salivary pH among the six chocolate groups at different time intervals
*Bonferroni post hoc test
Table 11 shows intergroup comparison in salivary pH among the six chocolate groups at all the time intervals. From baseline to 10 mins there was significant difference between group MC and PDC, DC and PWC, DC and PDC, PMC and PWC, PWC and PDC. From baseline to 30 minutes there was a significant difference between groups MC and DC. From baseline to 60 mins there was a significant difference between groups MC and PMC, WC and DC and DC and PMC. From 10 mins to 30 mins there was a significant difference between groups MC and PWC, MC and PDC, WC and PWC, WC and PDC, DC and PMC, PMC and PWC, PMC and PDC. From 30 mins to 60 mins there was no statistically significant difference. From 10 mins to 60 mins there was a statistically significant difference between groups MC and DC, MC and PWC,
Group Group
Baseline to 10 mins p value* Baseline to 10 mins p value* Baseline to 60 mins p value* 10 mins to 30 mins p value* 30 mins to 60 mins p value* 10 mins to 60 mins p value* MC
WC 1.000 1.000 0.930 1.000 0.173 1.000 DC 1.000 .006 0.260 1.000 1.000 0.001
PMC 1.000 1.000 0.007 0.034 1.000 1.000 PWC 0.020 0.178 1.000 <0.001 1.000 <0.001
PDC 0.007 1.000 1.000 <0.001 1.000 <0.001
WC
DC 0.141 0.229 0.001 0.258 1.000 0.008
PMC 1.000 1.000 1.000 0.357 1.000 1.000 PWC 0.450 1.000 1.000 <0.001 0.518 <0.001
PDC 0.199 1.000 1.000 <0.001 1.000 <0.001
DC
PMC 1.000 0.023 <0.001 <0.001 1.000 .003
PWC <0.001 1.000 0.038 0.001 1.000 <0.001
PDC <0.001 0.663 0.405 0.072 1.000 0.061
PMC PWC 0.006 0.499 0.020 <0.001 1.000 <0.001
PDC 0.002 1.000 0.021 <0.001 1.000 <0.001
Table 12. Comparison of buffering capacity of saliva between the six chocolate
groups at different time intervals studied
Time p value*
Baseline to 10 mins <0.001
Baseline to 30 mins <0.001
Baseline to 60mins <0.001
[image:62.612.154.460.135.391.2]10 mins to 30 mins <0.001 30 mins to 60 mins <0.001 10 mins to 60 mins <0.001 *ANOVA
Table 13. Intergroup comparison of buffering capacity of saliva among the six chocolate groups at different time intervals
* Bonferroni post hoc0
Table 13 shows intergroup comparison of buffering capacity between the groups at different time intervals. From baseline to 10 mins groups MC and PMC, MC and PWC, MC and PDC, WC and PMC, WC and PWC, WC and PDC, DC and PWC, DC and PDC showed a significant difference. From baseline to 30 mins MC and PWC, WC and PWC, DC and PWC, PMC and PWC and PWC and PDC showed a significant difference. From baseline to 60 mins MC and WC, MC and DC, WC and PWC, DC and PWC, PMC and PWC was significant. From 10 to 30 mins MC and WC, MC and DC, MC and PMC, MC and PWC, MC and PDC showed a significant. From 30 to 60 mins there was significant difference between PWC and PDC. From
Group Group
Baseline to 10 mins P value*
Baseline to 30
mins P value* Baseline to 60 mins P value* 10 mins to 30 mins P value* 30 mins to 60 mins P value* 10 mins to 60 mins P value* MC
WC 1.000 1.000 0.003 <0.001 1.000 0.672 DC 0.426 1.000 0.002 <0.001 0.160 <0.001
PMC <0.001 0.809 0.235 <0.001 0.192 <0.001
PWC <0.001 <0.001 1.000 <0.001 1.000 <0.001
PDC <0.001 0.967 1.000 <0.001 0.057 <0.001
WC
DC 0.062 1.000 1.000 0.503 1.000 0.061
PMC <0.001 1.000 1.000 1.000 1.000 <0.001
PWC <0.001 <0.001 <0.001 0.758 0.371 .002
PDC <0.001 1.000 0.587 0.699 1.000 <0.001
DC
PMC 0.013 0.167 1.000 1.000 1.000 0.333
PWC <0.001 <0.001 <0.001 1.000 0.013 1.000
PDC 0.005 0.208 0.485 1.000 1.000 .625
Table 14. Intragroup comparison of S.mutans colony count for Group І at different time
intervals
* Wilcoxon signed rank test
Table 16 shows the intragroup comparison of S.mutans colony count in Group І at various time intervals. A statistically significant difference was found at baseline to post intervention (p<0.001), baseline to 15 days (p<0.001) and baseline to 30 days(p<0.001). No significant difference was found from post intervention to 15 days. From 15 days to 30 days and post intervention to 30 days there was a negative mean difference and percentage reduction in colony count which was statistically significant, indicating increase in colony count. The highest reduction in colony count was found between baseline to post intervention (25.4%) followed by baseline to 15 days (20.8%).
Time
Mean difference 103 CFU
p value* Percentage
reduction
Baseline to post
intervention 71.70 <0.001 25.40
Baseline to 15
days 58.35 <0.001 20.85
Baseline to 30
days 31.95 <0.001 11.50
Post intervention to
15 days
-13.35 0.28 -9.53
15 days to 30
days -39.75 <0.001 -24.70
Post intervention to
30 days
Table 15. Intragroup comparison of S.mutans colony count for Group ІІ at different
intervals
* Wilcoxon signed rank test
Table 16 shows the intragroup comparison of S.mutans colony count in Group ІІ at various time intervals. A statistically significant difference was found at baseline to post intervention (p<0.001), baseline to 15 days (p<0.001) and baseline to 30 days (p<0.001). No significant difference was found from post intervention to 15 days. From 15 days to 30 days and post intervention to 30 days there was a negative mean difference and percentage reduction in colony count which was statistically significant, indicating increase in colony count. The highest reduction in colony count was found between baseline to post intervention (106.7%) followed by baseline to 15 days (95.4%).
Time
Mean difference
103 CFU
p value* Percentage
reduction
Baseline to post intervention
29.93 <0.001 106.75
Baseline to 15
days 25.48 0.001 95.40
Baseline to 30
days 19.10 0.001 69.15
Post intervention to
15 days
-8.53 0.48 -11.35
15 days to 30
days -21.66 0.001 -37.60
Post intervention to
30 days
[image:66.612.112.503.146.455.2]Table 16. Intragroup comparison of S.mutans colony count for Group ІІІ at different time
intervals
* Wilcoxon signed rank test
Table 16 shows the intragroup comparison of S.mutans colony count in group ІІІ at various time intervals. A statistically significant difference was found at baseline to post intervention (p<0.001), baseline to 15 days(p<0.001) and baseline to 30 days(p<0.001). No significant difference was found at post intervention to 15 days. At 15 days to 30 days and post intervention to 30 days there was a negative mean difference and percentage reduction in colony count which was statistically significant, indicating increase in colony count. The highest reduction in colony count was found between baseline to post intervention (152.3%) followed by baseline to 15 days (133.5%).
Time Mean difference
Xx 103 CFU p value*
Percentage reduction
Baseline to post
intervention 53.11 <0.001 152.35
Baseline to 15
days 43.56 <0.001 133.50
Baseline to 30
days 31.35 <0.001 103.30
Post intervention
to 15 days -149.96 0.003 -18.85
15 days to 30
days -279.72 <0.001 -30.20
Post intervention
[image:67.612.68.495.167.432.2]Table 17. Intergroup comparison of S.mutans colony count between groups at all the time
intervals studied
*Bonferroni post hoc test
Table 17 shows intergroup comparison of S.mutans colony count between the groups at all the time intervals studied. There was no statistically significant difference between the groups, expect probiotic milk chocolate and probiotic dark chocolate from baseline to 30 days.
Group Group
Baseline to post intervention
p value*
Baseline to 15 days
p value*
Baseline to 30 days
p value*
Post intervention
to 15 days p value* 15 days to 30 days p value* Post intervention
to 30 days p value*
1
Figure 1. Milk chocolate group showing antimicrobial activity against S.mutans
[image:69.612.208.445.491.705.2]Figure 3. Dark chocolate group showing antimicrobial activity against S.mutans
[image:70.612.203.449.384.621.2]Rugg-Gunn et al75 conducted a study in England and reported that each child consumed a mean of 35 g of chocolate per day. Children’s affinity to chocolates is very strong, and trying to break the bond often results in failure. The age group of 8-12 years was selected because the consumption of chocolates among school going children was observed to be higher than in adolescence.58 Incorporation of probiotics into chocolate could be beneficial to children of this age group who are known to be fond of chocolates. These children belong to the concrete operational stage of Jean Piaget’s cognitive theory. They abide the rules, which make them follow the instructions given to them.68
Selection of chocolates
Chocolates chosen for the study were the representatives of milk, white and dark chocolate variants. Verakaki and Duggal94 compared various chocolates in the European market and found milk chocolate with hazelnut and plain milk chocolate had low acidogenic potential. Nirmala et al compared various filled and unfilled chocolates and found that filled chocolates were more acidogenic. Unfilled plain chocolates were chosen for the present study to avoid effects of other ingredients which could alter the original action of the chocolate. Chocolates used in the present study contained various ingredients. Milk chocolate contained cocoa mass, cocoa butter, milk, vegetable fat, emulsifiers and sugar. Dark chocolate contained 50% cocoa solids, cocoa butter and sugar and white chocolate contained milk solids, hydrogenated vegetable fat, soya lecithin and sugar.
Selection of probiotic
bacterial imbalance.47 The use of replacement therapies would help to maintain the equilibrium of the biofilm and thereby foster health.91 The commonly studied probiotic in the oral cavity are L.reuteri,57,13 L. rhamnosus,55,2,83,72 and L. acidophilus.78,85
The probiotic used for the present study was L.sporogenes which is a spore forming bacteria. Spores are more resistant to adverse environmental conditions thus allowing it to undergo industrial processing.76 This enables the viability even in extreme temperature ranges, reduced cost of production and extended shelf life.42 The probiotic used in this study was the
commercially available BifilacTM sachet. It contains probiotic along with prebiotic bacteria