promoting access to White Rose research papers
White Rose Research Online
[email protected]
Universities of Leeds, Sheffield and York
http://eprints.whiterose.ac.uk/
This is an author produced version of a paper published in
Bioorganic &
Medicinal Chemistry
.
White Rose Research Online URL for this paper:
Published paper
Chu, C.W., Holliday, J.W., Willett, P. (2012) Combining multiple classifications of
chemical structures using consensus clustering, Bioorganic & Medicinal
Chemistry, 20 (18), pp. 5366-5371
Combining Multiple Classifications of Chemical Structures
using Consensus Clustering
Chia-Wei Chu
1, John D. Holliday and Peter Willett
2 Information School, University of Sheffield, 211 Portobello Street,Sheffield S1 4DP, United Kingdom
Abstract: Consensus clustering involves combining multiple clusterings of the same set of objects to achieve a single clustering that will, hopefully, provide a better picture of the groupings that are present in a dataset. This paper reports the use of consensus clustering methods on sets of chemical compounds represented by 2D fingerprints. Experiments with DUD, IDAlert, MDDR and MUV data suggests that consensus methods are unlikely to result in significant improvements in clustering effectiveness as compared to the use of a single clustering method.
Keywords: Cluster analysis, Consensus clustering, Fingerprint, Group-average clustering method, k -means clustering method
1 Introduction
Clustering involves the subdivision of a number of objects (chemical molecules in the present context) into clusters of objects such that each group exhibits a high degree of both intra-cluster similarity and inter-cluster dissimilarity 1. There is an extensive literature on the use of clustering methods for files of chemical structures 2, with applications including property prediction 3, molecular diversity analysis 4, the analysis of substructure search outputs 5, and the merging of corporate databases 6
Many different clustering methods have been used in chemoinformatics. The very first study, by Adamson and Bush
inter alia.
7
, used the single linkage method, which is the simplest of the popular class of hierarchic agglomerative clustering methods. Extensive comparative studies of the clustering effectiveness of over 30 hierarchic and non-hierarchic methods 8 suggested the use of Ward’s hierarchical-agglomerative method 9, with the non-hierarchical Jarvis-Patrick method 10 also performing well. The computational efficiency of the latter meant that it was the method of choice for chemoinformatics applications for many years, although developments in both software and hardware mean that Ward’s method is now employed much more extensively than previously. Other studies have reported the use of modifications of the established Jarvis-Patrick and Ward methods 11, 12 and of methods that had not previously been applied to chemoinformatics 13, 14
Comparative studies of clustering effectiveness are helpful in providing guidelines as to the relative merits of different methods. However, it is most unlikely that any single method will yield the best classification (however that is defined) under all circumstances, even if attention is restricted to a single type of application. For example, when clustering is used to predict biological or
.
1 Current address: Department of Multimedia and Entertainment Science, Asia-Pacific Institute of Creativity, 110, XueFu Rd. Toufen, Miaoli 351, Taiwan
2
physicochemical properties 3, the compounds to be clustered might be represented using different types of fingerprint, different types of property might need to be predicted, different sets of compounds might exhibit different degrees of structural homogeneity, etc. The situation is analogous to that which pertains in virtual screening, where many different techniques have been described for ranking a database in order of decreasing probability of biological activity. The multiplicity of available techniques has fueled interest in the combination of different types of database ranking to yield a single fused, or consensus, ranking that is expected to provide a more robust, and more generally effective, tool than can any single screening technique. Combination procedures are now well-established in both structure-based and ligand-based virtual screening 15, 16
There is an extensive literature on consensus clustering
, and it hence seems appropriate to consider whether analogous procedures might be used to combine the classifications resulting from the use of multiple clustering methods. Such an approach is normally referred to as
consensus clustering, and we shall adopt this term here; other names that have been used in the literature include cluster aggregation, clustering ensembles, median partitioning, and partitions of partitions. Consensus clustering has been used in two main ways, both of which are studied below: to combine the classifications resulting from multiple runs of a single, clustering method (e.g., the non-deterministic k-means clustering method); or to combine the classifications resulting from single runs of multiple different clustering methods.
17-24
, with Gionis et al. providing a helpful introduction to the topic 25. However, we have been unable to identify any discussion of its application in chemoinformatics (although applications have been reported in bioinformatics 26, 27). In this paper, we report an evaluation of consensus clustering for clustering files of chemical structures represented by 2D fingerprints, specifically using an approach based on a consensus similarity matrix as described in Section 2.1. We investigate the use of consensus clustering to combine the classifications resulting from multiple runs of the k-means clustering method, and then investigate its use to combine the classifications resulting from single runs of multiple clustering methods.
2. Materials and Methods
2.1 Consensus similarity matrix
The identification of the optimal consensus given some evaluation function has been shown to belong to a class of computational problems (the so-called NP-complete problems) that cannot be solved in polynomial time and that are known to be extremely demanding of computational resources 19
same cluster. The generation of the matrix is described in the simple pseudo code below, where all the elements of CSM have been initialised to zero and where the counter I loops through each of the
NCLASS classifications in turn. FOR I := 1 TO NCLASS
FOR J := 1 TO N-1
FOR K := J+1 TO N
IF J and K are in the same cluster THEN CSM[J,K] := CSM[J,K] + 1.
If desired, each resulting element CSM[J,K] can be converted to lie between zero and unity by dividing by NCLASS, so that it contains the fraction of the classifications in which J and K co-occur. Once the CSM has been generated, it can be used as input to one’s clustering method of choice (e.g., the Jarvis-Patrick method or Ward’s method) for the generation of the final consensus classification, in just the same way as a conventional similarity matrix acts as the input to a clustering method for the generation of an individual classification.
It will be realised that the simple procedure above assumes that multiple non-hierarchic classifications are available, so that the procedure involves combining NCLASS partitions. If multiple hierarchic classifications are available then two strategies are possible. First, a similarity threshold can be applied to the dendrogram describing each hierarchic classification to obtain a set of partitions prior to the generation of the CSM. Alternatively, if J and K are in the same cluster then CSM[J,K] can be incremented not by one but by the similarity level at which they are first clustered together in the hierarchy (although this makes assumptions regarding the distribution of clustering levels in the classifications that are being combined).
This CSM-based approach has been used to generate consensus classifications for both multiple runs of a single clustering method and individual runs of multiple methods as described in the following section.
2.2 Combination of classifications from multiple runs of a single clustering method
2.2.1 Datasets and clustering method
molecule-cluster similarity is calculated using the Euclidean metric between the molecule’s fingerprint and the centroid of the cluster, where the centroid is the arithmetic mean of the fingerprints of the molecules currently contained in the cluster.
The experiments used data from the Directory of Useful Decoys (DUD) and
Maximum
Unbiased Validation (
MUV) datasets (available at http://dud.docking.org/ and http://www.pharmchem.tu-bs.de/lehre/baumann/MUV.html, respectively. Each of these contains groups of ligands that exhibit a common biological activity, with the groups having been designed to provide a benchmark for quantitative evaluations of virtual screening methods. Our studies involved a total of 3691 molecules from 40 DUD activity classes and 510 molecules from 17 MUV activity classes, with the molecules being characterized by Pipeline Pilot extended connectivity fingerprints that encode circular substructures using a calculation based on the Morgan algorithm 282.2.2 Consensus clustering method
. Each non-hydrogen atom in a molecule is assigned an initial code based on the number of connections, the element type, the charge, and the mass. This code, in combination with bond information and with the codes of the immediate neighbour atoms, is hashed to produce the next order code, and the process repeated until a circular substructure of the required size has been encoded. The ECFP_4 fingerprints used here described circular substructures with a diameter of four bonds.
The consensus similarity matrix was computed from multiple k-means runs as described in the previous section, and then the consensus classification generated using the group average clustering method (specifically, the unweighted pairs group method using arithmetic mean, or UPGMA). This is one of the family of hierarchic agglomerative clustering methods 1, 2
The procedure takes just a few seconds on low-end PC equipment for the generation of the CSM from the individual classifications and then for the generation of the UPGMA hierarchy from the resulting CSM; this is much less time-consuming than the generation of the NCLASS (here 20) different classifications. However, like many clustering procedures, the overall time and space requirement is of complexity O(N
and is probably the most generally effective of the linkage members of this family, providing a balance between the extreme clustering criteria used in the single linkage and complete linkage methods. A threshold was applied to the group-average hierarchy to obtain the required number of clusters, i.e., 40 for the DUD dataset and 17 for the MUV dataset.
2
2.2.3 Evaluation of performance
) for N molecules, and the computational requirements hence increase rapidly as larger files need to be processed (such as the MDDR and IDAlert files described in Section 2.3).
so that each final cluster contained all the molecules from a single activity class and no molecules from any of the other classes. The difference between the observed distribution of molecules and this ideal distribution can be computed using the Rand index 29
Assume that we are comparing a partition, X, of a total of n molecules resulting from a single
k-means run with the ideal partition, Y. Then the Rand index involves considering the extent to which pairs of molecules do, or do not, occur in the same cluster in X and in Y. Let there be a pairs that are in the same cluster in X and also in the same cluster in Y, b pairs that are in different clusters in X and different clusters in Y, c pairs that are in the same cluster in X and in different clusters in Y, and d pairs that are in different clusters in X and in the same cluster in Y. The Rand index,
.
RI
d c b a
b a RI
+ + +
+ =
, is then given by:
.
The index takes values between zero and unity, with the former representing complete disagreement (i.e., there is no agreement between the partitions for even a single pair of molecules) and the latter representing complete agreement (i.e., the partitions are identical), respectively. Although widely used, RI has limitations in that its expected value for two random partitions does not have a constant value, and in that its value approaches its upper-bound as the number of clusters increases 30. We have hence also computed the Fowlkes-Mallows Index 31
)
)(
(
a
c
a
d
a
FMI
+
+
=
,which has been designed to address the limitations of the basic RI.
2.3 Combination of classifications from single runs of multiple clustering methods
2.3.1 Datasets and clustering methods
The two datasets were clustered using nine different clustering methods: these methods are described briefly below, with the reader being referred to the listed sources for further details. The first was the group average method, a hierarchic agglomerative method that has been described in the previous section. Ward’s is another such method that has been widely used for chemoinformatics applications of cluster analysis 2. Székely and Rizzo have described a generalisation of Ward’s method 34, which Varin et al. found gave excellent results for the clustering of several PubChem datasets 12; this method is referred to here as extended Ward’s. The k-means method was the first of the relocation clustering methods 35. It involves an initial partition that is progressively refined by moving objects from one cluster to another to optimize a chosen clustering criterion 1, 2. Two versions were used here, one using a criterion that seeks to maximize within-cluster similarity, and the other a criterion that seeks to minimize between-cluster similarity; these criteria are referred to as I2 and E1, respectively, by Zhao and Karypis 36. There has been much recent interest in a development of this method, sometimes called hierarchic k-means, that provides an efficient tool for hierarchic divisive clustering of large datasets 6, 13, 37. This was used with the same two optimization criteria as for the conventional k-means method. Finally, Yin-Chin and CAST 38 were two of the methods evaluated by Raymond et al. in a comparison of both established and new methods for clustering several compound series represented by both fingerprints and chemical graphs 14. The Yin-Chen method 39
The Yin-Chen and CAST methods were coded from the published descriptions, the Ward and extended Ward methods used the implementations in the Energy package of the R statistical system (available at http://www.r-project.org), while the runs for the other five methods were carried out using the implementations in the CLUTO (for CLUstering TOolkit) software package
identifies clusters that are connected components of the graph described by a similarity matrix, i.e., it merges objects if their separation is greater than a threshold similarity (which can be varied so as to identify a required number of clusters). The CAST method is based on an approximate clique-finding algorithm that avoids much of the costly enumeration necessary in traditional algorithms, and that uses a threshold parameter t to establish cliques of mutually similar objects; this adjustable parameter was set in our experiments to yield the desired number of clusters (or, more generally, as close to that number as possible).
40
2.3.2 Consensus clustering methods
. Runs were carried out to generate partitions containing 500, 600, 700, 800, 900 and 1000 clusters. In the case of the Ward, extended Ward, group average and two hierarchic k-means methods, a threshold was applied to the hierarchy to obtain the required number of clusters, and this number was used as the input for the two k-means methods; in the case of the Yin-Chen and CAST methods, the methods’ parameters were varied to achieve a number of clusters as close as possible to that required.
by application of one of seven different consensus clustering methods as described below. Of these, the CCPivot and BOK methods (vide infra) were coded from the published descriptions while the remainder used the implementations in the CLUTO package.
The first three consensus clustering methods were the conventional single linkage, complete linkage and group average hierarchic agglomerative methods, with thresholds applied to the resulting hierarchies to obtain partitions containing 500, 600, 700, 800, 900 or 1000 clusters. When the single linkage method has been used for consensus clustering it has been referred to as the majority rule or the quota rule 21, 41. The DIRECT procedure in CLUTO provided the next consensus clustering method. This is a k-means-like method that uses a greedy optimizer to move objects between clusters so as to maximise the value of a chosen criterion function, which in this case was the CLUTO default function (called I2) 42. The min-cut graph partitioning clustering method in CLUTO applies a connected components algorithm to the similarity matrix to give a partition that contained (as close as possible to) the required number of clusters. The BOK (for Best Of K) method picks one clustering from the set of input classifications and measures its similarity to each other classification using the Rand Index 28. The consensus classification is then the classification that has the greatest mean Rand Index 19. Finally, the CCPivot method 43, 44 picks an object at random as an initial cluster pivot and then assigns to that cluster every object with a consensus similarity greater than a pre-defined threshold. It then picks another pivot from the remaining, unclustered objects and continues in this way until all the objects have been clustered (i.e., the procedure is essentially that used in the sphere exclusion approach to dissimilarity-based compound selection 45
2.3.3 Evaluation of performance
). This method was found to be extremely sensitive to the choice of initial pivot and similarity threshold: it was hence run 30 times with different pivots and thresholds for each experiment, and that consensus classification chosen that gave the best fit to the required number of clusters.
The consensus classifications were evaluated on the extent to which they clustered together compounds that belonged to the same activity class. Two evaluation measures were used: the F -measure, which was first devised to evaluate methods for document clustering in information retrieval
46
; and the QPI- (for quality partition index) measure, which was devised by Varin et al. to measure the separation between actives and inactives resulting from use of a clustering method 47
Assume that a cluster contains n compounds, that a of these are active and that there is a total of A compounds with the chosen activity. The precision, P, and the recall, R, for that cluster are then
.
n a P= and
A a R= ,
and F is then the harmonic mean of P and R, i.e.,
R P
PR F
This calculation is carried out for each and every cluster and the F-measure is then the maximum value obtained across all of the clusters, i.e., it describes that single cluster that provides the best combination of precision and recall for the current bioactivity.
Define an active cluster as a non-singleton cluster for which the percentage of active molecules in the cluster is greater than the percentage of active molecules in the dataset as a whole. Let p be the number of actives in active clusters, q the number of inactives in active clusters, r the number of actives in inactive clusters (i.e., clusters that are not active clusters) and s the number of singleton actives. Then the quality partition index, QPI, is defined to be
s r q p
p QPI
+ + +
= ,
with a high value occurring when the actives are clustered tightly together and separated from the inactive molecules. The QPI-measure hence describes the entire set of clusters, whereas the F -measure describes the single, best cluster.
Consensus classifications were generated for each of the seven consensus clustering methods when applied to each of the two datasets (MDDR and IDAlert) to obtain each of the six partitions (500-1000 clusters in 100-cluster steps). The F and QPI values were computed for each such consensus classification.
3. Results and Discussion
3.1 Combination of classifications from multiple runs of a single clustering method
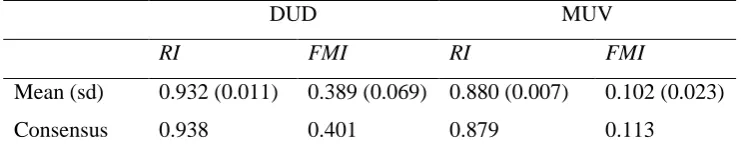
The k-means clustering method was run 20 times for each dataset, and the RI and FMI values computed for each run. The means and standard deviations for the indices are listed in Table 1. The table also contains the index values for the consensus classifications obtained from the sets of 20 individual clustering runs. Inspection of the table 1 shows that the consensus clustering is never significantly better than the individual clustering runs, suggesting that there is no benefit to be gained from using a consensus approach.
3.2 Combination of classifications from single runs of multiple clustering methods
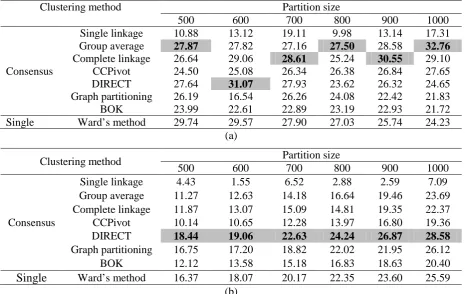
The mean F and QPI values, averaged over the eleven activity classes in each dataset, are shown in Tables 2 (for the MDDR dataset) and 3 (for the IDAlert dataset), where the best-performing consensus clustering method in each column of the table has been shaded and bold-faced for ease of reference.
DUD MUV
RI FMI RI FMI
[image:10.595.65.436.72.149.2]Mean (sd) 0.932 (0.011) 0.389 (0.069) 0.880 (0.007) 0.102 (0.023) Consensus 0.938 0.401 0.879 0.113
Table 1. Effectiveness of clustering (averaged over 20 individual runs) and of consensus clustering using the DUD and MUV datasets and three clustering indices
linkage, group average and DIRECT perform well on the MDDR data using F, while DIRECT is consistently the method of choice using QPI. With the IDAlert dataset, as shown in Table 3, group average again performs very well using F while the QPI results are dominated by the graph partitioning method, followed by DIRECT. Overall then, it would seem that group average or DIRECT are the methods of choice for consensus clustering as implemented here.
For comparison with the consensus methods, the bottom row of each table contain the results when a single classification is generated using the established Ward’s method. A comparison of these results with those for the best consensus clustering method in each case (i.e., that marked as shaded and bold faced) shows that the latter is nearly always to be preferred, the sole exception being the 500-cluster MDDR partition using the F criterion. We hence conclude that a consensus method can
indeed out-perform the current standard clustering method for chemoinformatics applications. However, this is certainly not the case if we are restricted to a single consensus method, as would be the case in any practical context. For example, if we take group average as the consensus method of choice then inspection of the corresponding F and QPI values in Tables 2 and 3 shows that Ward’s method out-performs consensus group average just as many times as the converse is true.
4. Conclusions
Clustering method Partition size
500 600 700 800 900 1000 Single linkage 10.88 13.12 19.11 9.98 13.14 17.31 Group average 27.87 27.82 27.16 27.50 28.58 32.76
Complete linkage 26.64 29.06 28.61 25.24 30.55 29.10 Consensus CCPivot 24.50 25.08 26.34 26.38 26.84 27.65 DIRECT 27.64 31.07 27.93 23.62 26.32 24.65 Graph partitioning 26.19 16.54 26.26 24.08 22.42 21.83 BOK 23.99 22.61 22.89 23.19 22.93 21.72 Single Ward’s method 29.74 29.57 27.90 27.03 25.74 24.23
(a)
Clustering method Partition size
500 600 700 800 900 1000 Single linkage 4.43 1.55 6.52 2.88 2.59 7.09 Group average 11.27 12.63 14.18 16.64 19.46 23.69 Complete linkage 11.87 13.07 15.09 14.81 19.35 22.37 Consensus CCPivot 10.14 10.65 12.28 13.97 16.80 19.36 DIRECT 18.44 19.06 22.63 24.24 26.87 28.58
Graph partitioning 16.75 17.20 18.82 22.02 21.95 26.12 BOK 12.12 13.58 15.18 16.83 18.63 20.40
Single
Ward’s method 16.37 18.07 20.17 22.35 23.60 25.59 [image:11.595.66.532.72.366.2](b)
Table 2. Effectiveness of clustering of the MDDR dataset: (a) F values, (b) QPI values.
Clustering method Partition size
500 600 700 800 900 1000 Single linkage 7.91 12.70 8.69 12.25 17.75 18.26 Group average 18.62 24.86 23.93 26.14 28.15 26.12
Complete linkage 16.97 19.37 21.23 23.20 22.15 21.30 Consensus CCPivot 17.82 18.75 21.28 25.04 20.58 19.53 DIRECT 25.42 22.98 23.71 22.03 24.72 22.01 Graph partitioning 24.92 21.04 21.76 21.48 20.21 19.65 BOK 22.85 21.67 21.38 21.13 20.62 18.68
Single
Ward’s method 21.50 21.35 21.59 21.59 21.19 20.60(a)
Clustering method Partition size
500 600 700 800 900 1000 Single linkage 1.53 4.74 3.50 5.52 4.80 3.85 Group average 6.24 7.04 8.39 8.94 11.22 11.40 Complete linkage 4.99 6.91 7.35 9.10 9.96 10.57 Consensus CCPivot 4.24 5.26 5.57 7.12 7.06 7.76
DIRECT 8.19 9.86 11.22 11.60 12.81 14.31
Graph partitioning 8.47 9.98 11.35 11.61 13.44 13.68 BOK 7.52 8.71 9.93 10.94 12.22 13.22
Single
Ward’s method 7.07 7.29 8.30 8.93 9.68 10.38(b)
[image:11.595.68.530.420.719.2]References