COMMISSION OF THE EUROPEAN COMMUNITIES
EVOLUTION OF CONCENTRATION
IN THE UNITED KINGDOM
CEMENT INDUSTRY:
STRUCTURE, CONDUCT AND PERFORMANCE
COMMISSION OF THE EUROPEAN COMMUNITIES
EVOLUTION OF CONCENTRATION
IN THE UNITED KINGDOM
CEMENT INDUSTRY:
STRUCTURE, CONDUCT AND PERFORMANCE
This report, commissioned by the Directorate-General for Competition
of the Commission of the European Communities, has been written and prepared
by Charles K. ROWLEY and George K. YARROW with the collaboration of Graham BANNOCK Economists Advisory Group Limited
54b Tottenham Court Road London Wl P 9RE
A bibliographical slip can be found at the end of this volume
©Copyright ECSC- EEC- EAEC, Brussels-Luxembourg, 1978
Printed in Belgium
PREFACE
T.be present volume is part of a series of sectoral studies on the
evolution of concentration in the member states of the European
Community.
Those reports were compiled by the different national Institutes and
experts, engaged
b,ythe Commission to effect the study programme in
question.
Re~ing
the specific and general interest of these reports and the
responsibility taken by the Commission with regard to the European
Parliament, they are published wholly in the original version.
The Commission refrains from commenting, only stating that the
responsibility for the data and opinions appearing in the reports,
rests solely with the Institute or the expert who is the author.
Other reports on the sectoral programme will be published by the
Commission as soon as they are received.
The Commission will also publish a series of documents and tables of
syntheses, allowing for international comparisons on the evolution of
ACKNOWLEDGEMENTS
The statistical analysis of concentration in the UK cement
industry presented in this book is based upon the exceptionally
accurate information, derived on a consistent basis for use in the
fixing of common minimum prices within the Federation. Published
material in company accounts is an inadequate source of information
for this industry and we are immensely indebted to the Cement Makers'
Federation for making confidential data available and in particular
to its Director, Rear Admiral C.K.T. Wheen, C.B., who also has
commented helpfully upon the work.
We are grateful to the senior management of The Associated
Portland Cement Company (now Blue Circle Industries), The Ribblesdale
Cement Company, The Aberthaw and Bristol Channel Portland Cement
Company, The Rugby Portland Cement Company and Tunnel Cement Ltd., who
gave willingly of their time to assist us in our investigation.
We are indebted also to Dr. R. Linda for his interest and
enthusiasm in the course of the study, and for his helpful criticisms.
We express our thanks to Mrs C.P. Garner, who worked quickly and
efficiently in typing the final Report.
Charles K. Rowley
Chapter 1
Chapter 2
Chapter 3
Chapter 4
Chapter 5
Chapter 6
Chapter 7
Chapter 8
Chapter 9
Chapter 10
Appendix 1
Appendix 2
TABLE OF CONTENTS
INTRODUCTION
THE NATURE AND EXTENT OF PRODUCTION
COST AND OUTPUT
OWNERSHIP AND CONTROL
RECENT DEVELOPMENTS IN THE CONCENTRATION OF THE CEMENT
INDUSTRY
THE COMHON PRICE AND MARKETING AGREEMENT
INTERNATIONAL TRADE
RECENT DEVELOPMENTS IN THE UK CEMENT INDUSTRY
INTERNATIONAL COMPARISONS
COMPANY PROFILES
Summary of Data from Company Reports and Accounts
Profit and Loss Accounts
Page
1
3
19
29
39
91
119
123
131
143
169
Chapter I INTRODUCTION
This study of the United Kingdom cement industry was sponsored by the
Commission of the European Communities as part of a wider series of such
industrial studies throughout the E.E.C. A central objective of this series
is to provide a detailed statistical analysis of changes in the concentration
of industries selected for investigation, applying a standard methodological
framework specified by the Commission. In addition, each study addresses
itself to questions concerning the extent to which firms are connected by
interlocking shareholdings and interlocking directorates, the concentration
of share ownership and the significance of company directors' interests in
the capital of their own firms. Furthermore, each study investigates such
practices or agreements as are likely to prove detrimental to competition
within the industry under investigation.
For the most part, the studies are based upon statistical information
extracted from company reports and, as such, are exposed to all the
inconsistencies and limitations that such reports contain. In our case,
however, statistical information available to the 'independent costs committee
of the Cement Makers' Federation for purposes of fixing common prices was made
available to us on a strictly confidential basis. In consequence, the
concentration analysis throughout Chapter 5 is based on cement-specific
information provided on an entirely consistent basis. For this reason, our
results are exceptionally accurate and our general conclusions are drawn with
an unusual degree of confidence.
As a consequence of our investigation, we concluded that significant
connections existed between certain of the six cement producers in the United
Kingdom in the form both of interlocking shareholdings and of interlocking
directorates. For this reason the measures of concentration
were calculatedthe U.K. cement industry. We concluded that the weight of evidence
supported the view that there was a small trend decline in concentration
over the period 1968-1977, although this was more marked in the case of
concentration measures which gave strong weighting to market share
increases by relatively small producers. In no case was a trend increase
in concentration apparent, although there was a marked pro-cyclical tendency
for concentration to increase in the boom and to decline in the recession.
The situation is obscured somewhat by the existence of a common price
agreement within the industry operated by the Cement Makers' Federation.
This price agreement has been endorsed twice by the Restrictive Practices
Court and does not provide high profits to its members. In our view the
structure and the conduct of the UK cement industry does not distort the
movement of cement between the United Kingdom and other E.E.C. countries.
The low level of international trade in cement products is explained in
Chapter 2 THE NATURE AND EXTENT OF PRODUCTION
I. The Composition of Portland Cement
Although mineral cements of one kind and another have been manufactured
for utilisation ~n the building processes since early historical times,
Portland cement is a relatively modern material. The first reference to
'Portland cement' occurs in the patent granted to Joseph Aspdin, a builder
of Leeds, in 1824 for a cement produced by firing a mixture of limestone and
clay. Aspdin's product was not the Portland cement currently manufactured,
but rather an improved hydraulic lime cement, not unlike that described by
the Roman writer, Vitruvius. Indeed, it was not until 1845 that the first
true Portland cement in the modern sense was produced in Kent by firing a
mixture of chalk and clay to a temperature sufficiently high as to complete
the chemical and physical reactions which occur in the manufacture of modern
cement.
Hydraulic cements, of which Portland cement is by far the most important,
are so-named because of their ability to set and develop strength under water.
They are mineral substances which, in fine powder form, react with water,
evolving heat and forming a strong, dense mass of very low solubility. The
principal hydraulic compounds present in Portland cement are tricalcium
silicate (50-70 per cent), dicalcium silicate (20-30 per cent), tricalcium
aluminate (5-12 per cent) and calcium aluminoferrite (5-12 per cent). As
indicated, the proportion of each of these compounds present in the finished
cement depends both on the raw materials utilised and on the production proces!
employed. Variations in proportion affect the properties of the cement and
controlled variations are exploited to produce different types of Portland
cement.
These hydraulic compounds of calcium are formed, in the process of
silicon, aluminium and iron present 1n the raw mix as they are brought to
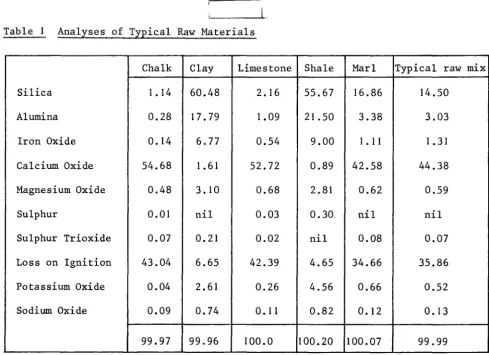
increasingly higher temperatures in the cement kiln. Table I outlines the
common raw materials used in Britain and the typical raw material mix used
in manufacture:
Table I Analyses of Typical Raw Materials
Chalk Clay Limestone Shale Marl Typical raw mix
Silica I. 14 60.48 2. 16 55.67 16.86 14.50
Alumina 0.28 17.79 1.09 21 .50 3.38 3.03
Iron Oxide
o.
14 6. 77 0.54 9.00 I. 11 I. 31Calcium Oxide 54.68 1.61 52.72 0.89 42.58 44.38
Magnesium Oxide 0.48 3. I 0 0.68 2.81 0.62 0.59
Sulphur 0.01 nil 0.03 0.30 nil nil
Sulphur Trioxide 0.07 0.21 0.02 nil 0.08 0.07
Loss on Ignition 43.04 6.65 42.39 4.65 34.66 35.86
Potassium Oxide 0.04 2.61 0.26 4.56 0.66 0.52
Sodium Oxide 0.09 0.74 0. 11 0.82 0.12 0.13
99.97 99.96 100.0 100.20 100.07 99.99
(Source: 'Portland Cement in the Making' published by Cement and Concrete
Association, 1978)
In the majority of cases, the required proportions of oxides in the raw
mix are obtained by blending calcareous materials such as chalk or limestone
with argillaceous materials such as clay or shale. In some cases, however, the
essential oxides occur approximately in the desired proportions and require
[image:10.587.61.550.158.513.2]2. Types of Portland Cement
The main types of Portland cement manufactured in the United Kingdom
are (a) ordinary, (b) rapid-hardening, (c) sulphate-resisting, (d) white,
(e) masonry and (f) blast furnace.
(a) Ordinary Portland cement is the most widely used of all cements,
and accounts approximately for 85 per cent of total United Kingdom cement
production. It has a medium rate of heat evolution and strength development.
(b) Rapid-hardening Portland Cement is similar in chemical composition
to ordinary Portland cement but differs physically in being more finely ground
during manufacture. Although it is not 'quick-setting' the greater specific
surface provided by the finer particle size increases the rate of early
hydration, giving higher early strengths which are important in concrete work
which calls for the early removal of formwork or rapid turn around of precast
concrete units in a mould.
(c) Sulphate-resisting Portland cement is manufactured especially for use
in concretes which may be subject to the effects of sulphates in solution. Such
sulphates attack the hydration product of tricalcium aluminate which is therefore
restricted in this process to not more than 3.5 per cent. This limitation is
imposed by decreasing the alumina in the feed material and by adding extra
iron oxide to the raw mix.
(d) White Portland cement is used for visual effect in white or coloured
concretes which are to be left exposed, and also in white or coloured mortars
for masonry and rendering. It has the same properties as ordinary Portland
cement but is manufactured from special raw materials which substantially are
free from colour-forming compounds such as the iron oxides which give other
cements their characteristic grey or grey-brown colour. The materials used
(e) Masonry cement is produced from ordinary Portland cement clinker
with additives incorporated during grinding. These additives increase
the cohesiveness of the mixed mortar, increase water retention and limit
the development of strength in the mix. Masonry cement is not suitable
for making concrete.
(f) Portland-blastfurnace cement is manufactured only in small
quantities in Britain. However, it represents a significant part of the
outputs of the cement industries of some countries. It 1s made by
inter-grinding ordinary Portland cement clinker with selected granulated
blast-furnace slag. The slag shows little hydraulic activity of its own, but
reacts with the alkaline products of the hydration of the Portland cement.
3. Cement Manufacturing Processes
Although variations of detail, which may be considerable, exist from
plant to plant, all methods of cement manufacture are designed to produce
the same end product and all involve the same fundamental stages.
Firstly, the raw materials are reduced to fine particle size so that
they can be mixed. Secondly, the raw materials are blended and mixed to
produce a raw feed mix of uniform chemical composition. Depending on the
process used, the blending and mixing may take place partly during the
milling stage, or may be a completely separate operation. Thirdly, the
blended raw mix is heated to the point where all moisture is driven off
as steam or water vapour. Fourthly, the dried mix is heated to
decarbon-ation or calci-ning temperature of approximately 800°C. At this temperature,
the calcium carbonate in the mix is dissociated into calcium oxide (free
lime), which remains in the mix, and carbon dioxide which is driven off as
gas. Fifthly, the mix is further heated and as the temperature rises the
oxides of calcium, silicon, aluminium and iron react to form the calcium
silicates, aluminate and aluminoferrite which are the principal active
of around 1400°C. The resulting product is Portland cement clinker.
Sixthly, the clinker is cooled to a temperature at which it can be
handled conveniently, 60 - 150°C. Clinker may be despatched directly
to the finish grinding mills; but usually it is stockpiled. Since
clinker may be stored for relatively long periods without deterioration
it is possible to supply cement to locations far-distant from the works
by shipping clinker rather than finished cement. Seventhly, clinker is
ground to the specified fineness with the addition of a small proportion
of gypsum to control the setting time of the finished cement. Additives
for the special cements are incorporated during the grinding stage.
Finally, the finished cement is stored in silos for a relatively short
time before being despatched to the customer in bags or in bulk. Bulk
delivery, using specially designed dry-bulk carriers, accounts for some
75 per cent of all cement sold in the United Kingdom.
Manufacturing methods can be divided into two broad categories, the
wet and dry processes, which differ in the way materials are dealt with
until stage 4, the calcining stage. In the wet process, the raw materials
are reduced to the requisite fineness in water and are blended, stored
and fed to the kiln as fluid slurry. Water in the slurry - approximately
30-40 per cent by weight - is eliminated in the initial stage of kiln
processing. In the dry process, moisture in the raw materials is eliminated
in part by heating in the initial processing stage, usually in the case of
hard materials, during the grinding stage itself. This relatively dry
'meal' is blended and usually is passed through a preheater system which
completes the drying and (in the case of complete preheater installations)
raises the meal to a temperature at which it is partially calcined.
The two maJor variants of the wet and dry processes are the semi-wet
and semi-dry methods. In both, the raw feed, prepared either by the wet
formed into pellets or nodules with a medium moisture content. The pellets
or nodules are fed into the kiln by means of a grate preheater, in which
the moving bed of nodulised material is dried and brought up to calcining
temperature by heat from the kiln.
The choice of process is dependent upon a combination of factors,
including the nature of the raw materials, the thermal efficiency of the
different processes and energy prices. Following the quadrupling of oil
prices in 1973-74, the relatively fuel-intensive wet process, once widely
used, where the raw materials were chalk and clay, is largely being
superceded by the dry or semi-dry processes wherever the raw materials
are suitable (ideally limestone and shale). Energy prices are also
generating more active consideration of the semi-wet process, which is
still only in limited use throughout the world. In 1977, the wet process
accounted for 67 per cent of kiln capacity in the U.K., the dry process
for 18 per cent and the semi-dry for 15 per cent.
In all processes, kilns are operated continuously, 24 hours a day,
7 days a week, apart from shutdowns for relining with heat-resisting
refractory bricks or other necessary repairs. Grinding mills are
operated to meet current orders.
4. Transport and Distribution
The distribution of cement to customers is a major operation,
involving the large-scale utilisation both of labour and of capital. In
1945, all but a small percentage of the industry's output was sold in
bags, with much of it delivered by rail to rail-served builders' merchants
yards, whence it was finally distributed to the user for site mixing. At
the present time, however, some 87 per cent of UK production, although still
invoiced through merchants, goes direct from the manufacturer to the customer,
accounts for only just over 25 per cent of the total, whilst the remainder
is delivered in bulk to the customers' own silos.
Another significant change has been the relative decline in site
mixing in the more densely populated areas. Only about one-third of all
cement now reaches the construction site as cement itself; the large
majority arrives in the form of ready-mixed concrete or manufactured
concrete products. The ready-mixed concrete industry is the cement
industry's largest single market, taking over 40 per cent of production,
whilst manufacturers of precast concrete and asbestos cement products take
a further 25 per cent. Both industries receive virtually all their cement
in bulk. In 1976, 40.7 per cent of all U.K. cement was delivered to
ready-mixed concrete manufacturers, 22.1 per cent to precast concrete manufacturers,
2.1 per cent to asbestos cement manufacturers, 13.6 per cent to merchants'
yards and 21.5 per cent to sites, etc.
Cement may be delivered direct from the works to the customer; but a
considerable proportion is routed through manufacturers' regional distribution
depots from which local deliveries are made. Deliveries to customers almost
invariably are by road, but despatches from works to depots may be by road
or by rail. In 1977, approximately 84 per cent were by rail. Water transport
(by barge or coastwise shipping in bulk and in bags) accounts for 6 per cent
of all works-to-depot despatches. Virtually all bulk cement is now delivered
in purpose-made pressurised tank vehicles using air discharge. Bagged cement
is delivered by standard platform lorries. In general, the cement
manufact-urers maintain a sufficient fleet of bulk vehicles to meet peak demands,
whereas fleets of lorries for bagged cement are normally only large enough
to accommodate average demand, with lorries and drivers hired additionally
5. Cement and Energy
The manufacture of cement is necessarily energy-intensive, in that
the chemical and physical reactions involved in the production of cement
clinker take place at high temperatures. The greatest use of primary energy
occurs Ln the manufacture of clinker in the cement kiln and major efforts
have been made (even prior to 1973/74) to economise in this input. Between
1965 and 1975, the average energy consumption from fuel in British kilns
fell by 23 per cent from 7.2 to 5.5 giga Joules (GJ) per tonne of clinker.
The process used has an important bearing on the amount of energy
required. In particular, the wet process is much the most fuel-intensive,
since even Ln the most modern wet-process kilns, water evaporation accounts
for 40 per cent or more of the total heat consumption. Thus, in 1975, the
average energy consumption from fuel in British wet-process kilns was
6.60 GJ/t, compared with 3.66 GJ/t for dry process kilns, and 3.42 GJ/t
for the semi-dry process.
Inevitably, there is a world-wide shift towards the use of dry or
semi-dry processes wherever raw materials allow, and to the semi-wet process
elsewhere. In addition, there have been continuing improvements in kiln
design and in associated equipment which also have increased the energy
efficiency of kiln systems. Notable among these have been improvements Ln
the design of the chain system in the drying zone of wet-process kilns, the
adoption of suspension preheaters for dry-process kilns, improvements in
clinker cooler design, and the use of waste heat from the cooler for
recycling purposes.
Approximately 84 per cent of existing kiln capacity is coal-fired,
approximately 11 per cent is gas-fired from the national grid and
approx-imately 5 per cent is oil-fired. Since 1973/74, a number of kilns previously
been devoted in recent years to the use of low-grade fuels in cement
manufacture and, following preliminary trials, pulverized domestic refuse
is now used to supplement pulverized coal fuel in certain cement works.
The firing of raw materials into clinker in the kilns accounts for
just under 90 per cent of the net energy used in cement manufacture. In
addition, the industry consumes substantial amounts of secondary energy
in the form of electricity, especially in the milling of raw materials and
of cement clinker. To economise in electricity costs, grinding mills,
wherever feasibl~ are used during periods of off-peak electricity demand.
6. Cement Production in the United Kingdom
There are seven manufacturers of Portland cement in the United Kingdom:
The Associated Portland Cement Manufacturers Ltd (APCM)
The Rugby Portland Cement Company Ltd (Rugby)
Tunnel Holdings Ltd (Tunnel)
Ribblesdale Cement Ltd (Ribblesdale)
Aberthaw and Bristol Channel Portland Cement Company Ltd (Aberthaw)
The Ketton Portland Cement Company Ltd (Ketton)
Imperial Chemical Industries Ltd (ICI)
APCM own 26 per cent of Aberthaw. Ribblesdale 1s owned 50 per cent by
Tunnel and 50 per cent by Ketton. Thos. H. Ward Ltd. owns 29.9 per cent of
Tunnel and 100 per cent of Ketton. Thus, it also has a majority interest 1n
Ribblesdale. The first six companies listed above manufacture and market
Portland cement and are members of the Cement Makers' Federation (CMF).
ICI markets its cement through APCM and is not a member of the CMF. Currently,
it is the smallest manufacturer and produces cement in order to render
profitable its use of limestone slurry which is a residue from that used 1n
The number of cement producing works in the U.K. has fallen from 51
1n 1968 to 31 in 1978. APCM reduced its number of cement works over this
period from 33 to 16, Tunnel from 5 to 3, and ICI from 2 to 1. One of
Tunnel's works does not manufacture clinker, but only grinds clinker into
cement. The other manufacturers each have the same number of cement works
at present as they had 10 years ago. Rugby has 7, Aberthaw 2, and
Ribblesdale and Ketton one each.
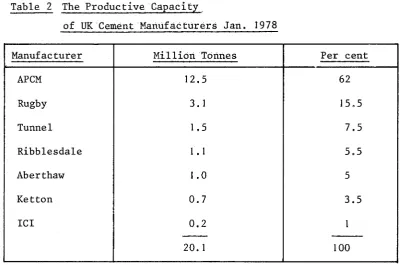
The annual production capacity of the UK industry currently is
estimated at some 20 million tonnes of cement clinker. Table 2 outlines
the rated production capacity of each manufacturer.
Table 2 The Productive Capacity
of UK Cement Manufacturers Jan. 1978
Manufacturer Million Tonnes Per cent
APCM 12.5 62
Rugby 3. 1 15.5
Tunnel 1.5 7.5
Ribblesdale 1.1 5.5
Aberthaw 1.0 5
Ketton 0.7 3.5
ICI 0.2 I
-20.1 100
(Source: Price Commission 'The Associated Portland Cement Manufacturers Ltd. - Increases in Cement Prices' HMSO 495 12th June 1978)
The rate of capacity utilisation varies quite markedly through the
cycle of the construction industry. For example, in 1973 - the peak year
for cement demand in the UK - the throughput actually exceeded rated
[image:18.581.85.489.305.570.2]in 1976 and rose to 80 per cent in 1977 only as a consequence of works
closures. Table 3 outlines UK manufacturers' deliveries of all cement
to the U.K. market over the decade 1968-1977:
Table 3 UK Manufacturers' Deliveries of Cement
to UK Market 1968-77
Year Millions of Tonnes Annual Change
1968 17.6 +2
1969 17.4 -I
1970 17. I -2
1971 17.8 +4
1972 18.0 +I
1973 19.9 +II
1974 17.5 -12
1975 16.8 -4
1976 15.5 -8
1977 14.3 -8
(Source: Price Commission op.cit.)
%
Table 4 analyses U.K. deliveries of cement for the three years 1975
to 1977 by market segment:
Table 4 UK Deliveries of Cement by Market Segment 1975-77
--1975 1976 1977
Harket
Millions of Tonnes
-Readymix concrete 7. I 6.3 6.1
Concrete products 3.3 3.4 3.1
Building sites 3.9 3.4 2.6
Merchants' yards and
2.2 2.1 2.2
stockists
Asbestos cement products 0.3 0.3 0.3
- -
- -
There is very little trade between the UK and other countries 1n
cement, largely as a consequence of relatively high transport costs. UK
exports of cement and clinker were static between 1974 and 1976 at some
one million tonnes each year. In 1977 they rose to 1.75 million tonnes.
APCM accounted for over 90 per cent of UK exports of cement and clinker
during 1976 and 1977. In 1975, its share was 70 per cent. In 1977, APCM
gained The Queen's Award for Export Achievement. Throughout the last five
years, there have been no imports of clinker into the UK. Cement imports,
all into Northern Ireland from the Irish Republic, declined from 100,000
tonnes in 1973 to 10,000 tonnes in 1977.
The Location of Plants
In 1977, Portland cement was produced by 31 works in the U.K., 30 of
which were fully integrated plants producing finished cement from locally
obtained raw materials. The one remaining works (as outlined above) was
restricted to clinker grinding only. The majority of these works are
located in England. There are two works in South Wales, one works in
North Wales, one integrated works and one clinker grinding works in
Scotland and two works in Northern Ireland. Figure 1 outlines the location
of cement works in the United Kingdom 1977, and separates out the works of
the largest cement manufacturer, APCM.
Because of the very high capital costs involved in the construction or
expansion of a cement works, and the high costs of transporting raw materials,
it is important that the works should have raw material resources which will
be economically workable over long periods of time. This is a major factor
both in establishing new works and in planning the future development of
existing works. Throughout the history of cement manufacture, plants have
been closed down because of the exhaustion, or limited future, of their raw
In consequence, the market penetration of the largest cement
manufacturer, APCM, varies markedly across the country. In 1977, it
served 100 per cent of the market in the North of Scotland and Northern
Ireland and over 90 per cent in the West Country. Yet, in parts of South
Wales and Northamptonshire, it controlled less than one-fifth of the
market. Figure I indicates the importance of plant location as a basis
BIBLIOGRAPHY
1. Cement and Concrete Association 'Portland Cement in the Making' 1978
2. National Board for Prices and Incomes 'Portland Cement Prices'
Report No. 38, Cmnd 3381 Aug.1967.
3. National Board for Prices and Incomes 'Portland Cement Prices'
Report No. 133, Cmnd.4215 Nov. 1969.
4. Price Commission 'The Associated Portland Cement Manufacturers Limited
-Increases in Cement Prices' H.M.S.O. June 1978.
5. Reports of Restrictive Practices Cases 'Cement Makers' Federation
Chapter 3 COST AND OUTPUT
It is important to distinguish clearly between cost of production
in the short-run, when cement makers are unable to vary the input of
certain factors such as capital and, increasingly in the United Kingdom,
labour, and cost of production in the long run when all factor inputs may
be varied ~n response to changing market pressures. Both concepts are
important to an understanding of the UK cement industry and its arrangements.
I. Short-run costs
In this study, we have made no attempt to estimate short-run
cost-output functions, either by means of statistical cost analysis or by means
of engineering simulations. Rather, we have attempted to isolate the
changing composition of average total costs of cement in the United Kingdom
over the period 1966 to 1977, using available information, provided by the
independent costs committee of the Cement Makers' Federation, in response
to the requests of various government price control agencies.
In 1966, the average manufacturing cost per ton of UK cement was
75/9d, with the following composition as outlined in Table 5:
- - - ·
-Table 5 Average UK Cement Manufacturing Costs per Ton 1966
r
Input % of Av.Manufg.Cost
Kiln Fuel 27
Electric Power 12
Wages and Salaries 17
Maintenance Materials 13
Works Overheads 9
Depreciation 8
Other Costs 14
-100
--per
(Source: National Board for Prices and Incomes Report No.38: Portland Cement Prices Aug. 1967 at p.7)
It is evident from Table 5 that fuel and power costs accounted at
that time for almost 40 per cent of total manufacturing costs. Table
6
outlines the composition of average total costs per ton of cement which
in 1966 amounted to 110/IOd per ton.
Table 6 Average Total Costs per ton of
UK cement 1966
Input
Manufacturing
Delivery expenses
Sales expenses and containers
Merchants' margins and discounts
(Source: Ibid at p.7)
% of average total cost per ton
68
18
7
7
100
A subsequent report of the National Board for Prices and Incomes,
published in November 1969, provided a more detailed analysis of average
short-run cement costs and offered a comparison between the composition of
such costs in 1966 and in 1969. Table 7 outlines the situation thus
depicted.
Perhaps the most significant change between 1966 and 1969, as
outlined in Table 7 is the fall in the preparation of kiln fuel costs
to total costs of cement production from 18.3 to 16.7 per cent. This
was achieved, despite rises in fuel prices over the period, by cement
makers changing the quality and type of fuel utilised, notably a shift
from oil to coal, and by significant reductions in fuel consumption per
Table 7 Average Cost of UK Cement per Ton 1966-69
-~==~~==========~~==-====--~
Component
Raw materials (including clinker purchased)
Wages
Maintenance materials
Kiln Fuel
Electric power
Works overheads
General administration
Depreciation
Others
Manufacturing cost
Delivery expenses
Sales expenses and containers
Merchants' margins and discounts
TOTAL COST
Year to 31-12-66
% 5.2 11.7 8.6 18.3 7.9 6. 1 3.8 5.4 1.4 68.4 18.3 7.2
6. 1
100
---··-~- ··--·--~,
Six months to 30-6-69
% 5.6 12.0 8.9 16.7 8.2 6.6 4. 1 5.8 1.3 69.2 18. 1 6.8 5.9 100
(Source: These properties were calculated from National Board for Prices
and Incomes: Report No.133 'Portland Cement Prices' Nov 1969
at Table D and p.9)
In 1978, the Price Commission provided detailed information on the
short-run costs of the largest cement maker in the United Kingdom, APCM,
with indications of changes in the company's cost profile which had
occurred between 1973 and 1977. Table 8 outlines in detail the changes
in the composition of costs for that period. The distinction between
purposes but we would stress that the division, especially with regard
to manpower and to repair stores, is arbitrary.
Table 8 Total Unit Costs of APCM (1973 and 1978)
Unit Costs
Production Variable:
Kiln fuel
Electric power
Other
Fixed:
Manpower
Repair stores (maintenance parts)
Process stores
Overheads
Total Production Costs
Distribution
Total Unit Costs
1973 % 19 9 4 14 1 1 4 16 32 45 77 23 100 1977 % 26 10 4 10 10 3 14 - - - · (
Per cent Increase
in Unit Costs 1977:1973 ,
232
193
129
40 208
68
127
112
1 12
37 102
77 146
23 145
100 146
_________
.._
- - - -~---.. --·---.. ·--·--·----.. - - - '(Source: The Price Commission supra at p.28)
As is evident from Table 8 both production and distribution costs
rose to the same extent over the period 1973 to 1977. However, unit variable
production costs (as defined by the Commission) were three times greater,
whilst unit fixed costs (similarly defined) had only doubled. This
differential almost wholly was explained by the proportionately higher
in 1977, energy in terms of kiln fuel and electricity was the largest
cost item in cement production, accounting for nearly 50 per cent of
total production costs, with labour and maintenance costs of less
significance than had been the case in 1973.
As we indicated in Chapter 2, energy utilisation now is central to
the economics of cement making, and indeed is especially sensitive to
the process utilised. Table 9 which outlines information provided by
APCM to The Price Commission, indicates the advantages in terms of cost
per ton of cement of using the dry or the semi-dry process rather than
the wet process in cement production.
Table 9 Cost per ton in Cement Production by Process (Wet Process 100)
Dry Process Semi-Dry Wet Process Process
Kiln fuel 22
Electric Power 15
-
-
-Sub total fuel 37 38 52
-
-
-Manpower 12 12 8
Repair stores (maintenance
12 12 16
parts)
Overheads 16 19 14
Other costs 3 7 10
- --
-TOTAL 80 88 100
(Source: APCM The Price Commission supra p.29)
In 1977, an average wet process works required 22 tonnes of standard
coal for each 100 tonnes of clinker produced, whereas the average dry
widened the total production cost differential between dry and semi-dry
process works and wet process works, from 15 per cent in 1973 to 22 per
cent in 1977.
In such circumstances, UK cement makers have intensified their
efforts to achieve fuel economies, available without major capital
expanditure. For example, APCM during the past few years has carried
out a programme involving the reduction of slurry water content, the
reduction of kiln back-end temperatures, the operation of kilns as
close to capacity as possible, the improvement of wet kiln chain systems,
the improvement of heat transfer from the clinker coolers, and the
reduction of grinding energy requirements and grinding media costs.
Between 1969 and 1977, APCM reduced its energy requirements per tonne
of cement by 17 per cent from 69 therms to 57 therms per tonne, whilst
other UK cement makers reduced their energy requirements from 70 to 64
therms per ton. Since 1972, APCM has used approximately 15 per cent less
energy per tonne than the other UK cement makers. Nevertheless, as Table 8
indicates, kiln fuel costs have still risen relative to other costs between
1 9 7 3 and 1 9 77 .
As is evident from Table 8, since 1973 distribution costs per tonne
have increased at the same rate as production costs. In part, this increase
is explained by the decline in the level of deliveries to the UK market. In
part, it is a consequence of cement makers, individually anxious to maintain
market share, incurring distributional costs by satisfying customers'
demands for delivery from specific plants or at particular times of day for
no additional charge. The Price Commission incorrectly referred to such
activities as "distribution inefficiencies". In reality, of course, they
are an inevitable outcome of competition.
Company-owned and hired vehicles represent the major distribution
cost item, accounting in the case of APCM, for example, for some 58 per
~n the UK are made by its own vehicle fleet, which comprises some 1,000
specialised bulk delivery vehicles and 500 flat platform vehicles for
bagged deliveries. Hired transport occasionally supplements the company's
own fleet for deliveries of bagged cement, but not for bulk deliveries.
Delivery vehicles operated from the 16 works - each of which acts as a
depot - and from 35 independent depots.
Long distance transport represents some 28 per cent of APCM's total
distribution costs. It consists of linear trains which supply on a regular
timetable 34 of the 35 depots, and coastal shipping which deliver cement to
the offshore islands and to Northern Ireland. APCM would like to make
greater use of water transport, utilising its experience of shipping up the
Thames from Northfleet. Presently, high labour costs render this alternative
uneconomic.
Operational research techniques on a computerized system ~s vsed by
APCM to minimise total deliveried costs, though the constraint of satisfying
special customer requirements presently is binding in the actual solutions
achieved.
2. Long-run costs
The information available on the relationship between long-run cement
production costs and capacity of works (i.e. returns to scale) is patchy
and somewhat dated. In particular, all estimates predate the 1973 energy
crisis. Nevertheless, the results are presented here with notice of their
limitations.
Table 10 outlines the principal relationships between costs and scale
for cement manufacture in Germany and in the USA, as outlined in a United
Nations study published in 1963.
The results outlined in Table 10 were reviewed in greater detail for
TablelO Returns to Scale in Cement Manufacture (1963)
-·--Capacity of Works ('000 metric tons p.a.)
--33 66 100 200 400 500 1,000
Fixed investment Eer ton of capacit~:
w.
Germany (index) 200 146 121 100 79-
-USA (index) 120 100 83 80 56
Labour requirements:
USA No. per '000 tons
156 100 67 63 31
(index)
Unit costs Eer ton of caEacity:
W Germany (index) 150 121 114 100 86
USA (index) 116 100 89 84 63
--L---'
(Source: Studies 1n the Economics of Industry 1. United Nations, New York 1963)
Table 11 A Breakdown of Unit Costs for Two HyEothetical US works
120,000 1,000,000 % of total
tons p.a. tons p.a. saving
Cost $ per ton
-Direct labour 3.70 0.90 32
Direct material and water 0.67 0.67
-Power 2.10 2.10
-Fuel 2.37 2.37
-Indirect labour and overheads 3.37 I. 61 20
Depreciation on fixed capital 4.93 2.53 27
Interest on fixed capital 3.89 2.00 21
- -
- -
-21 .03 12.18 100
i
As is evident from Table 10 substantial economies of scale existed 1.n
1963 for labour, fixed capital and overhead costs, but no economies of
scale for materials and fuel.
In 1968, Pratten published estimates, based on engineering simulations,
of the relationship between scale and costs for new UK cement works. The
importance of the assumptions about the number of kilns and mills installed
in works was emphasised. In addition, it was assumed that the 2 million
ton works was sited on the coast, as it was considered uneconomic to
transport I million ton units to an inland site.
Table 12 Estimated Costs for New UK Cement Works 1968
Capacity (000 ton) 100 200 500 1,000 2,000
Number of kilns and mills 1 1 2 2
Indices of costs
Fuel and power 100 98 97 96
Wages and salaries 100 70 55 40
Depreciation and return on capital 100 80 70 58
Overheads 100 90 82 75
Average total costs 100 85 77 69
Value added 100 80 69 58
Marginal cost 100 70 72 61
(Source: Pratten, C.F. 'Economies of Scale in Hanufacturing Industry' C.U.P. 1968 at p.92)
2
95
35
47
70
62
49
55
Although technical scale economies exist for individual kilns in cement
production, process industries prefer, where possibl~ to have at least two
units to provide flexibility for contingencies such as breakdowns and relining.
In 1968, breakdowns represented 5 per cent of capacity per annum in the UK
In conclusion, althoughscaleeconomies exist in cement production,
it is worth emphasising that these may be offset by managerial and
distributive diseconomies if very large units were to be established.
The fact that the average UK cement plant is smaller than that for
continental Europe does not imply necessarily therefore that the UK
cement makers are sacrificing available cost savings in cement manufacture
Chapter 4 OWNERSHIP AND CONTROL
This chapter is concerned with answering four questions:
(a) To what extent are the firms in the UK cement industry connected by
interlocking shareholdings?
(b) How extensive are interlocking directorates between companies?
(c) How concentrated is the ownership of the independent companies 1n the
industry?
(d) Do company directors have significant interests in the capital of
their own firms?
These questions will be considered for each of the six companies in the
Cement Makers' Federation (Associated Portland Cement Manufacturers Ltd.,
Rugby Portland Cement Company Ltd., Tunnel Cement Ltd., Aberthaw and Bristol
Channel Portland Cement Company Ltd., Ribblesdale Cement Ltd., Ketton Portland
Cement Manufacturers Ltd), the main results being summarised in figures 1
and 2 and table 17. In all cases the information has been obtained from the
relevant company reports and accounts for 1976.
Associated Portland
The largest of the cement manufacturers, Associated Portland is an
independent company with relatively dispersed ownership. In 1976 no single
shareholder owned 10% or more of the issued ordinary stock of the company.
The size distribution of shareholdings in that year was as shown overleaf.
Associated Portland held 26% of the issued ordinary share capital of
Aberthaw Cement and appointed one representative to the six-member board of
directors of the latter. The representative concerned was also a director of
Associated Portland. Finally, the combined shareholdings of APCM's board of
directors, including family interests, accounted for only 0.04% of the issued
Size of holding
Number of Total Percentage of Percentage of of ordinary £1
holders holdings total accounts ordinary capital stock
I - 250 13,274 1,913,497 30.3 2.4
251 - 500 II ,843 4,388,652 27.0 5.4
501 - I, 000 10,264 7,601,412 23.4 9.4
I, 001 - 5,000 7,534 14,149,034 17.2 17.5
5,001 - 10,000 385 2,652,809 0.9 3.3
10,001 - 20,000 163 2,458, 711 0.4 3.0
20,001 - 50,000 160 5,355,747 0.4 6.6
50,001 - 100,000 75 5,599,875 0.2 6.9
100,001 - 200,000 59 8,669,867 0. I 10.7
200,001 and above 56 28,194,675 0. I 34.8
Totals 43,813 80,984,279 100.0 100.0
Rugby Portland
Rugby Portland is the only firm in the UK industry which is not connected
with another member of the Cement Makers' Federation through interlocking
shareholdings and directorships. The ownership of the company is relatively
dispersed, the distribution of shareholdings in 1976 is as shown overleaf.
No single holding accounted for 10% or more of the issued share capital
of the company and the directors' interests totalled 0.25% of the ordinary
Table 14
Ordinary Shares (nominal value 25p)
Size of Number of Total Percentage of Percentage of
holding holders holding total accounts ordinary shares
I - 100 I ,422 81,952 5.5 0.1
101 - 250 3,878 677,618 15.0 1.0
251 - 500 4,862 I,808,428 18.8 2.6
50 I - I, 000 6,193 4,479,584 24.0 6.4
1,001 - 5,000 8,30I 16,784,589 32.2 23.8
5,001 - 10,000 707 4,858,716 2.7 6.9
10,001 - 50,000 326 6,301,598 1.3 9.0
50,001 and above II7 35,407,515 0.5 50.3
I
I Totals 25,806 70,400,000 100.0 100.0
I
i
Participating Shares (non-voting, nominal value 5p)
·-Percentage of !
Size of Percentage of I
Number of Total part icipat in,q:
'
holding holders holding total accounts shctres
I
-
100 40 2,603 1.6o.o
I01 - 250 96 16,496 3.9 0.1
251 - 500 246 90,240 9.9 0.3
501
-
1 '000 486 358,433 19.5 I. II ,001 - 5,000 I, 245 2,787,539 49.9 8.6
5,001
-
10,000 21 I I , 45 I , I 56 8.5 4.510,001 - 50,000
I
101 2,067,759 4. I 6.450,001 and above
I
I 68 25,625,774 2.7 79. ITotals 2,493 32,400,000 100.0 100.0
Tunnel Cement
Tunnel Cement 1s part of the group now known as Tunnel Holdings Ltd.
4.3% of the 'B' and 100% of the 'C' ordinary shares of the parent company
are owned by Thos. W. Ward Ltd., a firm with major interests in steel,
engineering and vehicles as well as cement. These shares entitle Thos. W.
Ward Ltd to 29.9 % of the votes attached to the ordinary capital of Tunnel
Holdings Ltd. Prior to 1973 a substantial financial interest in Tunnel
Cement Ltd had been held (since 1911) by the Danish group F.L. Smidth & Co.
A/S, whose principal business is the manufacture of cement making machinery
together with the provision of advice and support in the design and building
of cement works across the world. However, the Smidth group eventually
decided that a large stake in one of the major UK cement manufacturers
conflicted to some extent with their main activities and in 1973 Thos. W.
Ward Ltd. acquired their holding- which at that time accounted for 2,742,910
'A' shares (carrying one vote per share), 382,181 'B' stock units (carrying
one vote per two units of stock) and 40% of the total votes. The Panel on
Take-Overs and Mergers would only consent to the transfer of such a large
block of shares if Thos. W. Ward agreed to a certain reduction 1n the voting
powers of the equity they had purchased. Subsequently all 'A' shares acquired
by the Ward group were converted into a new class of 'C' shares with voting
rights governed by a formula which reduced the entitlement from 40% to 29.99%
of the votes. Upon completion of the transaction, two directors of the Ward
group joined the Tunnel board in place of the resigning Danish directors
nominated by F.L. Smidth and Co., and since that time Thos. W. Ward Ltd.,
have contined to provide two directors for the company. In 1976 the Tunnel
board had nine members.
Apart from the Ward shares, no other holding accounts for 10% or more
of the issued share capital of Tunnel However, Tunnel Holdings Ltd. itself
Ketton Cement Ltd. - a wholly owned subsidiary of Thos. W. Ward Ltd.
Three directors of Tunnel are members of the seven-member Ribblesdale board.
In March 1977 the directors of Tunnel and their families owned 0.77%
of the 'B' ordinary shares of the company.
Aberthaw Cement
In 1977, approximately 26% of the ordinary share capital of Aberthaw
was held by Associated Portland. Apart from this block, no other holding
accounted for 10% or more of the ordinary shares, which were distributed as
follows:
Table 16
-Size of Number of Total Percentage of Percentage of
holding holders holding accounts ordinary shares
I - 500 590 155,693 53.8 4.0
501 - I, 000 200 164,490 18.2 4.2
I, 001 - 5,000 235 531,874 21.4 13.7
5,001
-
10,000 28 201 '242 2.6 5.210,001 - 20,000 24 358.652 2.2 9.2
20,001 - 50,000 5 189,572 0.5 4.9
50,001 - 100,000 II 849,276 1.0 21.9
100,001 and above 4 1,434,958 0.4 36.9
(including APCM,
I million)
Totals I, 097 3,885,757 100.0 100.0
Associated Portland are represented by one of their directors on the
Aberthaw board (made up of six members in 1976).
The beneficial and non-beneficial shareholdings of the Aberthaw directors
accounted for 6.4% and 4.5% respectively of the company's ordinary shares on
Ribblesdale Cement Ltd
Ribblesdale is owned jointly by Tunnel Holdings Ltd and Ketton Cement
Ltd., each of the latter companies having a 50% stake. Since Ketton is a
wholly owned subsidiary of Thos. W. Ward Ltd., who also have a substantial
holding in Tunnel, this implies that, indirectly, the Ward group have a
majority interest in Ribblesdale.
The seven-member board of directors consists of three representatives
each from Tunnel and Ketton together with an independent managing director.
The chairmanship of the board rotates bi-annually between appointees of the
two companies.
Ketton Cement Ltd
Ketton Cement Ltd. is now part of the Thos. W. Ward group of companies,
who therefore appoint its directors. Thos. W. Ward obtained complete control
in the summer of 1973 (at which time they were also acquiring their interest
in Tunnel), having previously held 73.6% of the ordinary shares. Ward had
also acted as the sole selling agents for Ketton's products before 1973.
Ketton has a 50% interest in Ribblesdale Cement Ltd and appoints
thre-representatives to the latter's seven-member board of directors.
SUMMARY
There are significant connections between the companies ~n the UK cement
industry in the form of interlocking shareholdings and interlocking
director-ships. Two firms, Ketton and Ribblesdale, are wholly owned by other firms
involved in the industry, while substantial proportions of the ordinary capital
of Tunnel and Aberthaw are also held by other companies. These ownership links
are paralleled by a similar set of interlocking directorships.
The two independent companies, Associated Portland and Rugby Portland,
have relatively diffuse ovmership. With the exception of Aberthaw, the
Figur~ 1: Interlocking Shareholdings 1976 (Ordinary Shares only)
r---,
!
RUGBY PORTLAND ASSOCIATED PORTLAND TUNNEL KETTON
\
\
I
I
Ill
50%_>~
ABERTHAlrJ RIBBLESDALE
Key: Owned by Associated Portland Ovmed by Tunnel
IIIII
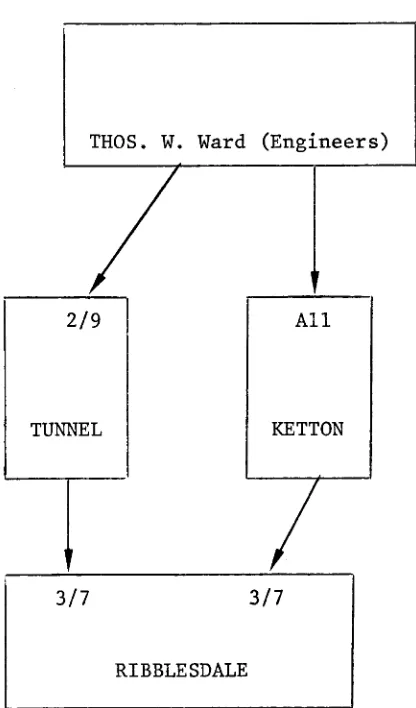
Figure 2: Interlocking Directorships 1976
RUGBY PORTLAND ASSOCIATED PORTLAND
Key: Arrows point to fraction of directors nominated.
\
1/6
ABERTHAW
THOS. W. Ward (Engineers)
2/9 All
TUNNEL KETTON
I
3/7 3/7
[image:42.842.548.756.128.482.2]Table 17 Ownership of Ordinary Shares 1976
*
I
!I
Large holdings: iNominal Number beneficial owner Directors' Directors' holdings
Company Type of share
Value Issued and percentage of holdings as a percentage of
(thousands)
shares held (thousands) shares issued
! Associated
Ordinary stock £1 81000
-
31.196 0.04Portland
Rugby Portland Ordinary shares 2Sp 70400
-
173. 196 0.2SI
II
I
Participating
(non-Sp 32400
-
S28.1SO 1.63I
Ivoting) shares
I
Tunnel 'A' Ordinary shares SOp 137.09
-
-
-'B' Ordinary shares SOp 8860. 190
-
67.9ISo.
77'C' Ordinary shares SOp 2742.910 Thos. Ward (I 00%)
-
-I
Aberthaw Ordinary shares 2Sp 388S.7S7
I
Associated Portland 423.SS9I
10.9l
I
(26%)I
L
I
Chapter 5 RECENT DEVELOPMENTS IN THE CONCENTRATION OF THE CEMENT INDUSTRY
1. General Remarks
This chapter is concerned with recent movements ~n various indices of
concentration for the cement industry. The statistical measures used are
as follows:
Absolute measures of concentration
Concentration ratios
Herfindahl index
Entropy index
Hall-Tideman index
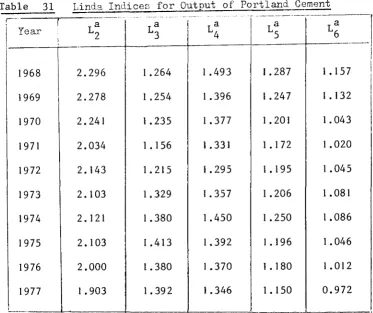
Linda index for all firms ~n the industry
Relative measures of concentration
Coefficient of variation
Redundancy index
Gini coefficient
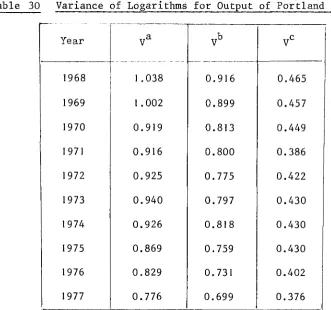
Linda indices for subsamples of firms in the industry
Variance of logarithms
The relative measures are designed to assess the inequalities within
a given sample of observations, whereas the absolute measures are intended
to provide comparisons between the observed distributions and some notion of
a "perfectly competitive" industry. For example, the Gini coefficient and
the variance of logarithms both take the same value (zero) for an industry
composed of two firms of equal size as for an industry containing three
identical firms. In contrast, the Herfindahl and Hall-Tideman indices
would indicate that the latter structure was less concentrated.
For the purposes of the present analysis this distinction between the
~n the cement industry has not changed during the period of interest. In
such circumstances it can be 3hown that there exist positive monotonic
relationships between various absolute and relative indices (see Appendix B).
The measures linked by these relationships are:
the Herfindahl index and the coefficient of variation,
the Entropy index and the redundancy index,
the Hall-Tideman index and the Gini coefficient.
Since the above pairs contain the same statistical information for the UK
cement industry, graphs of the movements of the indices have only been
presented for the absolute measures, although tabulations of both sets of
indices have been provided.
The analysis which follows is divided into two major sections dealing
with the concentration of output and of other variables (employment, capital,
sales, etc.) respectively. This has been done because extremely good data
on market shares for Portland Cement, based on output figures, is publicly
available through the 1978 Price Commission study of the Associated Portland
Cement Manufacturers. The output data has therefore been subjected to a
fairly comprehensive analysis, while the less complete information on the
other variables of interest is presented ~n a more summarised form.
2. Concentration Movements in the Supply of Portland Cement
The basic data for shares of the Portland Cement market is shown in
table 18. Portland Cements account for over 90% of total cement sales in
the UK and movements in relative shares for this market provide accurate
indicators of developments in the industry as a whole. For example, it
can be seen from the table that APCM's share of the Portland Cement market
fell from 61% in 1975 to 60% in 1976 and then to 59% in 1977. Over the
same period the company's share of the total cement market moved in a
The Period 1968-77
Table 18 indicates that the share of the principal producer, APCM,
has fluctuated around a slightly downward trend (continued from earlier
years) since 1968, tending to move upwards when demand is increasing and
downwards when demand is decreasing (for 1968-77, demand has "highs" in
1968 and 1973, and "lows" in 1970 and 1977). Of the two intermediate
sized produceers, Rugby has steadily increased its market share while
Tunnel has fallen back, particularly since 1972. These relative movements
are in line with what might be expected from the profit margins of the two
companies, Rugby having a significantly higher ratio of profit to turnover
than Tunnel. Finally, the market shares of the three smaller companies
have steadily increased over the ten-year period.
Future Prospects
In 1977 APCM operated at a little over 80% of estimated production
capacity; Rugby, Ribblesdale and Aberthaw at around 75%; Tunnel at 95% and
Ketton at 10%, the latter raising its capacity by 14% in 1978. The gradual
recovery of demand expected by the industry over the years 1978-80 is
therefore likely to be of most benefit to the market shares of the first
four companies.
Ownership Considerations
In interpreting the movements 1n the market shares of the six
companies, it is important to take into account the common ownership
arrangements explained in Chapter 4. With these factors in mind two
further sets of market share data have been calculated and are shown in
tables 19 and 20. In table 19 the market share of Ribblesdale has been
allocated equally between Tunnel and Ketton since these latter two companies
table 20, Aberthaw's market share has been added to that of APCM, while
Tunnel, Ketton and Ribblesdale have been consolidated into a single group
representing the holdings of Thos. Ward. The latter aggregation is
appropriate when the interest lies in the concentration of ultimate control
in the market, on the assumption that the 26% stake of APCM in Aberthaw and
the 30% stake of Thos. Ward in Tunnel represent controlling blocks of shares.
The trends shown by table 19 are very similar to those in the
unadjusted data. The addition of 50% of Ribblesdale's (rising) market
share to Tunnel's does not prevent the downward movement of the combined
figure. However, table 20 presents a rather more static picture. The
smaller market shares have disappeared and Rugby becomes the smallest of
the three groupings. APCM's market share shows the same pro-cyclical
variations as before but there is now little indication of a downward trend.
The Ward group has lost a fraction of its share over the period, but Tunnel's
contraction has almost been counterbalanced by the progress of Ketton and
Ribblesdale.
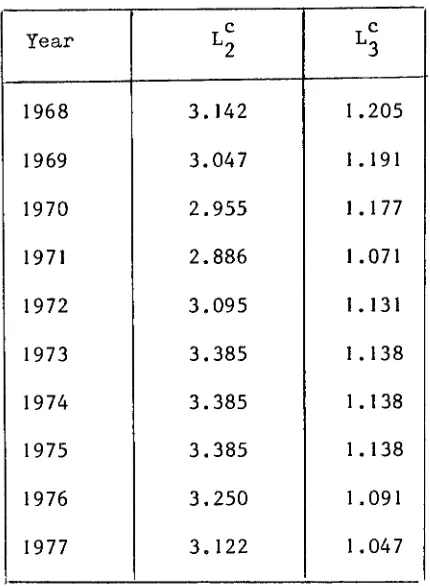
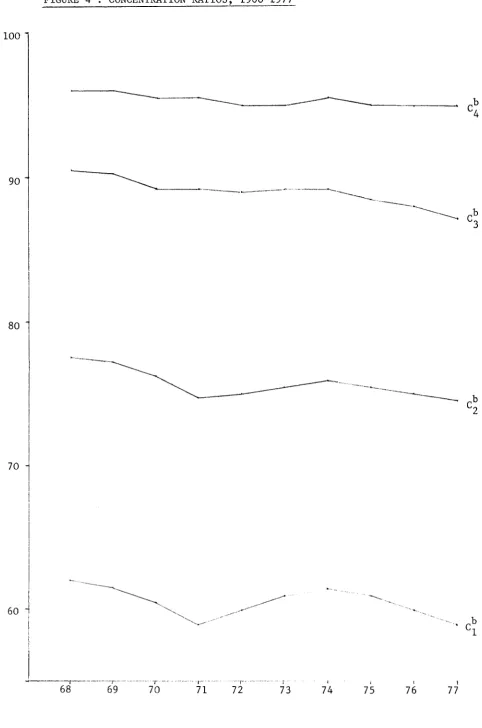
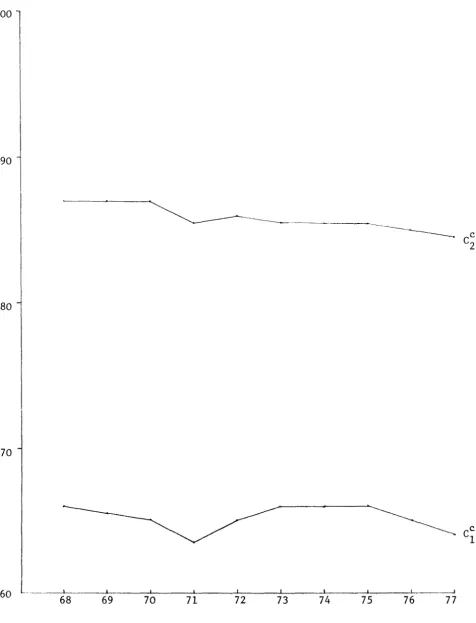
Concentration Ratios
Tables 21, 22 and 23 and figures 3, 4 and 5 show the behaviour of
the various concentration ratios over the period, calculated from tables 18,
19 and 20 respectively. The most significant changes since 1968 are the
relatively steady falls in the three-firm concentration ratios
c;
andC~
resulting from the increasing market shares of the smaller companies. The
fall is greatest for the unadjusted data, which implies a decline from 88.5%
in 1968 to 84.5% in 1977. The two-firm concentration ratio for the unadjusted
data shows a slight upward trend, reflecting the increasing market share of
Rugby since around 1970; but this ceases to be the case when
c
2 is calculated
from tables 19 and 20. Overall, the movement of the concentration ratios
suggests some movement towards a more "competitive" industrial structure