White Rose Research Online
eprints@whiterose.ac.uk
Universities of Leeds, Sheffield and York
http://eprints.whiterose.ac.uk/
This is an author produced version of a paper published in
Genetic
Programming and Evolvable Machines
.
White Rose Research Online URL for this paper:
Published paper
Badran, K., Rockett, P.I. (2010)
The influence of mutation on population
dynamics in multiobjective genetic programming
, Genetic Programming and
Evolvable Machines, 11 (1), pp. 5-33
1
(will be inserted by the editor)
The Influence of Mutation on Population Dynamics in
Multiobjective Genetic Programming
Khaled Badran ∙ Peter I Rockett
Received: date / Revised version: date
Abstract Using multiobjective genetic programming with a complexity objective to
over-come tree bloat is usually very successful but can sometimes lead to undesirable collapse of the population to all single-node trees. In this paper we report a detailed examination of why and when collapse occurs. We have used different types of crossover and mutation operators (depth-fair and sub-tree), different evolutionary approaches (generational and steady-state), and different datasets (6-parity boolean and a range of benchmark machine learning prob-lems) to strengthen our conclusion. We conclude that mutation has a vital role in preventing population collapse by counterbalancing parsimony pressure and preserving population di-versity. Also, mutation controls the size of the generated individuals which tends to dominate the time needed for fitness evaluation and therefore the whole evolutionary process. Further, the average size of the individuals in a GP population depends on the evolutionary approach employed. We also demonstrate that mutation has a wider role than merely culling single-node individuals from the population; even within a diversity-preserving algorithm such as SPEA2 mutation is has a role in preserving diversity.
1 Introduction
It is widely recognized that unless specific measures are taken to prevent it, the chromosomes in a genetic programming (GP) population will ‘bloat’ – that is, continue to grow in size without any accompanying improvement in fitness. (Indeed, Langdon [18], and Langdon and Poli [17] have shown that any variable length representation suffers from the same problem; research on the causes of bloat has been recently summarized in [20].) The objections to bloat are similarly well-rehearsed: i) Excessive computation times and ii) complex solutions which are held to generalize less well than more compact trees. As a consequence, bloat has been the subject of a great deal of research in recent years, both to understand the phenomenon and to avoid its occurrence. Poli et al. [20] have summarized the three main techniques used to control bloat in GP:
1. Limiting the maximum permissible tree depth (or size) to a pre-defined value.
2. Tailoring the genetic operators
3. Employing parsimony to exert selective pressure which favors smaller trees.
The approach of limiting tree depth (or size) is unsatisfactory since the appropriate tree depth (or size) required to solve a given problem is unknown and generally has to be ad-justed iteratively by repeated runs. Silva and Almeida [22] have proposed a dynamic adap-tation of the depth-limit although a hard, Koza-style depth-limit still has to be specified. Pre-determining the maximum tree depth constitutes inductive bias.
Similarly, the tailoring of the genetic operators has proved problematic. Soule et al. [23] found that targeting the redundant code held to be responsible for bloat did not prevent excessive tree growth. Stevens et al. [24] have reported some useful results on controlling bloat by varying the application of disruptive crossover but note that the effectiveness of the method can depend critically on the threshold parameters. Despite showing promise, adapting genetic operators remains an under-developed approach to bloat control.
Parsimony methods have proved popular with a number of authors. Luke and Panait [2] have compared a large number of parsimony pressure methods (in conjunction with depth-limiting). Parsimony pressure methods usually take one of three forms: First, some multiple of a measure of tree complexity – typically the tree node count – is added to a problem-specific error measure to form a solution fitness which favors small, low error trees and tends to penalize large trees. This is effectively a regularization framework but suffers from the same drawback as conventional regularization, namely how to weight the relative con-tributions of error and complexity to obtain the optimal solution [2]. In practice, this usually involves experimentation.
Luke and Panait [19] have proposed a lexicographic parsimony pressure method which principally favors fitness; if individuals have the same fitness, they are then ranked according to size. The drawback with this method is that where few members of the population share the same fitness, tree size is largely ignored [2].
The third parsimony pressure approach is to use a multiobjective method in which the (strictly) non-commensurable objectives of problem-specific error and tree complexity are handled in a Pareto optimization framework [8]. Here, given two solutions of, say, equal error, the solution with the smaller number of nodes is said to dominate the larger solution, is more highly ranked and is thus assigned a better fitness value. It is hence more likely to be selected for subsequent breeding. What results from the Pareto framework is not a single unique solution but a set of equivalent solutions which lie on a Pareto front (or surface) in objective space and which delineate the fundamental trade-offs in the problem; no point on the Pareto front can be modified to improve one objective without simultaneously degrading another. Multiobjective GP (MOGP) has a number of advantages: As well as controlling bloat very effectively, it does not require a pre-determined depth-limit parameter and the tree depth is free to adjust to suit the problem at hand. We have successfully used MOGP for a range of optimizations connected with pattern recognition problems [27–29]. Rodr´ıguez-V´azquez et al. [21] have also reported using MOGP on a systems identification problem in control engineering.
and lead to population collapse. Most of these anonymous reviewers have cited the work of de Jong and Pollack [15] as justification for their view. Thus our primary motivator has been to investigate the role of population collapse in MOGP with a view to reconciling these opposing observations: In essence, we set-out to answer the question “what are we (and other adherents of the MO approach) doing that prevents population collapse and that de Jong and Pollack are not (or vice versa)?” We have previously presented preliminary results from this work [4]; the present paper expands that research to a larger and wider set of circumstances and offers an alternative but complementary analysis of the broader case of population dynamics in multiobjective genetic programming (MOGP).
In the remainder of this paper we will first set-out in Section 2 our methodology and describe the datasets used in this study. In Section 3 we approach our principal question concerning population collapse by reviewing the results of de Jong and Pollack [15]. Here we identify the key difference between our formulation and that of de Jong and Pollack that causes these authors to observe population collapse, namely the pivotal role of mutation. We then go on in Section 4 to compare the influence of generational and steady-state evolution-ary approaches. Additional experiments performed to further confirm our conclusions are presented in Section 5. In Section 6, we discuss the broader implications of this work and offer some concluding remarks.
2 Methodology and Datasets
2.1 Baseline Algorithm
Unless indicated to the contrary, we have used a baseline MOGP formulation throughout this work; this has been deliberately formulated to reproduce the canonical evolutionary method in [15] with which we want to make direct comparison. Our two objectives to be simultaneously minimized are: i) Tree node count which is a simple-to-calculate measure of complexity of the induced mapping, and ii) A problem-specific error calculated over the training set. We have used a fixed population size of 100 individuals, each of which uses a tree representation of the mapping in question.
The initial population was generated with 50% of the trees of fixed depth 7, and the remaining 50% of uniformly distributed depth in the range [1. . .7]; all initial trees were full trees, that is, the depth of all leaves were identical in any given tree. Thereafter, tree depth (and symmetry) were allowed to vary without limit, determined only by the selective pressures.
Selection for breeding followed the scheme of Fonseca and Fleming [13]. Individuals in each generation were ranked according to their Pareto dominance. Thereafter, the rank was mapped to a scalar, sisuch that:
si=1−
Rank(i)
max(Rank)
where Rank(i)is the rank of the i-th individual and max(Rank)is the maximum rank in the sorted population. These scalar values, siwere then used in a conventional roulette wheel
2.2 Crossover Operators
We have used one of two possible crossover operators: Depth-fair crossover [14] or conven-tional Koza-style sub-tree crossover. The depth-fair crossover operator of Ito et al. [14] has been employed since we have found this to be a very effective search strategy. In depth-fair crossover, first a depth in a given parent tree is selected by assigning each depth
d∈[0. . .dmax]in the tree a selection ratio given by:
rd=
1
2d where d∈[0. . .dmax]
where d=0 indicates the root node of the tree.
The depth at which crossover is to take place is then selected in a conventional roulette wheel manner where the size of each segment of the ‘roulette wheel’ is proportional to rd
and the constant of proportionality is given by the normalization condition on the probability of selection. Having selected a depth, dxoverat which to perform crossover, we then select
one of the n possible sub-trees at depth dxover, again using roulette wheel selection. Here
the size of each segment is proportional to the node count of each of the n sub-trees; the normalizing constant of proportionality is the sum of the node counts over the n sub-trees. Depth-fair crossover thus tends to select the larger sub-trees at a given depth. Finally, the two selected sub-trees in each parent are exchanged.
Conventional Koza-style sub-tree crossover [1] assigns an equal probability of crossover to each node in a given parent tree. (In this work we have not used the version of sub-tree crossover which biases the selection 90/10 against leaf nodes [20].)
This baseline algorithm has been varied, as described below, to explore specific facets of the problem. In particular, the two crossover operators – depth-fair and sub-tree crossover – have rather different characteristics. Depth-fair crossover tends to select nodes near the top of the tree and therefore tends to be more disruptive. Sub-tree crossover, on the other hand, has a greater tendency to exchange sub-trees towards the bottom of a tree. We explore the influence of both operators on collapse in the rest of this paper.
2.3 Mutation Operators
One of two possible mutation operators was employed:
– Depth-fair mutation [29] which used the same means of determining the locus of
muta-tion as the depth-fair crossover operamuta-tion [14] – see Secmuta-tion 2.2.
– Conventional Koza-style sub-tree mutation.
In the depth-fair version of mutation, the tree depth, dmutis selected in exactly the same
manner as described for depth-fair crossover in Section 2.2. Similarly, one of the n sub-trees at depth dmutis selected, again in the same way as described in Section 2.2. Having selected
a node in a tree according to the depth-fair procedure, in depth-fair mutation the selected sub-tree is replaced with a new randomly created full sub-tree of depth Nmut. (The value of
Nmutis varied in different experiments – see the following sections for precise values.) On
In sub-tree mutation, the sub-tree to be replaced is chosen by selecting each node in the tree with equal probability. Here, the probability of selecting the root node (and thereby generating a completely new tree) is 1/N, where N is the number of nodes in the tree. As
with depth-fair mutation, the sub-tree selected for mutation is replaced by a new, randomly generated full tree of depth Nmut.
In the same way as with the two crossover operations employed, the two mutation oper-ators have different characteristics, tending either to select near the top of a tree or near the bottom.
In both cases, when mutation was used it was always applied to the offspring resulting from a crossover operation. That is, the probability of mutation was set to unity. As a result of our preliminary experiments, our principal motivation has been to explore the role of mutation and so when we mutate, we always mutate. We consider mutation probabilities less than one in Section 5 of this paper.
2.4 Evolutionary Approach
We have investigated both generational and steady-state evolutionary paradigms. In the gen-erational approach, the top ranked 34 (∼one third of the) members of the population are copied unaltered to the next generation. The remaining 66 members of the new generation are produced by selection and the genetic operations of crossover and (optionally) muta-tion. This is the same elitist approach used by de Jong and Pollack [15] and based on our observations in this work, appears necessary to obtain convergence.
The steady-state strategy we have used is a(μ+2)scheme in which two parents produce a pair of children which are appended to the population; the population is then re-ranked and the two weakest individuals discarded. This is a straightforward GP adaptation of the Pareto Converging Genetic Algorithm (PCGA) of Kumar and Rockett [16]. We have found this approach to be a very effective multiobjective genetic algorithm (GA) method [16] as well as for MOGP [25, 26].
2.5 Datasets
We have studied two types of dataset in this work. Since our primary objective is to re-examine the results of de Jong and Pollack [15], we have considered the simple 6-parity boolean problem. For this problem, we have employed the functions: AND, OR, NAND and XOR and continued evolution for a fixed number of 10,000 tree evaluations (i.e.∼100 generations for the generational algorithm). Here the training data comprised the exhaustive set of possibilities of the boolean function and the aim was to reduce the number of mapping errors to zero.
constants drawn from the set[0.1,0.2, . . . ,0.9,1.0]. Each run was continued for 20,000 tree evaluations (equivalent to∼200 generations of the generational algorithm). Each ML dataset was repeatedly split into two with one half used as the training set and the other as the test set. The statistical differences between trained performance were gauged using Alpaydin’s modification [3] of Dietterich’s 5×2 cv test [10].
3 Population Collapse
De Jong and Pollack [15] have observed that the population in MOGP can rapidly collapse to all trees of a single-node (1-node). According to these authors, when faced with two ob-jectives – an error measure and a tree size – an MOGP algorithm will find it harder to reduce the error measure since this requires sophisticated exploration of the search space and the discovery of better solutions. Reducing the size of the trees, on the other hand,is fairly easy since this can be achieved simply by selecting the smaller individuals. De Jong and Pollack concluded that it was necessary to incorporate explicit diversity-preserving mechanisms to prevent population collapse. Contrary to this, we (and other workers) have not previously needed to use any diversity-preserving mechanisms: resolving the reasons for this contra-diction is the principal motivating factor in this work.
Our starting point was to carefully analyze the work in [15]. These authors conducted a set of three experiments which variously comprised: mutation, a phenotype diversity-preserving mechanism and a genotype diversity-diversity-preserving mechanism although the latter is only readily applicable to discrete optimization problems; crossover was applied in all of de Jong and Pollack’s experiments.
Quite how single-node trees can arise in GP can be seen from Figure 1. If crossover selects the root node of one parent tree and a leaf node from the other, then one of the offspring will be a single-node tree. (The tendency to select a root node will be particularly strong in depth-fair crossover at∼50% whereas sub-tree mutation tends to select leaf nodes.) Indeed Dignum and Poli [11] have shown that sub-tree crossover has a strong tendency to create short – including presumably 1-node – trees.
Once 1-node trees are present in the population they will tend to be be highly ranked due to their small size and hence likely to be selected for breeding. Clearly, any 1-node tree par-ticipating in crossover with another 1-node tree will produce only more 1-node trees. Single node trees will therefore tend to accumulate. In the absence of any mechanism to ensure diversity, the population can rapidly degenerate to all 1-node trees and effective evolution-ary search ceases – in most problems it is unlikely that a 1-node trees will provide a useful solution. This situation is in intriguing contrast to single-objective GP. Given that crossover appears to have a strong predisposition to create 1-node trees [11] which are highly ranked in MOGP due to their size, collapse may ensue. In single-objective GP, however, the single fitness measure can lead to bloat. Thus the crossover bias theory of Dignum and Poli [11] might offer further insight into how multiobjective GP combats bloat.)
3.1 Analysis of de Jong and Pollack’s Work [15]
Fig. 1 Illustration of how crossover can produce single-node trees
analyzed the experiments in [15]. These basically comprised three series of experiments which can be summarized in Table 1. In the first series, crossover alone was used and rapid population collapse was observed. In the second series, crossover, mutation and a diversity-preserving mechanism in phenotype space was used; no collapse was seen. The third and final series of experiments used crossover, mutation and a diversity-preserving mechanisms in both phenotypic and genotypic spaces; again no collapse was observed. When viewed in the form of Table 1, an immediate concern is the simultaneous introduction of both mutation
and phenotype diversity preservation in the second series of experiments. Nonetheless, we
have conducted a series of initial experiments to systematically address the key question of this paper.
Table 1 Summary of the experiments of de Jong and Pollack [15]
Expt. Crossover Mutation Phenotype Diversity
Genotype Diversity
Collapse?
#1 – – – Yes
#2 – No
[image:9.595.70.339.571.621.2]3.2 Initial Experiments
[image:10.595.88.401.292.520.2]As an initial series of experiments, we have used MOGP to evolve solutions to the boolean 6-parity problem, an approach which mirrors the initial experiments in [15]. Using crossover alone (no mutation or diversity preservation) resulted in rapid collapse. This is illustrated in the two upper curves of Figure 2 which show the percentages of 1-node trees in the population as functions of the number of tree evaluations, under a range of experimental conditions. For both sub-tree crossover/no mutation and depth-fair crossover/no mutation collapse to all single-node individuals is rapid; in the case of depth-fair crossover, collapse occurs within∼10 generations of this generational algorithm (see Section 2.4). Although we omit the corresponding plot, the steady-state algorithm produced an essentially identical outcome. We conclude that the evolutionary paradigm is not a factor in collapse. Further, repeating these experiments many tens of times always leads to rapid collapse. These first observations are in complete accord with [15].
Fig. 2 Percentage of single-node trees in the population as a function of the number of tree evaluations.
Boolean 6-parity problem. (Generational algorithm; Nmut=3.) All four of the lower plots including mutation
are coincident on the scale of this graph
As a second experiment, we repeated the above procedure but this time including either sub-tree or depth-fair mutation after each crossover (but still no explicit diversity-preserving mechanism). Nmut, the fixed depth of replacement sub-trees,was set to 3. The results for the
result is not shown here but using the steady-state evolutionary procedure described in Sec-tion 2.4 with mutaSec-tion produces an outcome identical to that of the generaSec-tional algorithm – there is no collapse. We have investigated all eight permutations of generational/steady-state algorithms, depth-fair and sub-tree crossover and depth-fair/sub-tree mutation. The picture is consistent: Mutation – depth-fair or sub-tree – is all that is required to prevent collapse. None of many tens of repetitions of each GP configuration showed any evidence of popula-tion collapse.
Repeating the above set of experiments with the machine learning (ML) tasks produced completely consistent results. Figure 3 shows the plot corresponding to Figure 2 but for the BUPA Liver Disorders dataset. (The results from the other three ML datasets are little dif-ferent and so are omitted.) The same conclusions would be drawn from Figure 3 as Figure 2, indeed from any of the ML problems. As with Figure 2, the four plots at the bottom of Fig-ure 3 which include mutation are intertwined and not separable on this scale but clearly none shows any evidence of collapse; even on a larger scale it is not clear whether any significance can currently be drawn from these data. What is significant and of far greater interest here is that if mutation is omitted, rapid collapse ensues (the upper two plots), again depth-fair crossover collapsing somewhat more rapidly than sub-tree crossover.
(It is clear from the lower plots in Figures 2 and 3 that the percentage of 1-node trees never falls to exactly zero. As explained in Section 2.1, half the trees in the initial population are generated with random depth in the range[1. . .Nmut]. Therefore the initial population
[image:11.595.88.398.397.624.2]contains a small number of 1-node trees typically of rank 1 and because of the elitist nature of the algorithm, they are retained in the population. Hence a small number of 1-node trees persist in the population.)
Fig. 3 Percentage of single-node trees in the population as a function of the number of tree evaluations.
The results in Figures 2 and 3 lead to the first tentative conclusion in this paper: That mutation alone is all that is required to prevent population collapse in MOGP. No explicit diversity preservation operators are needed, a finding which is diametrically opposed to the conclusions in [15]. Indeed, considering Table 1, we speculate that had de Jong and Pollack added just mutation after their first series of experiments, they would not have observed population collapse rendering their subsequent experiments redundant. Whether phenotype diversity preservation acting without mutation would also prevent collapse would seem to be a side-issue: We suggest mutation is the preferable operation since it introduces new diversity into the population and thus enhances the efficacy of the evolutionary search. An explicit diversity preservation mechanism, on the other hand, would seem only to preserve such diversity as already exists in the population. The additional computational burden of calculating an explicit diversity measure would also seem unwarranted.
Quite why mutation acts in this way potentially offers new insights into the operation of genetic programming. Presumably by direct transference from genetic algorithms (GAs), mutation seems hitherto to have been regarded by the GP community as playing a fairly minor role in evolutionary search. Crossover seems to have been regarded as the princi-pal mechanism for prosecuting the search. This is interesting because Chellapilla [7] has successfully obtained GP solutions without crossover while Langdon and Poli [17] have demonstrated that mutation alone can cause bloat. (More generally, of course, bloat can be caused by crossover and mutation acting in concert with fitness-based selection [17].) At the other extreme, population collapse is really a collapse of genetic diversity and therefore the end of meaningful search. Mutation would therefore seem to have a pivotal role in main-taining sufficient diversity to advance the search but unless its effects are carefully kept in check, bloat ensues [17]. Providing a selective pressure within a multiobjective environment which favors smaller solutions counteracts the bloating tendency of mutation. The nature of this balance can be seen from Figure 4. Although Figures 2 and 3 show the percentages of 1-node trees, this is (obviously) a limited view of the population dynamics. From the upper curve in Figure 4 it is clear that apart from an initial transient phase, the mean numbers of nodes in the population remain essentially constant when mutation is applied. The ten-dency of mutation to bloat the population appears to be in equilibrium with the tenten-dency of the parsimony objective to collapse the population. (The lower curve in Figure 4 shows the expected collapse to 1-node trees in the absence of mutation.) In the remainder of this paper we explore the role of mutation, the balance between bloat/maintenance of sufficient diversity to avert population collapse and therefore yield successful search.
(Throughout this paper we take a deliberately limited view of diversity. Measuring diver-sity has been the subject of a great deal of work, much of it associated with single objective GP – see [6], for example – although in multiobjective GP, diversity has a more intuitive interpretation as a uniform sampling of the Pareto front. In this paper we are only concerned with zero diversity (i.e. population collapse) as opposed to sufficient diversity to obtain a solution. We do not address the issue of degrees of diversity within a population.)
4 Exploration of the Evolutionary Configuration
Fig. 4 Average population tree size as a function of the number of tree evaluations. BUPA Liver Disorders
problem. (Generational algorithm / depth-fair crossover / depth-fair mutation; Nmut=3
BUPA dataset since the results from all four problems would lead to identical conclusions. We have varied:
– The evolutionary approach: Generational or steady-state (Section 2.4) – The crossover mechanism: Depth-fair or sub-tree crossover (Section 2.2) – The mutation mechanism: Depth-fair or sub-tree mutation (Section 2.3)
– The (fixed) depth of the new, randomly-generated sub-tree used to replace the sub-tree
selected from mutation. This depth is the Nmutparameter.
The first three variations – evolutionary approach, crossover and mutation method – should alter the population dynamics and thus expose any factors which affect the bloat-collapse balance. In addition, Nmutwill increase the rate at which new nodes are introduced
into the population. In particular, we are interested in knowing whether there is some lower value of Nmut below which collapse occurs. Similarly, is there some value of Nmut above
which the MO parsimony objective can no longer control the growth in tree sizes and bloat ensues?
All the data from these experiments are summarized in Tables 3 to 10 for the BUPA Liver Disorders dataset. (Again, we reiterate that identical conclusions would be drawn from any of the other ML datasets: we (rather arbitrarily) include only results for the BUPA dataset for brevity.) Table 2 shows a summary of the permutations and combinations of: evolutionary approaches, and crossover and mutation operators considered in this section, together with cross-references to detailed results tables and representative plots. Tables 3 to 10 contain the results for varying Nmut between 2 and 10. Each row contains the average for the ten
that we have performed 10 repetitions has been dictated by the statistical test for differences between error rates [3, 10]. All the entries in Tables 3 to 10 are averages over these 10 runs. (We have restricted Nmut to≤10 due to the purely practical limits of the computing time
required to perform ten repetitions for larger Nmutvalues. For example, a single set of ten
repetitions for the steady-state/depth-fair pairing and Nmut=10 took around 8150 seconds
(∼136 minutes). There is thus an eminently practical reason for minimizing Nmut.)
Table 2 Summary of experimental results for Section 4.
[image:14.595.73.435.198.293.2]Evolutionary Approach Crossover Method Mutation Method Table No. Figure No. Steady-state Generational Depth-fair Sub-tree Depth-fair Sub-tree
3 5 4 6 5 7 6 8 7 9 8 10 9 11 10 12
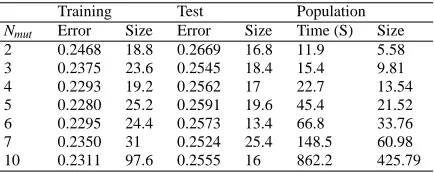
[image:14.595.75.288.451.538.2]Since we are evolving classifiers, we are interested in the best 0/1 loss performance so in Tables 3 to 10, the Training and Test data are the averages from ten runs for the best performing individuals over the Training and Test subsets, respectively. As would be expected, the test errors are slightly larger than the training errors. Training and Test sizes are the mean numbers of nodes in the best solutions identified in each of the ten runs. The timings shown in the sixth columns are the average run-times. The mean tree sizes shown at the extreme right of the tables (“Size”) are the average population sizes taken over all ten runs at termination.
Table 3 Results for steady-state/depth-fair crossover/ depth-fair mutation pairing: BUPA dataset. All entries
are averages over 10 runs.
Training Test Population
Nmut Error Size Error Size Time (S) Size
2 0.2504 9.4 0.2768 7.2 9.5 3.23 3 0.2427 11.4 0.2663 6.4 15.8 3.81 4 0.2435 13.2 0.2673 10.2 27.4 4.18 5 0.2370 24.0 0.2572 18.0 52.8 5.11 6 0.2342 35.6 0.2568 16.8 131.2 6.56 7 0.2304 55.2 0.2515 16.0 225.9 8.75 10 0.2285 69.6 0.2683 12.2 815.7 14.28
Comparing the data in Tables 3 to 10 and Figures 5 to 12, a number of patterns emerge. First, as to whether there is some value of Nmut below which collapse ensues, the answer
would appear not. Even reducing the depth of the replacement sub-tree to 2 does not lead to any evidence of collapse.
Second, although we see no evidence of bloating (i.e. uncontrolled growth within a given run), increasing Nmutdoes lead to an increase in both the average size of the best performing
Table 4 Results for steady-state/depth-fair crossover/sub-tree mutation pairing: BUPA dataset. All entries
are averages over 10 runs.
Training Test Population
Nmut Error Size Error Size Time (S) Size
[image:15.595.73.296.240.327.2]2 0.2384 22.2 0.2674 16.2 16.6 4.23 3 0.2321 13.8 0.2667 8.0 20.8 4.96 4 0.2254 25.0 0.2607 14.0 39.6 7.09 5 0.2253 31.2 0.2567 20.4 57.1 8.51 6 0.2206 31.2 0.2569 19.0 100.7 9.64 7 0.2157 64.8 0.2585 26.2 171.4 13.97 10 0.2100 43.60 0.2700 19.80 264.9 21.35
Table 5 Results for steady-state/sub-tree crossover/sub-tree mutation pairing: BUPA dataset. All entries are
averages over 10 runs.
Training Test Population
Nmut Error Size Error Size Time (S) Size
2 0.2105 46.4 0.2662 24.2 29.2 15.98 3 0.2116 38.8 0.2679 18.2 29.5 16.92 4 0.2122 37.8 0.2724 14.8 33.0 17.9 5 0.2107 37.0 0.2754 18.8 37.7 18.77 6 0.2088 52.2 0.2631 23.6 54.2 19.25 7 0.2113 39.4 0.2682 18.0 65.8 20.6 10 0.2150 43.8 0.2717 21.2 332.4 23.25
Table 6 Results for steady-state/sub-tree crossover/depth-fair mutation pairing: BUPA dataset. All entries
are averages over 10 runs.
Training Test Population
Nmut Error Size Error Size Time (S) Size
2 0.2398 17.8 0.2855 11.6 11.0 6.02 3 0.2346 14.8 0.2661 14.8 18.4 10.13 4 0.2304 24.6 0.2644 16.4 24.2 13.16 5 0.2298 26.0 0.2673 17.4 36.7 14.04 6 0.2248 34.0 0.2666 17.0 66.6 14.26 7 0.2297 25.2 0.2682 15.6 112.1 15.51 10 0.2294 45.6 0.2720 17.6 896.3 16.42
Table 7 Results for generational/depth-fair crossover/depth-fair mutation pairing: BUPA dataset. All entries
are averages over 10 runs.
Training Test Population
Nmut Error Size Error Size Time (S) Size
[image:15.595.78.288.365.450.2] [image:15.595.74.289.488.575.2]Table 8 Results for generational/depth-fair crossover/sub-tree mutation pairing: BUPA dataset. All entries
are averages over 10 runs.
Training Test Population
Nmut Error Size Error Size Time (S) Size
[image:16.595.77.293.244.329.2]2 0.2436 17.4 0.2693 16.0 17.9 4.44 3 0.2290 24.2 0.2659 11.2 34.2 9.39 4 0.2155 52.0 0.2529 34.4 57.3 18.74 5 0.2238 38.8 0.2575 23.0 91.9 24.63 6 0.2152 57.8 0.2563 52.8 113.5 41.86 7 0.2193 73.6 0.2462 59.0 192.7 70.52 10 0.2135 56.2 0.2486 28.2 284.8 122.81
Table 9 Results for generational/sub-tree crossover/sub-tree mutation pairing: BUPA dataset. All entries are
averages over 10 runs.
Training Test Population
Nmut Error Size Error Size Time (S) Size
[image:16.595.76.293.369.456.2]2 0.2140 40.2 0.2452 24.4 32.2 16.71 3 0.2182 34.8 0.2462 21.2 35.2 19.15 4 0.2142 35.4 0.2478 27.0 38.5 22.97 5 0.2145 38.6 0.2510 28.6 41.9 25.54 6 0.2122 61.2 0.2493 34.2 57.9 31.6 7 0.2189 47.2 0.2474 32 71.7 36.76 10 0.2156 44.4 0.2513 21.4 264.8 128.92
Table 10 Results for generational/sub-tree crossover/depth-fair mutation pairing: BUPA dataset. All entries
are averages over 10 runs.
Training Test Population
Nmut Error Size Error Size Time (S) Size
2 0.2468 18.8 0.2669 16.8 11.9 5.58 3 0.2375 23.6 0.2545 18.4 15.4 9.81 4 0.2293 19.2 0.2562 17 22.7 13.54 5 0.2280 25.2 0.2591 19.6 45.4 21.52 6 0.2295 24.4 0.2573 13.4 66.8 33.76 7 0.2350 31 0.2524 25.4 148.5 60.98 10 0.2311 97.6 0.2555 16 862.2 425.79
larger mean population sizes and larger best-performing individuals. Both mutation mech-anisms replace a selected sub-tree with a new sub-tree of fixed depth Nmut but whereas
depth-fair mutation tends to select nodes for replacement which are near the top of a tree, sub-tree mutation selects all nodes with equal probability, regardless of their depth. Since there is a greater density of nodes at the bottom of a tree than the top, sub-tree mutation will tend to replace sub-trees towards the bottom a tree and will therefore tend to produce a greater increase in tree depth, and therefore node count.
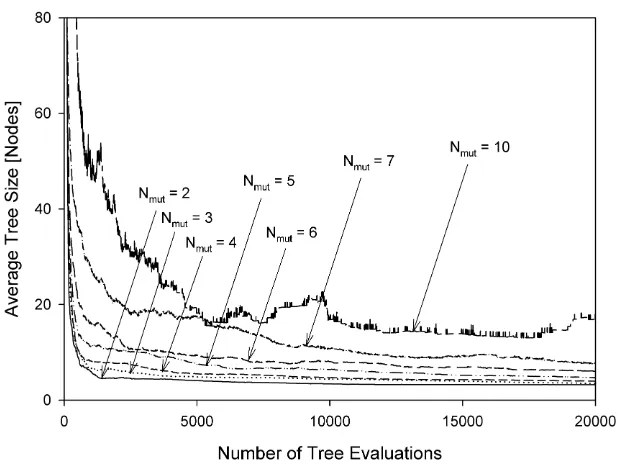
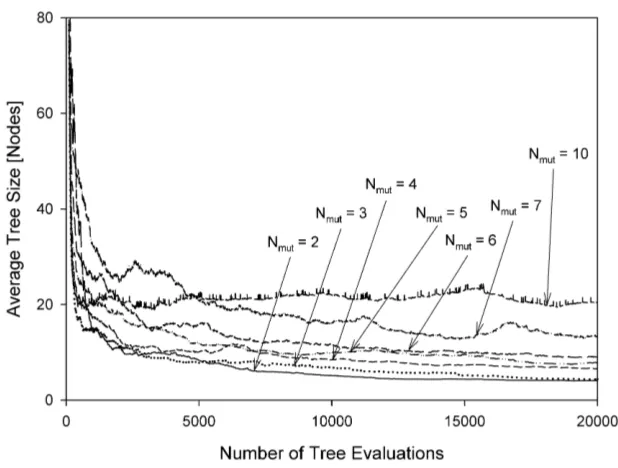
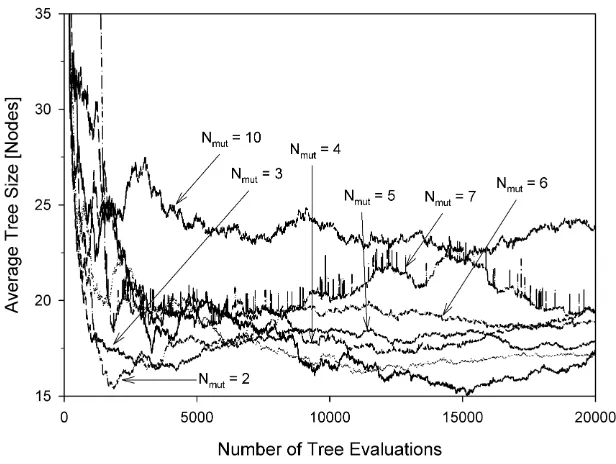
The mean population sizes as a function of the number of tree evaluations are shown in Figures 5 to 12 for various experimental configurations from which there is no evidence of uncontrolled code growth.
After a transient period, the plots in Figures 5 and 8 (steady-state algorithm) all set-tle to values of mean population size which are not greatly influenced by Nmut. The mean
population sizes for the generational algorithm, on the other hand, (Figures 9 to 12) are significantly affected by Nmut; this is a consequence of the fact that the generational
Fig. 5 Average population size versus the number of tree evaluations. Steady-state algorithm depth-fair
crossover / depth-fair mutation.
algorithm only admits into the new population individuals of sufficiently high performance. Regardless of the mean population size, the mutation mechanism and the evolutionary ap-proach employed, the selective pressure imposed by the MO parsimony objective appears able to equilibrate with whatever rate of tree growth is imposed by the mutation mechanism. Consequently we see neither bloat nor collapse, rather the establishment of an equilibrium. We suggest this is a property of the ranking nature of Pareto comparison. Rather than pre-ferring an individual on the basis of its absolute node count, the ranking procedure makes
relative judgments over the instantaneous population. Whatever the mean node count in the
population, the Pareto-based selection process tends to select the smaller individuals in the population. In a population of larger individuals, these selected individuals will also tend to be large in absolute terms but smaller relative to the population from which they are drawn. The net effect appears to be the maintenance of an equilibrium.
The third factor which emerges from Tables 3 to 10 concerns the run-times. There is a general and very clear trend that increasing Nmutincreases the run-time. This is not
surpris-ing since fitness evaluation is usually the dominant factor in the run-time of all evolutionary algorithms, not just GP. Larger values of Nmuttend to generate larger trees which take longer
to evaluate. Also, for a given mutation mechanism and value of Nmut, there is a not a great
Fig. 6 Average population size versus the number of tree evaluations. Steady-state algorithm / depth-fair
crossover / sub-tree mutation.
current population are admitted into the updated population. In our experiments, the steady-state algorithms discard up to 85% of generated trees. As a result there is no great difference in run-times between the two evolutionary approaches; the only benefit of the steady-state algorithm is its reduced memory requirements which with modern general-purpose comput-ers would seem a fairly modest advantage.
Where there is a systematic and noticeable difference in run-times is between depth-fair and sub-tree mutation. Again, this is understandable since sub-tree mutation will tend to generate trees with larger node counts for the reasons discussed above. For a given value of
Nmut, sub-tree mutation will lead to longer run-times than depth-fair mutation.
Fig. 7 Average population size versus the number of tree evaluations. Steady-state algorithm / sub-tree
crossover / sub-tree mutation. Note the suppressed ordinate origin.
5 Additional Experiments
To further confirm our conclusions we performed additional experiments to investigate which part of the mutation process is responsible for moderating the numbers of single-node trees and preventing population collapse. In this series of experimentscrossover was carried-out normally but we varied the scope of the mutation operator. First, we only al-lowed the mutation operation if the root node was selected; if other nodes were selected, the mutation operation was skipped. In the second of these experiments, mutation of the root node was skipped but mutation of any other tree node was allowed. Typical results are shown in Figure 13. It can be seen from the upper curve that without root node mutation, collapse rapidly ensues. Allowing mutation at the root node alone, however, is sufficient to prevent collapse, as shown by the lower curve. It is clear that root node mutation is the principal factor responsible for preventing collapse. Any 1-node trees which are produced by crossover will always be replaced during mutation by something larger; consequently, 1-node trees will not be allowed to build-up in the population.
Fig. 8 Average population size versus the number of tree evaluations. Steady-state algorithm / sub-tree
crossover / depth-fair mutation.
zero (i.e. no mutation) obviously leads to total collapse of the population to single-node trees. Increasing the probability of mutation decreases the percentage of collapse although there is still a partial collapse of the population until we reach a mutation probability of 1. At this level of mutation, there is a very low percentage of collapse to single-node trees (not more than 10% of the population and due to the 1-node trees in the initial population). Thus by varying the mutation probability, the fraction of 1-node trees can be managed but not completely eliminated.
From the foregoing, the mechanism by which mutation prevents population collapse appears clear: Mutation suppresses the accumulation of 1-node trees. It is interesting to con-sider whether simple culling (or censoring) of the population could achieve the same end without the need for mutation. Namely, if the outcome of a crossover operation is a single-node tree, reject it and repeat the crossover operation until an offspring of suitable size is generated. Figures 15 and 16 show the mean population sizes for a series of experiments (omitting mutation) in which the minimum tree depth has been limited to some value, Cmin.
Here we treat tree depth as the maximum depth of a tree, that is, the largest number of levels from the root to the deepest possible leaf node, regardless of tree asymmetry. Although the results from both crossover methods display some complex initial transient behavior, even-tually the average population size falls to exactly Cminin every case. So for a depth limit
of Cmin=5, for example, the final population contains nothing but individuals of depth 5;
this picture is identical across all the values of Cmininvestigated. Thus imposing a simple
minimum depth on the population results – in the absence of mutation – in population col-lapse to exactly that minimum depth and severe loss of diversity. For larger values of Cmin
Fig. 9 Average population size versus the number of tree evaluations. Generational algorithm / depth-fair
crossover / depth-fair mutation.
an outcome runs completely counter to the spirit of MO methods in which the aim is to find the range of solutions which trade-off complexity and error. We have not addressed the issue here but there must also be a question mark over the efficacy of the search in this situation. With such rapidly reducing population diversity and a final outcome largely pre-determined by the choice of Cmin, it is improbable that the search is being conducted in the best way
pos-sible. We conclude that simple culling of small solutions does not prevent collapse: mutation is essential to prevent collapse.
Although diversity preservation methods are not the principal concern of this paper, it is instructive to consider the role of mutation within a diversity-preserving scheme; we have considered the well-known SPEA2 algorithm1 of Zitzler et al. [30]. SPEA2 operates by maintaining a separate, external archive of non-dominated individuals from which parents are selected. When the archive is full, SPEA2 uses a proxy density measure, implemented using Euclidean nearest-neighbor distances in phenotype space, to decide which individuals to remove from the archive. It attempts to maintain diversity in the filled archive by remov-ing individuals which are ‘close’ to each other. Since our two objectives of trainremov-ing error and numbers of tree nodes present on very different scales, we have normalized the node count to the range zero to one at every generation so that the distance measures are not dominated by the node count objective. (The training error naturally presents on the scale of 0 to 1.) We have used both archive and population sizes of 100. The percentages of 1-node trees in the archive for typical runs for various permutations and combinations of crossover and mu-tation operators are shown in Figure 17. The outcome is consistent with the previous results
Fig. 10 Average population size versus the number of tree evaluations. Generational algorithm / depth-fair
crossover / sub-tree mutation.
Fig. 11 Average population size versus the number of tree evaluations. Generational algorithm / sub-tree
[image:22.595.89.390.399.626.2]Fig. 12 Average population size versus the number of tree evaluations. Generational algorithm / sub-tree
crossover / depth-fair mutation.
in that adding mutation keeps the percentage of 1-node trees at low levels. Omitting muta-tion, on the other hand, initially results in a rapid increase (within∼10 generations) in the numbers of 1-node trees in the archive similar to that seen earlier. When the archive is full the SPEA2 algorithm begins removing trees from the archive on the basis of their mutual proximity. Sub-tree crossover settles quickly to around 55% single-node trees; depth-fair crossover initially performs much worse but finally stabilizes at around 48% single-node trees. Thus collapse within SPEA2 is only partial although the results for 1-node trees mask a deeper problem: Without mutation the final archive typically contains only around five unique but small and frequently duplicated trees out of an archive of 100. Archives obtained
with mutation do not exhibit this extreme loss of variation. It thus appears that even in the
Fig. 13 Percentage of single-node trees in the population as a function of the number of tree evaluations
for allowing/disallowing root node mutation. BUPA Liver Disorders problem. (Generational algorithm and depth-fair mutation; Nmut=3.)
6 Discussion and Conclusions
It would appear that mutation is a type of diversity operator which creates individuals with new genetic material – this appears to have the invaluable effect of advancing the evolution-ary search. Mutation seems a preferable method for maintaining diversity in the population compared to explicit diversity operations.
In particular, ensuring phenotype diversity in real-valued domains has the disadvantage of requiring a ‘scale’ for the phenotype space – if two individuals decode to phenotype val-ues closer than the characteristic scale then they can be considered identical. This is illus-trated in Figure 18: Should points A and B be grouped together and regarded as ‘identical’ or does this metric space contain three distinct points, A, B and C? In other words, is the characteristic scale of this space comparable to distance between A/B and C, or less than the distance between A and B? (A trivial but very practical example is a change of mea-surement units of one of the objectives which changes the ‘distance’ between the points – logically this cannot be allowed to influence the grouping decision.) More generally, setting a suitable scale is a difficult problem which occurs in a number of diverse areas, for exam-ple, data clustering [12], and is usually intractable without prior knowledge. In addition, the mapping from genotype-to-phenotype is a many-to-one mapping and so individuals with widely varying genetic material may be suppressed because they map to similar points in phenotype space. Explicit phenotype diversity preservation may well inhibit search.
Fig. 14 Percentage of single-node trees in the population as a function of the number of tree evaluations for
varying probability of a mutation event. BUPA Liver Disorders problem. (Generational algorithm and depth -fair mutation; Nmut=3.)
to compute. Due to these practical problems, we suggest explicit diversity approaches are a method of last resort rather than a primary method.
We have shown in this paper that the selection of a root node and a leaf node for crossover can create single-node trees which in turn can create other duplicate single-node trees. This introduction into the population of single-node trees can, in combination with a tree complexity objective to control bloat, lead to population collapse and a consequent near-complete loss of population diversity. We have demonstrated that following crossover with mutation plays an important role in suppressing single-node trees and providing a counter-balance to the parsimony pressure imposed by the tree complexity objective without leading to tree bloat. Mutation alone is therefore able to maintain population diversity by introducing new genetic material without the need for phenotype/genotype diversity preservation tech-niques. (Whether mutation in tandem with an explicit diversity-preserving mechanism offers the advantage of maintaining better population diversity and therefore improved search is outside the scope of this paper; this is an area for future research.)
Fig. 15 Average population size versus number of tree evaluations for a range of minimum tree depths, Cmin.
BUPA dataset; Sub-tree crossover; no mutation; Nmut=3.
In [4] we offered an analysis of the collapse mechanism in terms of the establishment of an equilibrium between the tendency of mutation to bloat the population and the tendency of the parsimony objective to collapse it. The entirely complementary analysis presented here is of mutation as a diversity-generating mechanism. We suggest it may be more helpful to effective search to have a proactive mechanism which generates diversity than a
reac-tive diversity-preserving mechanism which seeks only to maintain such diversity as already
exists within the population; a more detailed comparison of mutation and explicit diversity preservation is clearly an area for future work. Nonetheless, we believe this work clarifies the principal effect of mutation on the dynamics of population evolution in MOGP and also un-derscores the fundamental role of mutation in (MO)GP as more than the minor, fine-tuning mechanism which it is commonly perceived to be in GAs.
Also, and predictably, it is clear from our experiments that fitness evaluation of newly generated individuals is the most time-consuming part of the whole evolutionary process. We have therefore explored the effect of mutation parameters with both depth-fair and sub-tree mutation, on the size of population individuals in both steady-state and generational evolutionary approaches. We have shown that, since they determine the size of offspring, mutation parameters play a major role in deciding the time complexity of a GP algorithm.
Fig. 16 Average population size versus number of tree evaluations for a range of minimum tree depths, Cmin.
BUPA dataset; Depth-fair crossover; no mutation; Nmut=3.
depth of the new tree inserted during mutation. In the generational paradigm,on the other hand, large offspring are unconditionally accepted into the next generation and hence mu-tating by inserting deeper sub-trees leads to an increase in the average size of individuals in the population.
Finally, we return to the original question posed in the introduction to this paper “what are we (and other adherents of the MO approach) doing that prevents population collapse and that de Jong and Pollack are not (or vice versa)?” The concise answer is that we are using the conventional mutation operator. Whether explicit diversity preservation is a help, hinders or has no effect on population diversity, and by implication, search, remains to be established in future work. What we can state is that explicit diversity preservation mechanisms are not essential to prevent population collapse in multiobjective genetic programming.
Acknowledgements
We are grateful to Dr Yang Zhang for providing the genetic programming code on which this work was based. We are also grateful to the anonymous reviewers for both suggesting and inspiring some additional experiments which have strengthened this paper.
References
Fig. 17 Typical percentages of 1-node trees in the external archive of the SPEA2 algorithm. BUPA dataset.
The four plots at the bottom of the figure which all include mutation are coincident at this scale. Nmut=3.
Fig. 18 Illustration of the difficulties of setting a suitable scale for comparing real-valued responses. See text
for discussion.
2. Luke, S., Panait, L.: A comparison of bloat control methods for genetic programming. Evol. Comput.
14(3), 309–344 (2006)
3. Alpaydin, E.: Combined 5×2 cv f test for comparing supervised classification learning algorithms. Neural Comp. 11(8), 1885–1892 (1999)
4. Badran, K.M.S., Rockett, P.I.: The roles of diversity preservation and mutation in preventing popula-tion collapse in multiobjective genetic programming. In: D. Theirens (ed.) Genetic and Evolupopula-tionary Computation Conference (GECCO2007), pp. 1551–1557. ACM Press, London, UK (2007)
5. Blake, C.L., Merz, C.J.: UCI Repository of Machine Learning Databases.http://www.ics.uci.edu/
∼mlearn/MLRepository.html(1998)
6. Burke, E. K., Gustafson, S., Kendall, G.: Diversity in genetic programming: An analysis of measures and correlation with fitness. IEEE Transactions on Evolutionary Computation 8(1), 47–62 (2004)
7. Chellapilla, K.: Evolving computer programs without subtree crossover. IEEE Trans. on Evol. Comp.
[image:28.595.143.353.378.485.2]8. Coello, C.A.C.: An updated survey of GA-based multiobjective optimization techniques. ACM Comput. Surv. 32(2), 109 – 143 (2000)
9. Deb K., Pratap A., Agarawal, S., Meyarivan, T: A fast and elitist multiobjective genetic algorithm: NSGA-II. IEEE Transactions on Evolutionary Computing 6(2), 182–197 (2002)
10. Dietterich, T.: Approximate statistical tests for comparing supervised classification learning algorithms. Neural Comput. 10(7), 1895–1923 (1998)
11. Dignum, S., Poli, R.: Generalisation of the limiting distribution of program sizes in tree-based genetic programming and analysis of its effects on bloat. In: Thierens, D., et al. (ed.) Genetic and Evolutionary ComputationConference (GECCO2007), pp. 1588–1595. ACM Press, London (2007)
12. Duda, R.O., Hart, P.E., Stork, D.G.: Pattern Classification, 2ndedn. John Wiley (2001)
13. Fonseca, C.M., Fleming, P.J.: Genetic algorithms for multiobjective optimization: Formulation, discus-sion and generalization. In: S. Forrest (ed.) 5thInternational Conference of Genetic Algorithms, pp.
416–423. Morgan Kaufmann, San Mateo, CA (1993)
14. Ito, T., Iba, H., Sato, S.: Depth-dependent crossover for genetic programming. In: IEEE World Congress on Computational Intelligence, pp. 775–780. IEEE Press, Anchorage, Alaska (1998)
15. de Jong, E.D., Pollack, J.B.: Multi-objective methods for tree size control. Genet. Program. and Evol. Mach. 4(3), 211–233 (2003)
16. Kumar, R., Rockett, P.I.: Improved sampling of the Pareto-front in multiobjective genetic optimizations by steady-state evolution: A Pareto converging genetic algorithm. Evol. Comput. 10(3), 283–314 (2002) 17. Langdon, W.B., Poli, R.: Fitness causes bloat: Mutation. In: W. Banzhaf, R. Poli, M. Schoenauer, T.C. Fogarty (eds.) 1stEuropean Workshop on Genetic Programming, pp. 37–48. Springer-Verlag, Paris
(1998)
18. Langdon, W. B.: The evolution of size in variable length representations. In: Simpson, P. K. (ed.) IEEE In-ternational Conference on Evolutionary Computation, pp. 633–638. IEEE Press, Anchorage, AK (1998) 19. Luke, S., Panait, L.: Lexicographic parsimony pressure. In: Genetic and Evolutionary Computational
Conference (GECCO 2006). New York City, USA (2002)
20. Poli, R., Langdon, W.B., McPhee, N.F.: A Field Guide to Genetic Programming. Lulu.com (2008) 21. Rodr´ıguez-V´azquez, K., Fonseca, C.M., Fleming, P.J.: Identifying the structure of non-linear dynamic
systems using multiobjective genetic programming. IEEE Trans. Syst. Man Cybern. - Part A: Syst. Hum. 34(4), 531–547 (2004)
22. Silva, S., Alemida, J.: Dynamic maximum tree depth - A simple technique for avoiding bloat in tree-based GP. In: Genetic and Evolutionary Computational Conference (GECCO 2003), pp. 1776–1787. Chicago, IL (2003)
23. Soule, T., Foster, J. A., Dickinson, J.: Code growth in genetic programming. In: Koza, J. R., Goldberg, D. E., Fogel, D. B., Riolo, R. L. (ed.) 1stAnnual Conference on Genetic Programming, pp. 215–223.
MIT Press, Stanford University, CA (1996)
24. Stevens, J., Heckendorn, R. B., Soule, T.: Exploiting disruption aversion to control code growth. In: Beyer, H-G., et al. (ed.) Genetic And Evolutionary Computation Conference (GECCO 2005), pp. 1605 – 1612. ACM Press, Washington DC (2005)
25. Zhang, Y.: Multiobjective genetic programming optimal search for feature extraction. Ph.D. thesis, Uni-versity of Sheffield (2006)
26. Zhang, Y., Rockett, P.I.: Comparison of evolutionary strategies for multi-objective genetic programming. In: B.P. Amavasai, N.H. Siddique, X. Cheng (eds.) IEEE Systems, Man Cybernetics Society Conference on Advances in Cybernetic Systems (AICS2006). Sheffield, UK (2006)
27. Zhang, Y., Rockett, P.I.: Feature extraction using multi-objective genetic programming. Multi-Objective Machine Learning. Springer, Heidelberg (2006)
28. Zhang, Y., Rockett, P.I.: A generic multi-dimensional feature extraction method using multiobjective genetic programming. Tech. Rep. VIE 2006/002, Department of Electronic and Electrical Engineering, University of Sheffield, Sheffield, UK (2006)
29. Zhang, Y., Rockett, P.I.: A generic optimal feature extraction method using multiobjective genetic pro-gramming. Tech. Rep. VIE 2006/001, Department of Electronic and Electrical Engineering, University of Sheffield, Sheffield, UK (2006)