Research Article
The Visualization of Biofilms in Chronic Diabetic Foot Wounds
Using Routine Diagnostic Microscopy Methods
Angela Oates,
1Frank L. Bowling,
2Andrew J. M. Boulton,
2Philip G. Bowler,
3Daniel G. Metcalf,
3and Andrew J. McBain
11Manchester Pharmacy School, The University of Manchester, Oxford Road, Manchester M13 9PT, UK
2Department of Medicine Manchester Royal Infirmary, The University of Manchester, Oxford Road, Manchester M13 9PT, UK
3ConvaTec Ltd., Deeside CH5 2NU, UK
Correspondence should be addressed to Andrew J. McBain; andrew.mcbain@manchester.ac.uk
Received 11 January 2014; Accepted 14 February 2014; Published 15 April 2014
Academic Editor: Bijan Najafi
Copyright © 2014 Angela Oates et al. This is an open access article distributed under the Creative Commons Attribution License, which permits unrestricted use, distribution, and reproduction in any medium, provided the original work is properly cited.
Diabetic foot wounds are commonly colonised by taxonomically diverse microbial communities and may additionally be infected with specific pathogens. Since biofilms are demonstrably less susceptible to antimicrobial agents than are planktonic bacteria, and may be present in chronic wounds, there is increasing interest in their aetiological role. In the current investigation, the presence of structured microbial assemblages in chronic diabetic foot wounds is demonstrated using several visualization methods. Debridement samples, collected from the foot wounds of diabetic patients, were histologically sectioned and examined using bright-field, fluorescence, and environmental scanning electron microscopy and assessed by quantitative differential viable counting. All
samples (n= 26) harboured bioburdens in excess of 5 log10CFU/g. Microcolonies were identified in 4/4 samples by all three
microscopy methods, although bright-field and fluorescence microscopy were more effective at highlighting putative biofilm morphology than ESEM. Results in this pilot study indicate that bacterial microcolonies and putative biofilm matrix can be visualized in chronic wounds using florescence microscopy and ESEM, but also using the simple Gram stain.
1. Introduction
The aetiological role of biofilms in diabetic wounds remains poorly understood but their formation is increasingly recog-nised as a potential barrier to healing [1,2]. A limited num-ber of studies have provided evidence for the involvement of biofilms in chronic wounds using several visualization techniques including scanning electron microscopy, epiflu-orescence microscopy [3–5], and confocal laser scanning microscopy (CLSM) [6–9]. No method for the identification of wound-associated biofilms has been universally recog-nized, partly due to the lack of unifying criteria for their identification that are applicable to a range of visualization methods.
Whilst various definitions for biofilms have been adopted, it is generally accepted that they are structured bacterial
communities that are often but not always attached to sur-faces and which are encased in a self-produced exopolymer matrix [10–12]. Generally, the identification of biofilms has relied on the visualization of at least two of the following three criteria: (i) microbial surface attachment [13–16], (ii) structured assemblages of microbial cells [15–17], and (iii) the presence of exopolymer matrix [14, 16]. Scanning electron microscopy and CLSM, commonly used techniques to visu-alize biofilms, require specialised apparatus and training and are typically found in research facilities, whereas bright-field and epifluorescence microscopy are more widely available in clinical laboratories.
The current pilot study was conducted as part of a larger study into the presence of unculturable bacteria in diabetic foot wounds [18] with the intention of addressing the commonly stated clinical requirement for a simple means of
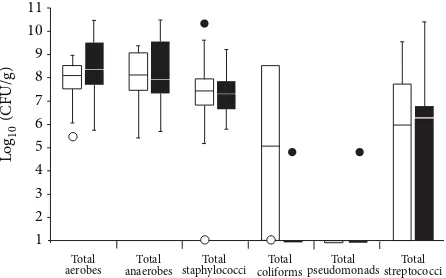
Figure 1: Differential viable counts of selected bacterial groups from 26 chronic wound samples. The lower and upper boundaries of the boxes represent quartiles 1 and 3, respectively, and horizontal bars
within the boxes represent median values.Irepresents minimum
outliers andethe maximum outliers. White bars represent samples
from which pathogens [18] were not isolated and black bars samples from which pathogens were isolated.
identifying biofilms in wound samples. Debridement samples
(𝑛 = 26)were bacteriologically characterised by differential
viable counting and, where sufficient sample material was available, were subjected to biofilm visualisation techniques.
2. Methods
2.1. Chemicals and Growth Media. Unless otherwise stated
chemicals used were supplied by Sigma (Poole, Dorset, UK). Dehydrated bacteriological media were obtained from Oxoid (Basingstoke, Hampshire, UK) and prepared according to instructions supplied by the manufacturer.
2.2. Collection of Chronic Wound Tissue. This study was
reviewed by the North Manchester Research Ethics Com-mittee and the Central Manchester University Hospital Research and Development Department. Reference number: 09/H1006/41, protocol number 1.0. Twenty-six wound tissue debridement samples were collected from patients with chronic diabetic foot wounds (defined as being distal to the medial and lateral malleoli, with a known duration greater than four weeks), attending a specialist foot clinic. Wound tissue samples were taken from the wound bed and surround-ing tissue ussurround-ing a sterile scalpel by the attendsurround-ing clinician and placed sterile 0.85% (w/v) saline for transportation. All samples were transported to the laboratory at 2∘C and processed within 3 h of collection.
2.3. Differential Bacteriological Enumeration and
Identifica-tion. Twenty-six tissue samples were processed as previously
described [18]. Bacterial identification was based upon colony morphology, Gram staining, catalase reaction, latex coagu-lase reaction tests, and Lancefield group reaction to identify beta-haemolytic streptococci (Prolex Streptococcal grouping latex kits, Pro-Lab Diagnostic, Cheshire, UK) and growth on Brilliant UTI media.
staining and fluorescencein situhybridisation (FISH).
2.5. Fluorescence In Situ Hybridisation, Fluorescent Probes, and Staining to Differentiate Bacteria, Biofilms, and
Tissue. Slide-mounted tissue sections were fixed in
4% paraformaldehyde for 3 h and then subjected to a prepermeabilization step, consisting of lysozyme enzymatic buffer (100 mM Tris HCl [pH8], 50 mM EDTA, and lysozyme [5 mg/mL]), for 4 h at 45∘C. Slides were then washed in wash buffer consisting of 0.9 M NaCl and 20 mM Tris and air-dried. Slides were then incubated in FISH buffer containing 50% formamide, 0.9 M NaCl, 20 mM Tris, 0.01% SDS (w/v), and 50 ng of the general eubacterial probe (EUB 338)-cy3 probe-GCT GCC TCC CGT AGG AGT [19] (Ex. 550 nm, Em. 570 nm), incubated in a humidity chamber at 55∘C for 4 h and then washed with wash buffer. Once dried, slides were exposed to 10𝜇L/mL working concentration of the carbohydrate-binding lectin, Concanavalin A conjugated Alexa Fluor 488 (Invitrogen, Paisley, UK) (Ex. 495 nm, Em. 643 nm) for 1 h at room temperature to aid in the visualization of putative biofilms. Concanavalin A binds to internal and nonreducing terminal alpha mannosyl groups, a common component of oligosaccharide of glycoproteins found in biofilms [20,21]. Finally, to differentiate mammalian cells, the nucleic acid stain Hoechst 33252 (2𝜇g/mL) (Ex. 350 nm, Em. 460 nm) (Sigma, Poole, Dorset, UK) was added for 1 h at room temperature [7]. All staining procedures were completed in the dark. Tissue sections were also Gram-stained as per standard protocols.
FISH images were captured using an Olympus BX51 upright microscope using a 60x and 100x objective and cap-tured using a Coolsnap ES camera (Photometrics, AZ, USA) through MetaVue Software (Molecular Devices, CA, USA). Specific band pass filter sets for DAPI (Ex. BP365/12 nm, Em. LP397 nm), FITC (Ex. BP450–490 nm, Em. BP515– 565), and Texas red (Ex. BP546/12 nm Em. LP615 nm) were used. Gram-stained images were visualized using a Zeiss Axioscop 2 microscope, Axiocam, and Axiovision Version 4.8 (Carl Zeiss Ltd., Herefordshire, UK). All images were then processed using ImageJ (http://rsb.info.nih.gov/ij).
2.6. ESEM of Chronic Wound Tissue. Chronic wound tissue
(a) (b)
(c) (d)
[image:3.600.123.482.71.572.2](e) (f)
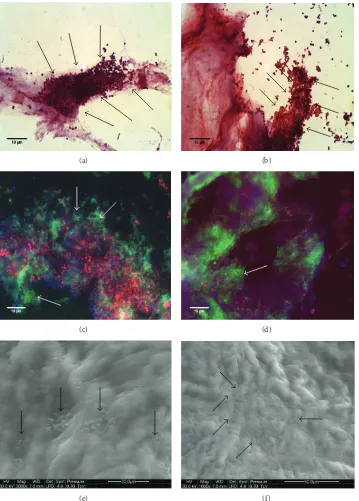
Figure 2: Images acquired from Sample 1. (a) and (b) are replicate images from Gram-stained sections; (c) and (d) (replicates) have been visualized using a combination of FISH (red), to indicate eubacteria, ConA (green) to indicate biofilm matrix, and other ConA-reactive material, and with Hoechst 33252 (blue) for the detection of nucleic acids. (e) and (f) show replicate ESEM images. Presumptive bacterial microcolonies and biofilm matrix have been indicated by arrows.
was performed using a FEI Quanta 200 environmental scan-ning electron microscope under a low vacuum (<0.75 Torr) permitting inspection of putative biofilm structures and microcolonies whilst conserving the hydrated state of the sample.
3. Results
3.1. Viable Bacterial Counts from Wound Samples. All 26
(a) (b)
(c) (d)
[image:4.600.120.481.68.571.2](e) (f)
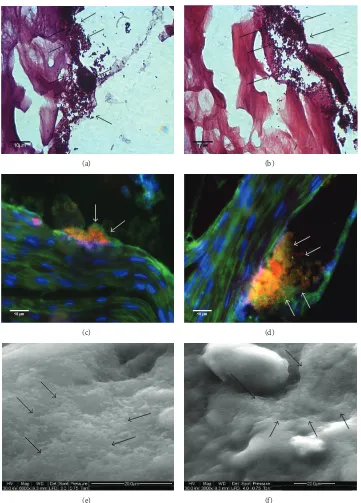
Figure 3: Images acquired from Sample 2. See legend toFigure 1.
of tissue, as shown inFigure 1andTable 1. Of the four samples which were subjected to visualisation techniques, the total anaerobic, aerobic and viable counts of staphylococci were within two standard deviations of the mean of the total popu-lations sampled. Samples 1 and 2 harboured streptococci and Sample 4 was the only tissue sample from which coliforms were isolated, (Table 1).
3.2. Biofilm Visualization. Figure 2 shows the stained and imaged chronic wound sections from Sample 1. Gram
staining, the use of a eubacterium specific FISH probe Figures
2(c)-2(d), and ESEM Figures2(e)-2(f)analysis indicate the presence of bacterial microcolonies embedded within and/or upon surfaces of wound tissue. Figure 3 similarly shows imaged chronic wound sections from Sample 2, as does
Figure 4 for Sample 3. Bacterial infiltration into internal portions of the tissues tissue sections is not apparent Figures
4(c)-4(d). Images derived from Sample 4 are shown in
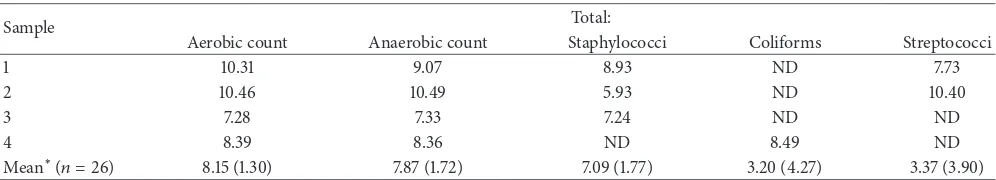
Table 1: Differential viable counts of selected bacterial groups from the four imaged samples.
Sample Total:
Aerobic count Anaerobic count Staphylococci Coliforms Streptococci
1 10.31 9.07 8.93 ND 7.73
2 10.46 10.49 5.93 ND 10.40
3 7.28 7.33 7.24 ND ND
4 8.39 8.36 ND 8.49 ND
Mean∗(𝑛 = 26) 8.15 (1.30) 7.87 (1.72) 7.09 (1.77) 3.20 (4.27) 3.37 (3.90)
Values arelog10CFU/g. Samples 1–4 correspond to the numbered imaged samples in Figures2–5.∗refers to mean values from the 26 samples for which full
data is presented inFigure 1(standard deviations are given in parentheses).Pseudomonaswas not detected in samples 1–4 and was only detected in one of the
26 samples (at 4.7log10,CFU/g).
in ESEM. It is possible, however, that, in the latter case, cells may have been obscured by biofilm matrix material.
Based on localization of reactive material, the utility of ConA and Hoechst 33252 as specific biofilm indicators is limited by the reactivity of structures associated with host cells. However, it is likely that Con-A-reactive material adjacent to bacterial microcolonies (as indicted by the FISH probe) is biofilm matrix. This is particularly evident in Figures2and3.
4. Discussion
The taxonomically diverse microbial communities which occur in diabetic foot wounds may include both aerobic and anaerobic organisms many of which are potentially pathogenic [22, 23]. The role that such organisms play in impeding healing has been previously documented [22–26]. However, the aetiological role of bacterial biofilms in diabetic foot wounds remains poorly understood, although they are becoming recognised as a potential impediment to healing [1,2]. As such, there is an increasing clinical need to identify biofilms in these wounds. In the current study, quantitative and diagnostic culture techniques were used to measure wound bioburdens, whilst tissue samples were also subjected to bright-field, epifluorescence, and ESEM to identify struc-tures associated with the biofilm phenotype. Each method was selected to represent biofilm visualization methods com-monly reported in the literature and their presumed ability to identify at least two of the following three criteria: (i) microbial surface attachment, (ii) structured assemblages of microbial cells, and (iii) the presence of exopolymer matrix. According to previous reports, images of sections stained using hematoxylin and eosin, and Gram-stained biofilms, for example, readily may reveal microcolonies attached to tissues but reportedly fail to recognize the exopolymer matrix [5, 27]. The application of epifluorescence microscopy and CLSM however allows for the specific staining of the exopoly-mer matrix [21, 28], but not all studies using fluorescence microscopy have adopted this approach [7,25].
A limitation of biofilm matrix staining using a carbohydrate marker such as the (fluorescently labeled) carbohydrate-binding lectin, Concanavalin-A, is the fact that reactive materials are also commonly associated with mammalian cells. It is, therefore, important to consider the location of reactive material. The feasibility of this approach
may be enhanced by using FISH-probes for bacteria and a nucleic acid stain such as Hoechst 33252.
When exploring biofilms using scanning electron microscopy, a high level of resolution and detail can be obtained, potentially revealing biofilm-specific morphology, but also individual cells and their spatial location. Exopolymer matrix is amorphous material which may appear as a layer covering the biofilm, or as a fibrous material. Preparation of the sample for SEM involves dehydrating the sample which can affect the overall morphology of the biofilms and the appearance of the biofilm matrix. These considerations can partially be overcome with the application of ESEM or cryo-SEM which preserve the hydrated state of the biofilm.
In the present study, examination of slide-mounted, Gram-stained tissue sections revealed microcolonies attached to tissues which are indicative of the biofilm phenotype. These microcolonies comprised Gram-positive cocci (Samples 1–3), which corresponds to the organisms isolated by culture, coagulase negative staphylococci (Sample 1), and Staphylococcus aureus from Samples 2 and 3. Fluorescence microscopy of slide mounted tissue sections using FISH produced images which generally agreed with those obtained using Gram staining, such as microcolonies in Samples 1–3 and the low numbers of bacilli in Sample 4. An additional benefit of fluorescence microscopy is the option to detect biofilm matrix using a fluorescent probe. All four samples showed evidence of exopolymer matrix using the Concanavalin A conjugated Alexa Fluor 488 probe. Biofilm matrix was identified as distinct material encasing stained bacterial cells. Interestingly, combining tissue sectioning and simple staining techniques, microcolonies and bacterial exopolymer could be readily identified, with the extent of bacterial infiltration discernible from the depth of each slide section. Whilst evidence of biofilm involvement could be found in all tissues examined, sectional analysis of tissues suggested that biofilms were limited to surface tissue sections with little or no evidence of bacteria or matrix found at depths greater than 20𝜇m.
(a) (b)
(c) (d)
[image:6.600.122.481.71.573.2](e) (f)
Figure 4: Images acquired from Sample 3. See legend toFigure 1.
generally agreed with those gathered using the less com-plex methods using Gram and fluorescent staining, with microcolonies and/or amorphous substances (indicative of biofilms) identified in all samples.
The three visualisation techniques involved staining, fluorescence, and high-resolution microscopy to identify structures typical of the biofilm phonotype. Whilst the
(a) (b)
(c) (d)
[image:7.600.120.481.72.574.2](e) (f)
Figure 5: Images acquired from Sample 4. Putative biofilm matrix is indicated by arrows. See legend toFigure 1.
as Gram staining and fluorescent microscopy which are comparatively cost effective and simple to conduct, requiring equipment that can be found in many diagnostic laboratories. The growing interest in the role biofilms play in chronicity and impaired healing of diabetic wounds has led to an increased clinical requirement for a simple means of identify-ing biofilms in wound samples. More readily available meth-ods such as Gram staining and bright-field microscopy can efficiently detect microcolonies associated with the biofilm
phenotype and may therefore be of use for the identification of biofilms where expediency and cost-effectiveness are required.
Conflict of Interests
and Regeneration, vol. 16, no. 1, pp. 23–29, 2008.
[4] G. A. James, E. Swogger, R. Wolcott et al., “Biofilms in chronic
wounds,”Wound Repair and Regeneration, vol. 16, no. 1, pp. 37–
44, 2008.
[5] H. Elgharably, E. Mann, H. Awad et al., “First evidence of sternal
wound biofilm following cardiac surgery,”PLoS ONE, vol. 8,
Article ID e70360, 2013.
[6] D. Neut, E. J. A. Tijdens-Creusen, S. K. Bulstra, H. C. van der Mei, and H. J. Busscher, “Biofilms in chronic diabetic foot
ulcers–a study of 2 cases,”Acta orthopaedica, vol. 82, no. 3, pp.
383–385, 2011.
[7] S. Malic, K. E. Hill, A. Hayes, S. L. Percival, D. W. Thomas, and D. W. Williams, “Detection and identification of specific bacteria in wound biofilms using peptide nucleic acid fluorescent in situ
hybridization (PNA FISH),”Microbiology, vol. 155, no. 8, pp.
2603–2611, 2009.
[8] S. Kathju, L. Nistico, L. Hall-Stoodley, J. C. Post, G. D. Ehrlich, and P. Stoodley, “Chronic surgical site infection due to
suture-associated polymicrobial biofilm,”Surgical Infections, vol. 10, no.
5, pp. 457–461, 2009.
[9] T. Høgsberg, T. Bjarnsholt, J. S. Thomsen, and K. Kirketerp-Møller, “Success rate of split-thickness skin grafting of chronic
venous leg ulcers depends on the presence of Pseudomonas
aeruginosa: a retrospective study,” PLoS ONE, vol. 6, no. 5, Article ID e20492, 2011.
[10] J. W. Costerton, P. S. Stewart, and E. P. Greenberg, “Bacterial
biofilms: a common cause of persistent infections,”Science, vol.
284, no. 5418, pp. 1318–1322, 1999.
[11] L. Hall-Stoodley, J. W. Costerton, and P. Stoodley, “Bacterial biofilms: from the natural environment to infectious diseases,”
Nature Reviews Microbiology, vol. 2, no. 2, pp. 95–108, 2004. [12] L. Hall-Stoodley and P. Stoodley, “Evolving concepts in biofilm
infections,”Cellular Microbiology, vol. 11, no. 7, pp. 1034–1043,
2009.
[13] D. O. Serra, M. S. Conover, L. Arnal et al., “FHA-mediated
cell-substrate and cell-cell adhesions are critical forBordetella
pertussisbiofilm formation on abiotic surfaces and in the mouse
nose and the trachea,”PLoS ONE, vol. 6, no. 12, Article ID
e28811, 2011.
[14] L. R. Marks, G. I. Parameswaran, and A. P. Hakansson, “Pneumococcal interactions with epithelial cells are crucial for
optimal biofilm formation and colonizationin vitroandin vivo,”
Infection and Immunity, vol. 80, pp. 2744–2760, 2012.
[15] V. Zijnge, M. B. M. Van Leeuwen, J. E. Degener et al., “Oral
biofilm architecture on natural teeth,”PLoS ONE, vol. 5, no. 2,
Article ID e9321, 2010.
R. Devereux, and D. A. Stahl, “Combination of 16S rRNA-targeted oligonucleotide probes with flow cytometry for
analyz-ing mixed microbial populations,”Applied and Environmental
Microbiology, vol. 56, no. 6, pp. 1919–1925, 1990.
[20] M. M. Baum, A. Kainovi´c, T. O’Keeffe et al., “Characterization of structures in biofilms formed by a Pseudomonas fluorescens
isolated from soil,”BMC Microbiology, vol. 9, article 103, 2009.
[21] E. Kanno, S. Toriyabe, L. Zhang, Y. Imai, and M. Tachi, “Biofilm
formation on rat skin wounds by Pseudomonas aeruginosa
carrying the green fluorescent protein gene,” Experimental
Dermatology, vol. 19, no. 2, pp. 154–156, 2010.
[22] M. C. Robson, “Wound infection: a failure of wound healing
caused by an imbalance of bacteria,”Surgical Clinics of North
America, vol. 77, no. 3, pp. 637–650, 1997.
[23] R. C. Murphy, M. C. Robson, J. P. Heggers, and M. Kadowaki, “The effect of microbial contamination on musculocutaneous
and random flaps,”Journal of Surgical Research, vol. 41, no. 1,
pp. 75–80, 1986.
[24] M. C. Robson, “Infection in the surgical patient: an imbalance
in the normal equilibrium,”Clinics in Plastic Surgery, vol. 6, no.
4, pp. 493–503, 1979.
[25] M. Fazli, T. Bjarnsholt, K. Kirketerp-Møller et al., “Nonrandom
distribution of Pseudomonas aeruginosa and Staphylococcus
aureusin chronic wounds,”Journal of Clinical Microbiology, vol. 47, no. 12, pp. 4084–4089, 2009.
[26] S. G. Jones, R. Edwards, and D. W. Thomas, “Inflammation and wound healing: the role of bacteria in the immuno-regulation
of wound healing,”The International Journal of Lower Extremity
Wounds, vol. 3, no. 4, pp. 201–208, 2004.
[27] T. Dalton, S. E. Dowd, R. D. Wolcott et al., “Anin vivo
polymi-crobial biofilm wound infection model to study interspecies
interactions,”PLoS ONE, vol. 6, no. 11, Article ID e27317, 2011.
[28] S. Aslam and R. O. Darouiche, “Role of antibiofilm-antimicrobial agents in controlling device-related infections,”
Submit your manuscripts at
http://www.hindawi.com
Stem Cells
International
Hindawi Publishing Corporation
http://www.hindawi.com Volume 2014
Hindawi Publishing Corporation
http://www.hindawi.com Volume 2014
INFLAMMATION
Hindawi Publishing Corporation
http://www.hindawi.com Volume 2014
Behavioural
Neurology
Endocrinology
International Journal of Hindawi Publishing Corporationhttp://www.hindawi.com Volume 2014 Hindawi Publishing Corporation
http://www.hindawi.com Volume 2014
Disease Markers
Hindawi Publishing Corporation
http://www.hindawi.com Volume 2014
BioMed
Research International
Oncology
Journal ofHindawi Publishing Corporation
http://www.hindawi.com Volume 2014
Hindawi Publishing Corporation
http://www.hindawi.com Volume 2014
Oxidative Medicine and Cellular Longevity
Hindawi Publishing Corporation
http://www.hindawi.com Volume 2014
PPAR Research
The Scientific
World Journal
Hindawi Publishing Corporation
http://www.hindawi.com Volume 2014
Immunology Research
Hindawi Publishing Corporation
http://www.hindawi.com Volume 2014 Journal of
Obesity
Journal ofHindawi Publishing Corporation
http://www.hindawi.com Volume 2014
Hindawi Publishing Corporation
http://www.hindawi.com Volume 2014
Computational and Mathematical Methods in Medicine
Ophthalmology
Journal ofHindawi Publishing Corporation
http://www.hindawi.com Volume 2014
Diabetes Research
Journal ofHindawi Publishing Corporation
http://www.hindawi.com Volume 2014
Hindawi Publishing Corporation
http://www.hindawi.com Volume 2014
Research and Treatment
AIDS
Hindawi Publishing Corporation
http://www.hindawi.com Volume 2014 Gastroenterology Research and Practice
Hindawi Publishing Corporation
http://www.hindawi.com Volume 2014
Parkinson’s
Disease
Evidence-Based Complementary and Alternative Medicine
Volume 2014