An experimental analysis of assessor specific bias in a programming
assessment in multi-assessor scenarios utilizing an eye tracker
Tanmoy
Debnath
Manoranjan
Paul
Subrata
Chakraborty
Pallab
Kanti
Podder
Raj
Gururajan
Abdul
Hafeez-Baig
Charles
Sturt
University,
Charles
Sturt
University,
University
of Southern
Queensland,
Charles
Sturt
University,
University
of Southern
Queensland,
University
of Southern
Queensland,
Australia
Australia
Australia
Australia
Australia
Australia
Abstract
It has been experienced and reported by academic institutions around the globe that marking of most subject’s assessment scripts vary when different assessors are utilized for a given subject. To understand the difference, we capture and analysis cognitive response of assessors through the visual pattern while they are marking the scripts. For this, a Java programming assessment from a real life university examination is marked by independent assessors. The assessors marked the scanned assessment scripts on a computer screen in front of an Eye tracker machine and their eye gaze data were recorded real time. Data indicate that different assessors marked the same answer script differently and their visual pattern are also varied although they were given the exact same instructions which demonstrates bias to a degree. For quality marking, several findings including the number of assessors needed are also presented in this manuscript.
1. Introduction
In this study we intend to investigate the assessment bias in multiple assessor scenario by careful examination of the marking patterns in terms of given marks and visual pattern of individual assessor. Research studies that investigated the relationship between examiner background and marking performance suggested that various subjective norms influence marking behaviours [1]. These subjective norms differ between individuals, and differ at various junctures of marking conducted, within the same assessment. While background variables such as years of teaching experience, marking experience, experience with subject matter, and consistent behaviour are assumed to play key roles in marking outcomes, objective investigation into these assumptions are required. This gave the impetus to this study.
The match between what is intended to be measured, and what is measured normally upholds the validity in assessment. While subjective judgement is an essential component for validity, this also introduces marker bias. The consequential validity, a type commonly known for nature and load of assessment upon teaching and student learning, while provides crucial information as a result of marking, doesn’t actually provide much needed ‘minimization’ of bias at the time of compiling end results of marking. In essence, using consequential validity doesn’t provide details of marker bias, but it can merely highlight issues in discrepancies [2].
In programming courses, due to the nature, marking criteria is normally a guide, and marker subjectivity is a key component in establishing the consistency. While the moderator or examiner can check the internal consistency of the marker, removal of assessor subjectivity is not that easy, thus necessarily introducing bias. The consistency of the marker is significant than whether he or she disagrees with the marker, in addition to marking criteria. Thus, in higher education assessments, a major threat to reliability is the lack of consistency of an individual marker (as a result of subjectivity), as well as between group of markers.
tasks of training, moderation, ensuring internal consistence are becoming difficult to manage.
Agreement between assessors and within assessors has been used as two main measures of reliability in assessment marking [3]. Despite using marking rubric, there is plenty of evidence on the disagreement between assessors. When specific marking criteria scheme is used, the reliability is slightly improved, but the markers have limited freedom. This technique is not very well appreciated in assessments that are open and subject to critical thinking types. When ‘content specificity’ is employed in assessments, student performance varies between contents, depending upon their knowledge in that domain, and this introduces bias at the time of marking.
The intrinsic validity and extrinsic validity also raise issues in terms of assessment marking bias. While course objectives could have been well described, its broader purpose may not be very clear. Similarly, while the assessment tasks are well defined, the very objective that the assignment is set to accomplish may not be clear. The assessment may not be appropriate for the course or program, and this can introduce varied views in terms of expectations, both from students and markers, leading to bias.
Eye tracking technique has been used successfully to distinguish between novice and expert programmers [4] [5]. The eye tracking is able to capture how a particular document was read, concentration level and concentration areas [6]. In this study we use the eye tracking technology to track the observation behaviour of markers while marking a programming assignment. The observation pattern will then be analysed to establish relationships with marker profile and the actual marks provided by the markers. A number of interesting observation are summaries for the quality marking and reducing the discrepancy among markers. In the following sections we introduce the methodology, experiment details, and results discussion.
2. Methodology
To analyze assessor specific bias in assessments’ marking when there are more than one marker available, past examination scripts were collected from the relevant School in an Australian University after obtaining due permission. The answer sheets were from the programming in java subject. This is a first year undergraduate subject where it is assumed that students have no experience in computer programming. We select the following simple problem among many other problems:
‘Write a program that sorts three integers. The integers are entered from the input dialogs and stored in variables num1, num2, and num3, respectively. The program sorts the numbers so that num1<= num2 <= num3.’
Originally the full mark for this programming problem was 6. The answer sheets were chosen in such a way that there were 2 papers each for the
following obtained numbers 0, 2, 3, 4, 5, and 6 out of 6 giving a total of 12 scripts (S1–S12). No papers could be found that scored 1 out of 6. Then only the page that contained the answer was scanned from each answer booklet to prepare a one page .png file and any identifying information (e.g. student name, student ID, obtained mark etc.) was erased digitally to keep the students and their obtained scores anonymous to the 6 assessors. The answer sheet is selected based on marks provided by the original marker who did not participate in the eye tracker process.
Although the collected answer scripts belonged to both male and female students, all the markers were male aged 30 – 45 years. The first 5 markers (M1-M5) are the university programming markers and the remaining marker, M6 is the subject coordinator of the subject of that university. All of them have years to decades of programming, teaching, and marking experience in general and java course marking. The assessors’ were asked the following five questions in order to assess their academic circumstances:
Q1: How long have you been programming (in years)?
Q2: How long have you been programming in Java (in years)?
Q3: (In a scale of 10) How would you rate your own Java knowledge in the context of an undergraduate Java course?
Q4: How long have you been marking Java courses (in years)?
Q5: How long have you been involved in marking course scripts in general (in years)?
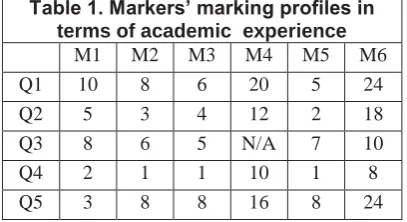
[image:2.595.315.519.443.554.2]Their responses are presented in the Table 1:
Table 1. Markers’ marking profiles in
terms of academic experience
M1 M2 M3 M4 M5 M6
Q1 10 8 6 20 5 24
Q2 5 3 4 12 2 18
Q3 8 6 5 N/A 7 10
Q4 2 1 1 10 1 8
Q5 3 8 8 16 8 24
Before the actual marking took place, the markers were briefed in detail about the experiments including the programming problem, and regarding the health and safety issues with the Eye Tracker (ET) that would be employed. The assessors were requested to break down the total score into various subcategories:
Programming Logic: 3, Syntax: 2 and Program executability: 1 giving a total of 6 points to follow the university guidelines. Afterwards the 12 scripts were shown to the 6 markers on 6 different days on a computer screen at random and they scored the answer sheets.
Figure 1. Evaluation time
prescribed time limit for marking, each examiner was free in taking as long as he wanted to check the scripts. Figure 1 show the time in seconds each assessor required in evaluating the scripts.
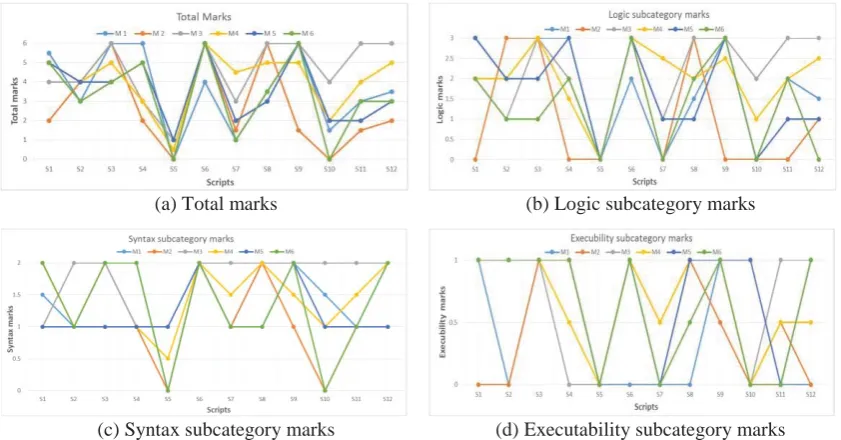
2. Results and analysis
Figure 2(a-d) present the 6 assessors’ total and sub-category marks (inside the parenthesis) given to the 12 scripts. The original marks i.e. the marks that were given to the students during the real university examination were {5, 3, 6, 2, 0, 6, 2, 5, 4, 0, 4, 3} for 12 scripts. There were no subcategory marks provided within the original answer sheets. As the original marker had left the university by the time this research was undertaken, no ET information related to the marker could be obtained and thus markings is not included in this analysis. The numerical data and resulting graphs suggest that there are various levels of discrepancy in total and subcategory markings among the markers. According to the markers’ profiles, M6 is the subject coordinator who has greater experience in Java programming. He is the lecturer of the subject. Hence in this manuscript the performance of others would be compared against him.
From the data, it is evident that total marking discrepancy is relevantly reduced for the highest (6/6, cases S6 and S9) and lowest (0/6, cases S5 and S10) values but variation tends to increase in the middle areas (1/6 – 5/6, cases: S1-S4, S7, and S8). This is expected since generally rational human beings could somewhat detect the best and the worst samples of a population with less effort. However, in the cases where middle range marks were to be awarded, the Java knowledge and experience influence the marking.
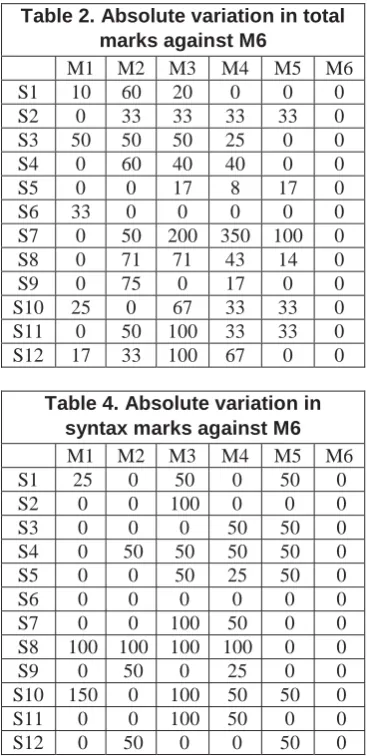
Tables’ 2-5 illustrate the percentage of absolute variation in total and subcategory marks from marker M6 to other markers. In total marking scenario i.e. in Table 2, markers M2 and M3 had 75% and 67% variations respectively only in one case each for highest and lowest marks. Other than that the variation is often low in such cases. Nevertheless in the middle marking ranges the variation is higher, an example of which is S7 that records a 350% variation for M4. Similar trends are observed in subcategory markings.
If the 3 subcategory markings (Tables 3-5) are compared it is observable that the markings variation is lowest when it comes to decide if a program would execute and highest in checking the logic level. This could be explained as like other computer languages, Java programs would be difficult to execute if there are errors in it. It is easier to identify an error than to check the logic of the entire program. Hence marking the logic subcategory thoroughly would be much more difficult than just locating one or more errors which would hinder the executability of the program. Table 6 delineate the variation in marks between the total marks of M6 and average of all other markers. The last column of Table 6 demonstrates that on average all the markers (except M6) varied from 7% to 140% from the subject coordinator M6. In order to assess the performance of the markers, total
(a) Total marks (b) Logic subcategory marks
[image:3.595.77.498.496.716.2](c) Syntax subcategory marks (d) Executability subcategory marks
differences (TD) between M6 and all markers’ marks for all 12 scripts were taken into account. Numerical calculations showed performance of the markers in the order: M5 > M1 > M4 > M2 > M3. The Table 7 presents the ranking (R).
Table 6. % Variation in average total marks against M6
Average M1 to M5
M6 %
Variation
S1 3.8 3 27
S2 5.4 4 35
S3 3.8 5 24
S4 0.5 0 8
S5 5.6 6 7
S6 2.4 1 140
S7 4.7 3.5 34
S8 4.9 6 18
S9 1.9 0 33
S10 3.3 3 10
S11 3.9 3 30
S12 4.3 5 14
Table 7.Markers’ ranking M6
-M1
M6 -M2
M6 -M3
M6 -M4
M6 -M5
S1 0.5 3 1 0 0
S2 0 1 1 1 1
S3 2 2 2 1 0
S4 1 3 2 2 0
S5 0 0 1 0.5 1
S6 2 0 0 0 0
S7 0 0.5 2 3.5 1
S8 0 2.5 2.5 1.5 0.5
S9 0 4.5 0 1 0
S10 1.5 0 4 2 2
S11 0 1.5 3 1 1
S12 0.5 1 3 2 0
TD 7.5 19 21.5 15.5 6.5
R 2 4 5 3 1
2.1 Gaze plots and heat maps analysis
In the above sections numerical data analysis was presented. Here markers’ ET data would be characterized in terms of gaze plots and heat maps in order to gain deeper understanding of their cognitive
[image:4.595.100.284.64.443.2]processes such as attention, problem solving and Table 2. Absolute variation in total
marks against M6
M1 M2 M3 M4 M5 M6
S1 10 60 20 0 0 0
S2 0 33 33 33 33 0
S3 50 50 50 25 0 0
S4 0 60 40 40 0 0
S5 0 0 17 8 17 0
S6 33 0 0 0 0 0
S7 0 50 200 350 100 0
S8 0 71 71 43 14 0
S9 0 75 0 17 0 0
S10 25 0 67 33 33 0
S11 0 50 100 33 33 0
S12 17 33 100 67 0 0
Table 3. Absolute variation in logic marks against M6
M1 M2 M3 M4 M5 M6
S1 50 100 0 0 50 0
S2 100 200 0 100 100 0 S3 200 200 200 200 100 0
S4 50 100 0 25 50 0
S5 0 0 0 0 0 0
S6 33 0 0 0 0 0
S7 0 0 33 83 33 0
S8 25 50 50 0 50 0
S9 0 100 0 17 0 0
S10 0 0 67 33 0 0
S11 0 100 50 0 50 0
S12 50 33 100 83 33 0
Table 4. Absolute variation in syntax marks against M6
M1 M2 M3 M4 M5 M6
S1 25 0 50 0 50 0
S2 0 0 100 0 0 0
S3 0 0 0 50 50 0
S4 0 50 50 50 50 0
S5 0 0 50 25 50 0
S6 0 0 0 0 0 0
S7 0 0 100 50 0 0
S8 100 100 100 100 0 0
S9 0 50 0 25 0 0
S10 150 0 100 50 50 0
S11 0 0 100 50 0 0
S12 0 50 0 0 50 0
Table 5. Absolute variation in executability marks against M6
M1 M2 M3 M4 M5 M6
S1 0 100 0 0 0 0
S2 100 100 0 0 0 0
S3 0 0 0 0 0 0
S4 0 0 100 50 0 0
S5 0 0 0 0 0 0
S6 100 0 0 0 0 0
S7 0 50 0 50 0 0
S8 100 100 100 100 100 0
S9 0 50 0 0 0 0
S10 0 0 0 0 100 0
S11 0 50 100 50 0 0
[image:4.595.72.288.523.718.2]decision making. ET data have been popularly utilized by academic researchers [8] [9] and businesses [10] around the globe to study human emotive responses.
Gaze plots are generated from raw ET data which show the participants’ eye scan pattern in various sized numbered circles in terms of eye location, order, and time spent on the answer scripts. Circle number 1, 2, 3,…, n represent the 1st, 2nd, 3rd and nth look on the
scripts. The diameters of the circles are proportional to the length of the fixation duration, i.e. the time the participants have spent on a particular place which means that the longer the look, the larger the circle. A heat map is a two dimensional colour based graphical rendition of participants' fixation information over the image test areas and the data entries consist of a timestamp, duration, and spatial location (X and Y co-ordinates). Here red usually indicates the highest number of fixations, followed by orange, yellow, and green in fixation level order. Heat maps could also be generated based on viewers’ other eye movement information such as absolute or relative fixation durations, proportion of participants who fixated on each area of the stimulus. It is suggested in [11]that should an analysis benefit from data visualization, a fixation count heat map ought to be presented. Hence in this work total number of fixations (i.e. count) have been used to analyze data. Count heat maps show the accumulated number of fixations where each fixation made by each participant adds a colour value to the fixation map and the value is the same regardless of its duration.
Although gaze plots and heat maps were generated for all 12 scripts and 6 markers, only one representative scenario would be presented in this paper due to space limitations.
Figure 3 demonstrate the resulting gaze plots and heat maps for S1 only. The respective marks are also included at the bottom of each box. It is noticeable that while M6 has covered almost all the area of S1, M2 looked only at the middle and surrounding areas of the S1 and others in between according to the gaze plots. This evidence indicates that visual contour similarity with the bench marker i.e. subject coordinator is a good indicator to be quality marking. The heat maps provide information of the individual marker’s spending time in different areas. The heat map of the marker M2 is different compared to other marker including the subject coordinator. It is interesting to note that the area similarity in the heat maps are also positively correlated with the quality marking. This observation also exhibits more or less similar conclusions which conform another study [12].
Total time spending is another good indication of quality of marking. For example, M6 and M2 spent 173 seconds and 21 seconds respectively in checking S1. The fact that their marks varied by 60% demonstrates that the level of time spending is also a very important factor in this regard.
As demonstrated in Table 7, if marking performance is taken into account the assessors could be ranked in the order: M5 > M1 > M4 > M 2 > M3.
(a) M1-5.5/6 (b)M2 – 2/6 (c) M3– 4/6
(d) M4 – 5/6 (e) M5– 5/6 (f) M6– 5/6
(g) M1 - 5.5/6 (h) M2 – 2/6 (i) M3 – 4/6
[image:5.595.312.526.43.489.2](j) M4 – 5/6 (k) M5– 5/6 (l) M6– 5/6
Figure 3: Markers’ gaze plots for S1 (a)-(f)
and markers’ heat maps for S1 (g) - (l).
However if the assessors’ academic profiles presented in Table 1 are consulted with as then the order becomes M4 > M1 > M2 > M 3 > M5 if equal weight is considered for all 5 questions. Hence it could be stated that experienced assessor would not always produce the best quality marking.
2.2 Number of assessors for quality marking
subject coordinator. To calculate the quality of marking we assume that we need to identify the number of assessors which would give the least differences in marking with the subject coordinator M6. Based on level of Java expertise, and how long assessors were acquainted with Java (as presented in Table 1) the assessors could be tallied in the following order: M4, M1, M2, M3, and M5 in terms of good marker assuming that when university employed an assessor based on the experience.
At first the average marks of the 5 assessors (M1 to M5) for all scripts were calculated and the standard deviation (SD) with their average marks (AVG) to the M6’s marks was calculated and all the SDs’ were summed up for all 12 scripts to tabulate the total SD. Then the statistical calculation was repeated for 4 assessors (M4, M1, M2, M3), 3 assessors (M4, M1, M2), 2 assessors (M4, M1) and 1 assessor (M4) cases. It was obtained that for 1, 2, 3, 4, and 5 assessors’ scenarios the total SDs’ were 11.0, 7.4, 8.2, 9.8, and 8.3 respectively which states that 2 assessors are better for quality marking in the context of this study.
3. Conclusions
Evidence of an association between assessor background and marking consistency indicates that the effects of assessor’s subject knowledge, teaching and marking experience on marking reliability are yet to be fully comprehended, and that discrepancies between grades are still a major issue. This study presents an experimental study into the biasness of marking in a multi-assessor scenario with the help of an eye tracker. The major findings of this manuscript are:
x Variation of marks are least for two extreme cases- best (6/6) and worst (0/6). Differences in marking increases in the middle scenarios (1/6 to 5/6)
x If assessors spend more time then the possibility of variation with the benchmark assessor is reduced.
x If the area of the visual contour (e.g. gaze data and heat maps) is similar to the benchmark assessor, the prospect of less variation is greatly enhanced.
x Marking performance is not always directly proportional to academic experience in terms of year.
x In our case study it was found that in terms of marking variation from the subject coordinator, 2 assessors are the best to produce quality marking.
As data suggests that various assessors’ marking deviated up to 350% from the subject coordinator, it would be interesting to know all the assessors’ respective explanations which could later be analysed. This study could be extended by incorporating examination papers from other disciplines (e.g. engineering, business etc.) and other academic
institutions so that a national framework for examination marking could be proposed for a state or country. The assessors were all males. Hence this study may be gender biased. Additional work is in progress which mitigates the above mentioned issues.
4. References
[1] M. Meadows, “Can we predict who will be a reliable marker?,” AQA Centre for Education Research and Policy, Manchester, 2006.
[2] G. Stobart, “Fairness in multicultural assessment
systems,” Assessment in Education, vol. 12, no. 3,
pp. 275-287, 2005.
[3] S. Fallows and B. Chandramohan, “Multiple Approaches to Assessment: reflections on use of
tutor, peer and self-assessment,” Teaching in Higher
Education, vol. 6, no. 2, pp. 229-246, 2001. [4] B. Sharif, M. Falcone and J. I. Maletic, “An
eye-tracking study on the role of scan time in finding
source code defects,” in Symposium on Eye
Tracking Research and Applications, Santa Barbara, CA, USA., 2012.
[5] R. Bednarik, “Expertise-dependent visual attention strategies develop over time during debugging with
multiple code representations,” International J. of
Human-Computer Studies, vol. 70, no. 2, pp. 143-155, 2012.
[6] P. K. Podder, M. Paul, T. Debnath and M. Manzur, “An Analysis of Human Engagement Behaviour Using Descriptors from Human Feedback, Eye
Tracking, and Saliency Modelling,” in IEEE
International Conference on Digital Image Computing: Techniques and Applications (DICTA-2015), Adelaide, Australia , 2015.
[7] T. Technology, “Tobii Studio 2.2 User Manual,” 2010.
[8] . X. Xie, Z. Liu, S. Song, Z. Chen, . J. Xuan and B. Xu, “Revisit of Automatic Debugging via Human
Focus-tracking Analysis,” in 38th ACM
International Conference on Software Engineering, New York, USA, 2016.
[9] L. Larsson, M. Nystr, R. Andersson and M. Stridh, “Detection of fixations and smooth pursuit
movement data,” Elsevier Journal on Biomedical
Signal Processing and Control, vol. 18, pp. 145-252, 2015.
[10] S. I. G. (SMI), “Augmented Reality Glasses with Eye Tracking Showcased at AWE 2016,” May, 2016.
[11] A. Bojko, “Informative or Misleading? Heatmaps
Deconstructed.,” in Human-Computer Interaction,
2009.
[12] T. Busjahn, C. Schulte, B. Sharif, S. A. Begel, M. Hansen, R. Bednarik, P. Orlov, P. Ihantola, G. Shchekotova and M. Antropova, “Eye Tracking in
Computing Education,” in ACM tenth annual