1876-6102 © 2017 The Authors. Published by Elsevier Ltd. This is an open access article under the CC BY-NC-ND license (http://creativecommons.org/licenses/by-nc-nd/4.0/).
Peer-review under responsibility of the organizing committee of the 1st International Conference on Energy and Power. doi: 10.1016/j.egypro.2017.03.161
Energy Procedia 110 ( 2017 ) 408 – 413
ScienceDirect
1st International Conference on Energy and Power, ICEP2016, 14-16 December 2016, RMIT
University, Melbourne, Australia
Applying infrared thermography and image analysis to dilute
2-phase particulate systems: Hot Particle Curtains
Sepideh Afshar
a, Madoc Sheehan
b,*
aMonash University, Clayton 3800, Australia
bJames Cook University, Townsville 4812, Australia
Abstract
Particle curtains occur in industrial drying and in solar particle receivers and are defined as a stream of particles falling a fixed distance through a gas or fluid phase. In industrial drying optimising heat and mass transfer between the cascading particles and the drying medium is essential for enhancing energy efficiency and reducing emissions. Modelling these devices via pragmatic process systems models and/or with computational fluid dynamics models can contribute to enhanced design and a better understanding of the fundamental processes that occur. Validation of curtain modelling is critical to building confidence in the resultant predictions, but unfortunately traditional methods such as discrete temperature measurement using probes are time consuming and can disturb the flow field. Infrared thermography is an image-based technique with the potential to alleviate some of these issues and to generate whole of field temperature data, well-suited to model validation. In this paper infrared thermographic images of hot particle curtains falling through still air are presented. Image analysis methods for adjusting and scaling images as well as detecting the curtain edges are also described. Experiments involving hot particle curtains (403k-413K) falling through a narrow slot (150×20-60mm) in a room filled with still air (295K-300K) are presented. Curtain widths were varied by varying the slot width (20mm and 60mm) and a range of mass flow rates (0.04kg/s-0.155kg/s) and particle diameters (290μm and 400μm) were examined. Curtain shape, as defined by the edges of the curtains, was determined using methods adapted from image analysis. The 2D thermal images showed that the shapes of the curtains are strongly dependent on slot width or initial solids volume fraction, which has implications for maximising heat transfer in particle curtain processes.
© 2017 The Authors. Published by Elsevier Ltd.
Peer-review under responsibility of the organizing committee of the 1st International Conference on Energy and Power.
Keywords: Particle curtains; heat transfer; image analysis; infrared thermography.
* Corresponding author. Tel.: +61-7-47814153;
E-mail address: madoc.sheehan@jcu.edu.au
© 2017 The Authors. Published by Elsevier Ltd. This is an open access article under the CC BY-NC-ND license (http://creativecommons.org/licenses/by-nc-nd/4.0/).
1.Introduction
Particle curtains are defined as a stream of particles falling a fixed distance through a gas or fluid phase. Typical unit operations that involve particle curtains are flighted rotary dryers (FRD) and solid particle receivers (SPR). In
FRD’s the narrow end of the curtain is exposed to cross flowing gas, while in SPR’s the entire width of the curtain is
exposed to solar radiation. There is a large body of literature describing models of flighted rotary dryers where estimation of curtain properties are important [1, 2] especially the effects of particle size, particle flow rate and solids volume fraction.
Typical approaches to modelling curtains are to assume curtains behave as population of particles where each particle behaves as if it is a single particle exposed to ambient gas, typically referred to as an isolated sphere approach. This approach tends to overestimate the heat and mass transfer experienced by the curtains. In addition, the drag experienced by particles within curtains is less than that for an isolated particle because particles are influenced by the bulk, which entrains gas as it falls. According to isothermal studies by Wardjiman et al. [3, 4] the shape of the particle curtains varies with initial curtain widths (i.e. initial solids volume fraction), and can lead to both divergent and convergent curtain behaviour. Kim et al. [5] and Wardjiman et al. [3, 4] studied isothermal curtain widths experimentally and observed respectively that the shape of the curtain shifted from divergent (narrows as it falls) to convergent (expands as it falls) as mass flow rate and initial solids volume fraction increased.
Relevant literature describing experimental and modelling investigations of particle curtains undergoing heat transfer with surrounding gas includes work by Hurby et al. [6], Chen et al. [7], and Wardjiman et al. [8]. Typical particle diameters and flow rates have been 200 - 650μm and 0.02 and 0.04kg/s. In all these examples model validation
has involved comparison of predicted particle and gas temperatures to that obtained via direct temperature measurement using discrete sampling [6, 8]. For particle temperatures this has involved the use of small cups with holes in their bases for the particles to flow through. Cup sizes limit precision and holes must be adjusted for differing mass flowrates of particles to ensure that particles do not stagnate inside the cups. Furthermore, sampling directly within the curtains distorts the curtain flow field, making repeat experiments necessary, adding to the expense in collecting validation data. Clearly a non-invasive technique that provides particle temperature across the entire flow field would offer significant advantages over discrete measurement.
Infrared thermography is image-based non-invasive method with the potential to collect comparatively fast two-dimensional temperature profiles across the entire field of interest in particle curtain systems. Most applications of IR thermography have been in the field of reliability maintenance. The few examples of the use of applied infrared thermography to visualise temperature in the particulate systems include Yamada et al. [9], Dang et al. [10], and Patil et al. [11]. Yamada et al. [9] used IR thermography to investigate conductive heat transfer in a fluidised bed. In their research, the temperature of fluidising particles in contact with a solid heat transfer surface was visualised at the microscopic level. Infrared thermography was used to measure the temperature of single particles including glass
beads with average diameters of 400μm and 600μm and iron particles, 300μm in diameter. Dang et al. [10] used infrared thermography to measure the concentration of CO2 inside bubbles injected into a gas-particle fluidised bed.
2.Experimental
2.1.Apparatus and materials
The experimental apparatus consisted of an insulated wedge hopper fitted at its base to a spreader box which was internally fitted with perforated plates and wire mesh screens, a flat board (black background) 0.68m behind the curtain, a balance scale indicator measuring the weight of a particle collection bucket, an infrared camera and laptop. The experiments were performed using Potters Industry® spherical glass beads with mean particle size quoted from Potters Industry® of 290µm, 400µm and 610µm, density of 2500kg/m3, heat capacity of 0.83 (kJ/kg ᴼC) and thermal conductivity of 0.18 (W/(m.K)). The maximum capacity of the hopper was approximately 7kg of glass beads and was coated with black paint to reduce light reflection. The black background located behind the hopper gave a higher level of contrast between the white glass beads and the background during photography. The hopper was fabricated with a valve to manually regulate the mass flow rate of the particle curtains between 0.04-0.55kg/s. Falling particles were collected in a catch bin which was placed on a digital scale indicator connected to a R400 viewer device to measure the mass of the falling particles over time. A linear correlation was used to fit the mass versus time data over the duration of each experiment (approx. one to two minutes duration) and regression constants (R2) varied between 0.99
to 1 across all runs and particle sizes, demonstrating a very consistent mass flow rate of particles leaving the spreader box. Two sizes of spreader box were designed in order to generate uniform particle curtains across two slot widths investigated (20×150mm and 60×150mm). The spreader box consisted of a thick casing enclosing two perforated plates followed by two wire mesh screens. The perforated plates were specifically designed for the two different slot sizes (20mm and 60mm), and specific details can be found in [12].
An infrared camera (NEC Avio, H2600 Series developed by FLIR Systems) with resolution of 640×480 pixels was used to capture thermal images of the particle curtains using a frame rate of 0.033s. Based on the camera location and distance from the curtains used in this work the size of each pixel detected by infrared camera was 1.5175mm. Therefore individual particles were not detectable and each image captured by the infrared camera is an amalgamation of many particles falling through each frame, noting that each image is also hundreds of particles deep. Ten images were averaged in image processing and a pseudo-steady state approximation is assumed. The infrared camera was held perpendicular to the front of the spreader box, aligned with the narrow dimension of 20mm and 60mm (for the two slot widths) at a distance of 1.78m from the hopper. This was a manually optimised distance in which the thermal images appeared sharpest. Deducting the height of the scale indicator, catch bin and spreader box, approximately 62cm of falling distance was captured during the thermal photography.
Reflection calibration was performed and particle emissivity was set to unity. The infrared camera was connected directly to a laptop via an IEEE 1394 cable. InfRec Analyzer NS9500 Professional software in snapshot format was used to record the thermal images and a range of 0 to 500oC was set. The focal position (0 -1023) was adjusted via the
camera software to 850, where the images appeared most vivid. The images were captured in the SVX format.
2.2.Conditions
Experiments were undertaken in a fully sealed and air conditioned room such that ambient air movement was minimised. This was important because curtains are easily influenced by even minor air movement, causing wobbles and non-symmetric profiles. Symmetric profiles are essential to compare thermography to curtain CFD simulations, which never exhibit these types of (real-world) fluctuations. The humidity and temperature of ambient air was recorded by a humidity sensor (Testo 610 made in Germany).The experiments were carried out using two particle sizes (290 and 400µm), different mass flow rates (0.055 to 0.55kg/s) and for two opening slot widths (20mm and 60mm).
with the camera and scale indicator were initiated before taking the hopper out of the oven. Immediately after heating, the hopper was placed in the spreader box. Full experimental details are reported elsewhere [12].
The initial temperature of particles at the hopper exit was independently measured using a long probe thermocouple and compared to the temperature obtained by infrared thermography measurement at the spreader box exit, with a calculated Root Mean Square Error (RMSE) of ±0.56oC.
3.Image analysis & edge detection
Raw images underwent a process of scaling to identify length and height dimensions and the precise location of the spreader-box exit. The 2D thermal images were also manipulated by row shifting about the maximum centre point temperature to enforce symmetry in the x direction. Image data in the form of a 2D matrix of temperature data was exported to Matlab for further processing. In image analysis, an edge point is often defined as the location of a local intensity change. In visible image analysis edges are typically identified by a change in visible image pixel intensity (hence the importance of a black background against the white particles). Specifically, the gradient based edge detection technique detects the edges by looking for the maximum in the first derivative of a grey-scale visible image’s pixel intensity [13]. A similar methodology was applied to the 2D infrared thermal images, but edge detection was based on the gradient of temperature instead of intensity.
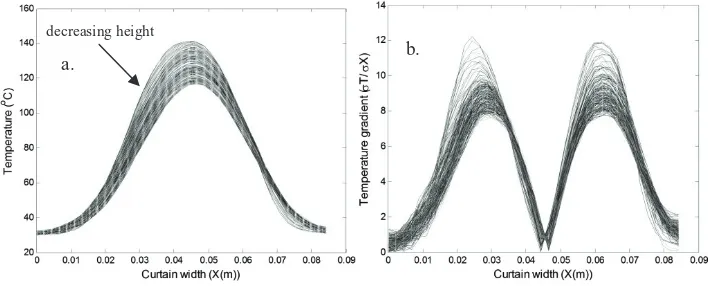
Figure 1(a) shows an example of particle curtain temperature profiles extracted at various heights from a thermal image and plotted across the width of the particle curtain. To facilitate numerical differentiation of this temperature data, a “Gaussian Kernel” function (Sigma=1 and Kernel size=Sigma×6) was used to smooth the raw temperature profiles. The smoothed temperature data was differentiated with respect to width using the “gradient” function in
Matlab, which utilises a forward difference approach. Figure 1(b) shows the gradient profiles corresponding to raw temperature profiles in Figure 1(a).
Temperature gradients in Figure 1(b) are not as smooth as the raw temperature profiles because the temperature profiles are smoothed with low sigma values in the Gaussian function. Smoothing with higher sigma values attenuates the temperature gradients and causes loss of data in the smoothing process. Two maxima can be clearly seen, which we assume to correspond to the locations of the two curtain edges. The final data manipulation was to enforce symmetry on the edges associated with the 2D thermal images. For each row of thermographic data, the midpoint between the two identified edges was determined. Each entire row of data is then shifted left or right, so that the midpoint corresponds to the geometric centreline.
Fig.1. (a) Raw data temperature profiles, ds=290µm, mo=0.066kg/s and slot width=20mm (b) Temperature gradient profiles, ds=290µm,
mo=0.066kg/s and slot width=20mm
decreasing height
[image:4.544.86.440.422.565.2]4.Results & discussion
In Figure 2 we present the filtered and symmetrical infrared thermal images for various mass flow rates, particle sizes and slot widths. Edge predictions based on the gradient technique (performed with respect to temperature) have been overlaid onto the thermal images. Unlike visible image processing where an intensity threshold is often used to infer edge locations, the predicted edges are not able to be defined by a temperature cut-off and a gradient based approach is essential.
[image:5.544.99.476.155.575.2]
Fig.2. Predicted edges of the particle curtains in black, overlaid onto the thermal images (a) ds=290µm, mo =0.066kg/s and slot width=20mm (b)
ds=400µm, mo =0.062kg/s and slot width=20mm (c) ds=290µm, mo =0.14kg/s and slot width=20mm (d) ds=400µm, mo =0.138kg/s and slot
width=20mm(e) ds=290µm, mo =0.063kg/s and slot width=60mm
Figures 2(a) and 2(e) are images of constant mass flow rate and constant particle size, and illustrate differences in slot width (or initial solids volume fraction). Although comparison to filtered and thresholded visible images would
Curtain width(X(m)) D ist a n ce f ro m sp re a d e r b o x( Y (m ))
0 0.02 0.04 0.06 0.08 0.1 0 0.1 0.2 0.3 0.4 0.5 0.6 T e m p er at ur e ( oC) 0 20 40 60 80 100 120 Curtain width(X(m)) C u rt a in h e ig h t(Y (m ))
0 0.02 0.04 0.06 0.08 0.1 0.12 0 0.1 0.2 0.3 0.4 0.5 0.6 T e m per at ur e ( oC) 0 20 40 60 80 100 120 Curtain width(X(m)) D is tanc e f rom s p re ader box (Y (m ))
0 0.02 0.04 0.06 0.08 0.1 0.12 0.14 0.16 0 0.1 0.2 0.3 0.4 0.5 0.6 T e m per at ur e ( oC) 0 20 40 60 80 100 120 Curtain width(X(m)) D is tanc e f rom s p re ader box (Y (m ))
0 0.02 0.04 0.06 0.08 0.1 0 0.1 0.2 0.3 0.4 0.5 0.6 T e m p er at ur e ( oC) 0 20 40 60 80 100 120 Curtain width(X(m)) D is tanc e f rom s p reader box (Y (m ))
0 0.02 0.04 0.06 0.08 0.1 0.12 0.14 0 0.05 0.1 0.15 0.2 0.25 0.3 0.35 0.4 0.45 0.5 T e m per at ur e ( oC) 20 40 60 80 100 120
a.
b.
c.
d.
be necessary to confirm the precision in the methodology, from a qualitative standpoint the edge detection technique appears to work successfully. Comparing Figures 2(a) and 2(e) demonstrates a “narrowing as it falls” curtain profile occurring under conditions of low initial volume fraction, despite similar mass flowrates and particle sizes in the two figures. When the initial solids volume fraction is low the pressure outside the curtain is greater than that inside the curtain [4, 6]. This leads to a contracting curtain. The thermal image comparison also suggests a greater degree of cooling (i.e. heat transfer) occurs in the low solids volume fraction situation, which would be supported by the ingress of cooler ambient air into the curtain, which is driven by the pressure differences.
Figures 2(a) and 2(b), and Figures 2(c) and 2(d), illustrate differences in particle size (i.e. slot width and mass flow rate are held constant) for both low and high mass flow rate situations, respectively. The effects of particle size at both low and high mass flowrates on curtain shape are not as substantial as the effects associated with initial volume fraction. Most curtains exhibit uniform profiles. Additionally, there is more noise and fluctuation in the image data associated with the larger particle size situations. Methods to reduce this noise include capturing thermal images of the background and digitally removing this from the whole field thermal image (i.e. isolating the curtain only). Making conclusions regarding the absolute temperature variance is complicated by the influence of volume fraction on the extent of saturation of each thermal image pixel with particles. For example, low volume fractions would lead to reduced numbers of particles entering each pixel over the duration of the image capture, compared to higher volume fractions. Thus lower numbers of particles would reduce the average temperature registered by the thermal camera. Discrete temperature measurements and coupled visible/thermal images are necessary to better understand the interaction between these factors, but are beyond the scope of this paper.
5.Conclusions
A selection of infrared thermal images of hot falling particle curtains are presented in this paper for various mass flow rates, particle sizes and initial solids volume fractions. The experimental setup used to generate consistent curtain flow rates, evenly distributed particles and quality thermal images without disturbing the multiphase flow field is outlined. A thermal image processing technique which predicts curtain edges by identifying change in the temperature gradient with respect to the horizontal dimension is utilized. Thermal images and edge predictions reinforce observations from isothermal studies using visible image analysis. Qualitative observations suggest that thermal images of smaller particle are less susceptible to noise than those of larger particles. Coupling of visible image analysis, discrete temperature measurement and thermal imagery is necessary to be able to make quantitative conclusions in regard to heat transfer and temperature.
References
[1]Baker CGJ. Air-solids drag in cascading rotary dryers. Drying Tech 1992; 10:365-393.
[2] Ajayi OO, Sheehan ME. Design loading of free flowing and cohesive solids in flighted rotary dryers. Chem Eng Sci 2012; 73:400-411. [3] Wardjiman C, Lee A, Sheehan ME, Rhodes M. Behaviour of a curtain of particles falling through a horizontally-flowing gas stream. Powder
Tech 2008; 188: 110-118.
[4] Wardjiman C, Lee A, Sheehan ME, Rhodes M. Shape of a particle curtain falling in stagnant air. Powder Tech 2009; 192: 384-388. [5] Kim K, Siegel N, Kolb G, Rangaswamy V, Moujaes SF. A study of solid particle fow characterization in solar particle receiver. Solar Energy
2009; 83: 1784-1793.
[6] Hurby J, Steeper R, Evans G, Crowe C. An experimental and numerical study of flow and convective heat transfer in a freely falling curtain of particles. J Fluid Eng-T ASME 1988; 110: 172-181.
[7] Chen H, Chen Y, Hsieh HT, Siegel N. Computational fluid dynamics modeling of gas-particle flow within a solid-particle solar receiver. J Sol Energy Eng 2007; 129: 160-170.
[8] Wardjiman C, Rhodes M. Heat transfer in a particle curtain falling through horizontally-flowing gas stream. Powder Tech.2009;191:247-253. [9] Yamada J, Nagahara N, Satoh I, Kurosaki Y. Direct-contact heat exchange between fluidized particles and a heat transfer surface in a fluidized
bed: Temperature visualization of fluidizing particles. Heat Tran Asian Res 2002; 31: 165-181.
[10] Dang TYN, Kolkman T, Gallucci F, Van Sint Annaland M. Development of a novel infrared technique for instantaneous, whole-field, non invasive gas concentration measurements in gas–solid fluidized beds. Chem Eng J 2013; 219: 545-557.
[11] Patil AV, Peters EAJF, Kolkman T, Kuipers JAM. Modeling bubble heat transfer in gas–solid fluidized beds using DEM. Chem Eng Sci 2014; 105: 121-131.
[12] Afshar S. Modelling and infrared thermal imagery of hot particle curtains. PhD, James Cook University, Australia; 2016.