Chapter
4
Gost Analysis
This chapter deals
with
the requirementsfor
costcontrol,
the methodby
which planned cost is calculated, theuse of hammock activities
for
measurement ofindirect
cost, calculation of value and actual costof work
com-pleted, and computation
of
theoutlook for
a project which isin
progress. Examplesof
Cost Analysisoutput
are given. For thosewith
considerable experienceof
1900 Series PERT Cost Analysis, there is a concludingsiction
on the use ofnon-standard record designations.The zubject
of
costcontrol
isiomplex,
controversial, and subjectto
many formsof
application andinterpretation.
The facilitiesin
the Cost Analysis program aim essentially at providin g a typeof contiol
that is directlylinked
with
anetwork
and which,by
its nature, must be considered as a methodof
direct costing;but
speciai cost-oriented activities (called hammocks) may be usedto
provide a mediumfor indirect
cost measurement.REOUIREMENTS FOR COST
ANALYSIS
Management may require the
following
items ofinformation in
orderto
control
costs effectively: Requiredfor
comparisonof
alternativeinitial
plans.Required
for
comparisonwith
the approved planned cost, sothat
a project which is under way may be assessed.I
Planned costfot
a proposed scheduleK
All
these figures may be requiredfor
theproject
as a whole,but
they may also be calculatedfor
zubfivisionsof
aproject, vdrich may be as small as individual activities,
but
whichwill
more usually be subprojects, or groupsof
activities designatedby their
cost codes.INPUT
To enable the program
to
calculate these itemsof
cost,it
is necessaryto
addto
theinformation
usedfor
Resource Analysis thefollowing:
J
Cost per resourceunit for
normal vage(normal
cost)2
Cost per resourceunit
for
threshold lszge (threshold cost)3
Cost per resourceunit for
usagein
excessof
the threshold (super cost)4
Time Progress data, zuch asactivity
start and finish dates and the timeto
completionof
activitiesin
progress5
Cost progress data, which is the actual costof
completed orpartially
completed activities, includingham-mock activities which-may cover a group
of
normal activities.PLANNED COST
The planned expenditure
for
all orpart of
a project is calculatedfrom
theunit
costsof
the resources employed. The computation is performedin
three stages.In the
first
stage the average costfor
each resourcein
each time periodto
be considered is worked out.If, for
instance, a resource availability has been set throughout the project as
10 normal 4 threshold
where the threshold availability comes
from
such measures as overtime or subcontracting, and the costof
theresource has been set at
80s per
unit for
normal usage,l00s per
unit
for
threshold usage,140s per
unit for
usagein
excess'of the threshold.If
in
addition, three sample daysof
a schedulefor
the project were examined,on day
7l,the
usage is 5, on day82,the
usage is 12,and
on
day 87, the usage is 15for
the resourcein
question. The calculationfor
these three days would be:For day 71, the five man days used are at normal rate (80s) so
that
thetotal
cost of the resource is 400s, and theaverage cost per man day is 80s.
For day 82,lll.e twelve man days worked include ten at the normal rate, and
two
at the higher threshold rate. Thus, thetotal
cost of the resource on this day is 1000s, and the average costperman
day is 83sto
the nearest sttilling.On day 87,
the
15 man days used are ten at normal rate,four
at threshold rate and one at excess rate. Thetotal
cost is therefore 1340s, vil-rich makes the average cost per man day 89s.This calculation is carried
out for
every resourcefor
each time periodof
the project.In
the second main gtageof
the calculation the resource usage of individual activities is extended by these average pricesto
obtainfor
eachactivity
a planned cost. From the example,it
is clear that the costof
anactivity
depends on whereit
is scheduled, and the Resource Analysis program tendsto
schedule activitiesinto
areas where the resources which they require are cheap.In
thethird
andfinal
stage the planned costs obtainedfor
individual actiyities are aggregatedto
give thetotal
planned expenditure, time periodby
time period,for
the project.It
is at thispoint that
activities may also be consideredin
groupsto
give totalsfor
such entities as individual departments and cost centres. The calculationsoutlined above mean that
it
is possibleto
obtaindifferent
costsfor different
schedulesof
the same project. Forinstance, the
total
planned project costwill
varywith
the amount of threshold resources used. From these figuresit
is possibleto
compare the relative efficienciesof
two
alternative schedules. Mostof
this reasoning depends on the factthat different
costs have been quotedfor
the normal and threshold use ofresources.Ifno
threshold orexcess costs are quoted, planned project costs
for
different
scheduleswill
produce the sametotal,
since the number of man days worked is theonly criterion,
and no account is takenof
thedistribution.
These remarks are made on the assumption that the planned costs arenot further
analysedby
a D.C.F. calculation such asICL
PROSPERwhich takes
into
account the dateof
a cashflow,
as well as the amount.HAMMOCK
ACTIVITIES
The calculation of planned costs so far has been solely
in
termsof
directactivity
costs.It
isnot
always easyto
include all costs on this basis, since items such as overheads often cannot be assignedto
individual activities.In
orderto
overcome thisdifficulty,
thefaciltty
of using ahammockactivity
is provided: This resembres a normalactivity in
every way, except thatits
duration isnot
specified oninput
nor car progress be reported onit.
In
the courseof
the Cost.A,nalysis calculation, the lengthof
a hammockactivity for
a particular schedule is the difference in time between the occurrenceofits
preceding and succeeding events, and therefore any resource usages or costs attachedto
it
will
be includedin
the project costsfor
the calculated durationof
the hammock.Examples
If it
were necessary to include a chargeof
f,100 per dayfor
each periodof
a project's duration, a hammockactivity
from the
first
eventof
the networkto
the lastwith
a daily rate of expenditureof
f,I00
would achieve this, be-cause its calculated lengthwould
equal the durationof
the project.It
is clearly possibleto
connect a large numberofactivities
over different partsofthe
projectto
represent suchtliings as various overheads, men standing
by,
equipment tied up and so on. Further, the factthat
a responsibilityand cost code can be attached to'a hammock
activity
means that itscontribution
can be includedin
the correctzubtotals when a breakdown of project totals is being carried out.
Hammocks may also be used
in
making allowancefor
a penalty clause or bonus paymentfor
the completionof
a project, and
for
producing hig[-level management reports. Their great advantagein
this respect is that they haveSUBPROJECTS
AND
SKE LETONSIt
is often convenientto
divide a largenetwork
into
smaller sections, know as subproiects. Theinput
formatsfor
activities and eventshave a
field for
a subproject code. When this code is used, the same event names may be usedin different
subprojectswithout
any riskof
confusion, since normally the program treats the subprojects asseparate entities. There are inherent advantages
in
this system;for
example, subcontractors may draw uptheir
sectionof
a project network independentlyof
anyone else, andin addition
secrecy can be maintained wherenecessary, since the people who must be consulted on the drawing
of
partof
the network need never see thewhole.
There are cases, however, where these subprojects must be interconnected: this connection is achieved
by
the useofinterface
events.If
an eventin
one subproject is denoted as an interface event,it
is treated as identicalto
anyother event which has the same name
in
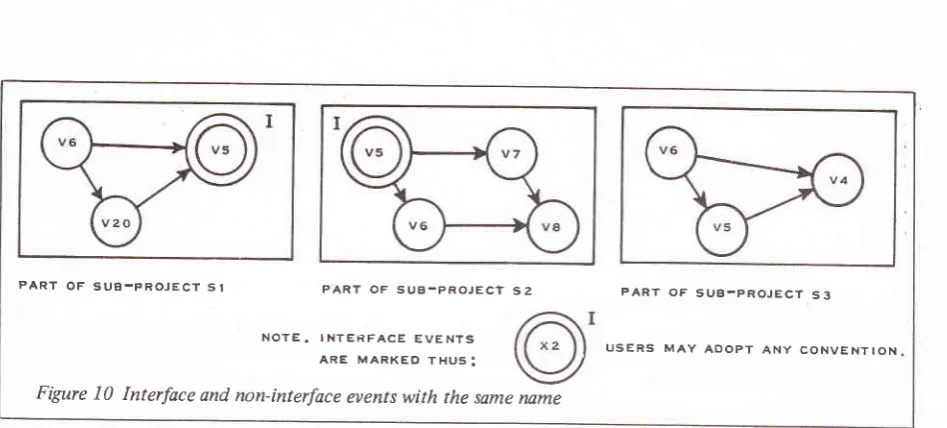
another subproject and which is also designated as interface. Figure 10 shows partsof
networksfor
three subprojects. Each subproject includestwo
events namedV5
andV6. In
S1 and 52, eventV5
is marked as an interface event: the programwill
therefore treatV5 in
Sl
andV5 in
52 as the same event. However, as eventV5 in
53 isnot
marked as interface the programwill
not'considerit
as identicalto
eventV5 in
any other subproject. The three events namedV6
will
all be treated asdifferent
events.If
scheduled or progress dates areto
be appliedto
an interface event, they must be applied to every subprojectin
which the interface event occurs.PART OF SUS-PROJECT 5I PART OF 5UB-PROJECt S2 PART OF SUB.PROJECT
S3
USERS MAY AOOPT ANY CONVENTION
NOTE. INTERFACE EVENTS
[image:4.612.57.531.41.255.2]ARE MARKEO THUS:
Figure
l0
Interface and non-interface eventswith
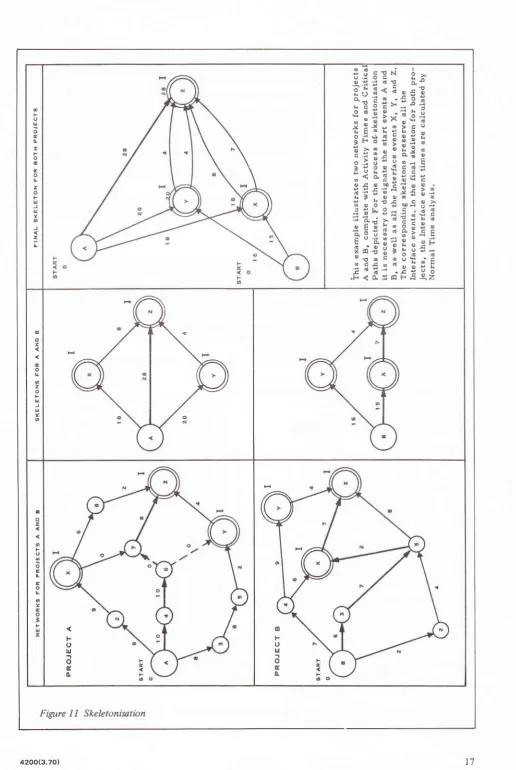
the same rumeA further
advantageofsplitting
uir large projectsinto
subprojects is thepossibility
of skeletonisalloz. This is largernetwork
than would otherwise be possible onn is a
network
which showsonly
interface events and:letonised, its effect on other subprojects is unchanged. rprojects. The program produces skeletons
for
eachsubproject; these skeletons
will
usually be less thanone-tinth of
the size o=f ttre original network, They are combinedinto
one skeleton_for the whole project, and Time Analysis is performed-in the usual way.ihe
event times obtained thus are used as scheduled dates on the original subprojeCt networks whenthey
are re-analysed.An event may be specified as a skeleton event. This signifies that the event should be retained during the
skeleton-isation process,
but
thatit
isnot
an interface event: therefore eventswith
the same namein
other sribprojectswill
not
beidentified with
the skeleton event.TIME
ANALYSIS
The purpose
of
the Time Analysis program isto
reducemultiple
time estimatesto
an expected time andto
use these estimatesof activity
durations as specifiedby
the userin
calculating thefollowing:
I
The earliest and latest dates at which events may be achieved2
The earliest and latest start andfinish
datesfor
activities3
The amountof total float
on activities, and the slack on events4
The critical path through thenetwork
This calculation shows whether any scheduled dates imposed are
likely to
be achieved.If
no scheduled dates are imposed on the end date or datesof
the project, the program assumesthat
these areto
be achieved as early aspossible.
The results produced
by
the Time Analysisprogam
are preserved on the PERT datafile.
Nots
It
is assumed that most readers are alreadyfamiliar with network
techniques, and therefore the methodsused by Time Analysis are
not
explained here.A
zuitabletext book
strould be consultedfor
thisinformation,
such as H.S. Woodgate,Planning by Network,Business Publications, 2ndedition
1967 or J. Moder and C. phhhps,hoject
Manogementwith
CPM and PERT, Reinhold, Newyork,
1964.Definition of
earliest and latest dates andfloat
EARLIEST START ted, taking
into
ctivities
in
the onworking
This consists
of
theactivity's
earliest start plus its duration.It
is calculated on working days, and any specified holidays are excluded. This consistsof
the activity's latest finish minus its duration.It
is calculated onworking
days, and any specified holidays are excluded.EARLIEST FINISH
I.ATEST START
o F o u o G I
r
F o o c o L z o F U J U Y o)
= L3l::s
io
.9.:E d9
o.-ii
sI;I
g
I
e
a!
9;t
b.9
iEtl?gX3
r E @ k: ! O.r9F$*!fr!r
Ein:t[*r
:i ilrEI:
fi€IrEIr;e
kSqlooq6
"
5€
f *5
!i
i
ici;T
Ei
i
!
F;ssgii$:
iT#;
Ug$
E.tr<ft.:oF'I.gZ
o o z c o L o z o F U J l! Y o E o z o F o U o G I E o L o I E o 3 F U z F o !t -l o E o o F o td -l o E0-Figure I
I
Skeletonivtion
1a II
[image:5.612.56.573.37.808.2]