Quantifying the Properties of a Dosimeter Responsive to
Blue Light Hazard Effective Wavelengths
A dissertation submitted by
Om Shanaf Abudabous
For the award of
Master of Science (Research)
2014
i
ACKNOWLEDGEMENTS
I would like to express my special thanks of gratitude to my supervisor Professor Alfio
Parisi, who gave me the golden opportunity to do this wonderful project on the topic
“Quantifying the Properties of a Dosimeter Responsive to Blue Light Hazard Effective
Wavelengths”, which also helped me in doing a lot of research and I came to know about
so many new things. I am really thankful to my husband and my kids who have supported
me a lot to finalize this work within the time. I would also like to thank my family and
friends who have always paid attention about what I did in my project, and morally help
has also been given. I would like to thank the Physical Sciences staff of the University of
Southern Queensland for their support over the course of this program. Finally, I am
ii
Certification of Dissertation
I certify that the ideas, experimental work, results, analyses, software and conclusions
reported in this dissertation are my own effort, except where otherwise acknowledged. I
also certify that work is original and has not been previously submitted for any other
award, except where otherwise acknowledged.
Signature of Candidate Date
ENDORSEMENT
iii
ABSTRACT
The research reported in this dissertation characterizes the properties of a proposed blue
light dosimeter suitable for measuring the ocular blue light hazard. Blue light of high
intensity with shorter wavelengths (400-500 nm) has been shown to produce an adverse
effect on the healthy human eye, and the hypothesis proposed is that a dosimeter based on
polysulphone and phenothiazine has the properties to act as a dosimeter to measure
exposure to the blue light hazard. Exposure to the shorter wavelengths of blue light is
measured by weighting the spectral irradiance of a light source against the blue light
hazard action spectrum, and the dosimeter employed in this study uses a long pass filter
to remove ultraviolet wavelengths shorter than 380 nm. An examination of the
polysulphone and phenothiazine dosimeters was completed for the change in absorbance,
dose response, the dark reaction, repeatability of measurement, the influence of the angle
of the receiving plane, and stability against changes in irradiation and temperature. The
results show that a change in the dosimeter optical transmission occurs as a result of
exposure to blue light, with maximum dosimeter response after exposure to wavelengths
around 420 nm. The polysulphone and phenothiazine dosimeters were exposed to four
light sources and dose response calibration curves established that relate blue light
exposure to the change in absorbance. The effect of the angle of the receiving plane was
found to be approximated by a cosine function for angles up to 70º from the normal, with
the difference between measured and theoretical values in this angle range being less than
about 0.2. Dosimeter response to repeated solar radiation exposure was found to be
iv
in terms of the average change in absorbance in darkness was also found to be small, with
a change of 0.056 at zero hours being 0.058 after 24 hours and 0.067 after one week.
Dosimeter rate variations with irradiance variations between 10 W/m² and 15 W/m² were
found to be only ± 10 %, and thus within the measurement error of the badges. Dosimeter
responses were also found to be stable for temperatures ranging from 23 ºC to 37 ºC.
Taken together, all these results lead to the conclusion that polysulphone and
phenothiazine dosimeters have characteristics that enable their widespread use for rapid,
v
Table of Contents
Acknowledgments………..i
Certification of Dissertation………..ii
Abstract………...iii
List of figures………vii
List of tables………....viii
1. CHAPTER ONE ... 1
1.1 Introduction ... 1
2. CHAPTER TWO ... 3
2.1 Literature Review and Scope of the Project ... 3
2.2 Electromagnetic Radiation and Eye Damage ... 3
2.2.1 Electromagnetic Radiation ... 3
2.3 Eye Damage ... 4
2.4 Action Spectrum ... 6
2.5 Blue Light Hazard ... 8
2.6 Measurement Techniques ... 10
2.7 Research Project ... 14
2.7.1 Research Hypothesis ... 14
2.7.2 Research Objectives ... 14
3. CHAPTER THREE ... 15
3.1 Methodology ... 15
3.1.1 Equipment and Materials: ... 15
3.1.2 Dosimeters ... 15
3.2 Blue Light Hazard Exposure... 16
3.3 Making Dosimeters ... 17
3.4 Change in Absorbance ... 18
3.5 Dose response ... 19
vi
3.7 Dose Rate Independence: ... 31
3.8 Reproducibility ... 34
3.8.1 Dark reaction ... 34
3.9 Temperature Independence: ... 35
4. CHAPTER FOUR ... 36
4.1 Results ... 36
4.1.1 Change in Absorbance ... 36
4.1.2 Dose Response ... 38
4.1.3 Influence of the Angle of the Receiving Plane ... 42
4.1.4 Dose Rate Independence ... 43
4.1.5 Dark Reaction ... 44
4.1.6 Temperature Independence ... 46
5. CHAPTER FIVE ... 47
5.1 Discussion ... 47
5.1.1 Change in Absorbance ... 47
5.1.2 Dose Response ... 47
5.1.3 Influence of the Angle of the Receiving Plane ... 49
5.1.4 Dose Rate Independence ... 49
5.1.5 Dark reaction ... 50
5.1.6 Temperature Independence ... 51
5.2 Significance ... 52
5.3 Future Directions ... 52
6. CHAPTER SIX ... 54
6.1 Conclusion ... 54
7. REFERENCES ... 56
vii
LIST OF FIGURES
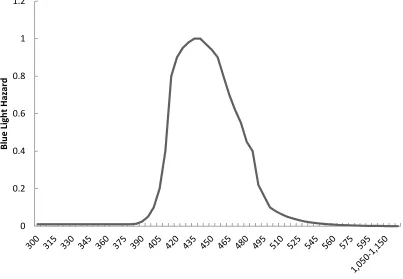
Figure 1 Blue light hazard action spectrum (ICNIRP, 1997)... 8
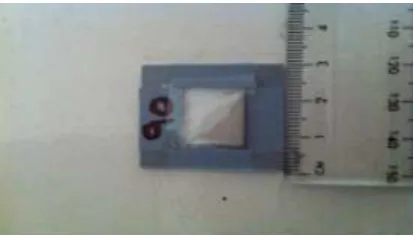
Figure 2 Dosimeter with polysulphone and phenothiazine films and a Llumar filter ... 17
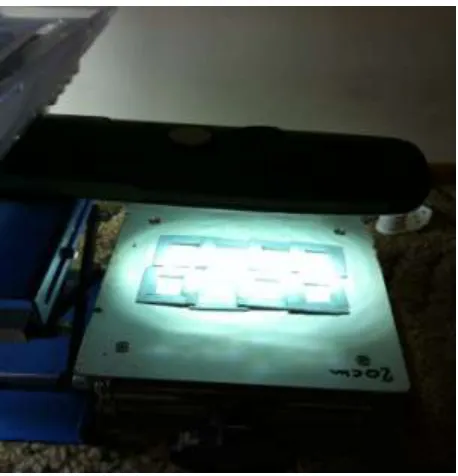
Figure 3 LED light exposure for eight dosimeters to determine the dose response ... 20
Figure 4 The spectral irradiance for the LED light ... 21
Figure 5 Exposing the dosimeters for the dose response compact fluorescent lamp (15 W, 5000 K) ... 22
Figure 6 The spectral irradiance for a compact fluorescent lamp ... 23
Figure 7 The spectral irradiance for the solar simulator ... 25
Figure 8 A fluorescent light exposing ten dosimeters at 10 cm ... 27
Figure 9 The spectral irradiance for the fluorescent light ... 28
Figure 10 A solar simulator exposing dosimeters at different angles ... 30
Figure 11 The fluorescent tube exposing dosimeters at different distances of 5 cm, 10 cm, 15 cm and 20 cm ... 32
Figure 12 The spectral irradiances of the fluorescent lamp at distances of 5 cm, 10 cm, 15 cm and 20 cm. ... 33
Figure 13 The pre exposure spectral transmission averaged over ten dosimeters (top curve) and the average post exposure (bottom curve) spectral transmission following exposure to sunlight. ... 36
Figure 14 The spectral transmission averaged over twenty dosimeters for pre (top curve) and post exposure (bottom curve) to a lamp... 37
Figure 15 The blue light hazard exposure dose response for the LED source ... 38
Figure 16 The blue light hazard for the exposure dose response for the compact fluorescent source ... 39
Figure 17 Dose response for the solar simulator lamp ... 40
Figure 18 The dose response curve for the fluorescent tube light. ... 41
Figure 19 The response to a collimated beam incident at a plane inclined for the following angles: 10 , 20 , 30 , 40 , 50 , 60 and 70 ... 42
Figure 20 The change in absorbance at different irradiances at different distances of 5 cm, 10 cm, 15 cm and 20 cm ... 43
Figure 21 The dark reaction of the blue light dosimeters at periods of zero hours, one day and seven days ... 45
viii
LIST OF TABLES
Table 1 Sunlight exposure data collection dates and times ... 18
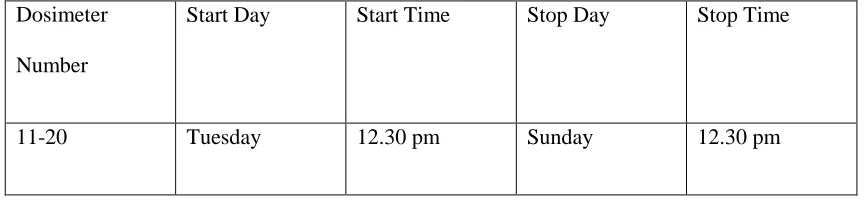
Table 2 Lamp exposure data collection dates and times ... 19
Table 3 Exposure periods for the dose response for six dosimeters to the LED light ... 21
Table 4 Exposure periods for the dose response for dosimeters 71-80 from the compact fluorescent lamp ... 24
Table 5 Exposure periods for the dose response from the solar simulator ... 26
Table 6 Exposure periods for the dose response for the fluorescent light ... 29
Table 7 Different angles with different dosimeters data collection ... 31
Table 8 The exposure times and irradiances for the dose rate independence ... 33
Table 9 Data collection with different temperatures ... 35
1
1.
CHAPTER ONE
1.1 Introduction
Sunlight, UV exposure and temperature are potential etiological factors that can cause
harmful diseases of the human eye especially affecting the retina. Blue light at relatively
high intensities with shorter wavelengths (400-500 nm) produces an adverse effect on the
healthy human eye. Diseases such as retinal injury (photoretinitis) are caused by either
extremely bright light on the eye for a short time or a less bright light on the eye for a
longer exposure period (Sliney, 2001). An action spectrum provides the relative
efficiency or the relative harmful effect of radiation at different wavelengths for a
particular biological influencing effect (Parisi et al., 2004). A better understanding of the
blue light environment is necessary in order to improve preventative measures aimed at
reducing the risk of eye damage. Previous research has shown that blue light can trigger
damage to the eye. The excessive ocular blue light exposure may contribute to age linked
macular degeneration (AMD) (Walker et al., 2012). In order to reduce the implications on
public health due to the blue light hazard, it is necessary to first quantify the amount of
blue light received by humans during normal daily activities. To decrease these problems,
a dosimeter is very helpful for quantifying blue light hazard effective exposures.
The discussion that follows will give a general overview of quantifying the properties of
a dosimeter responsive to blue light hazard effective wavelengths, followed by effects of
blue light hazard that can trigger a reaction in the human retina. A variety of factors to
2
examination of the methods currently used for measuring the blue light hazard. Specific
attention is given to the area of dosimetry as it is an effective tool that is used in the
measurement of UV radiation exposures, such as polysulphone and phenothiazine. A
potential dosimeter for measuring the blue light hazard effective wavelengths has been
proposed (Turnbull and Parisi, 2012).
This project will study whether the proposed blue light dosimeter has the properties
suitable for measuring ocular blue light hazard exposures, by testing the change in:
absorbance, dose response, influence of the angle of the receiving plane, reproducibility,
dark reaction, dose rate independence and temperature independence. Finally, this project
will contribute to the previous research by characterizing the properties and the
3
2.
CHAPTER TWO
2.1 Literature Review and Scope of Project
2.2 Electromagnetic Radiation and Eye Damage
2.2.1 Electromagnetic Radiation
Electromagnetic radiation presents both wave (oscillatory) and particle (photon)
characteristics (Taylor, 1989). The energy transmitted by a photon is inversely related to
its frequency; therefore, the shorter the wavelength the greater will be the energy
produced. The energy of a photon is absorbed by the atom or molecule with which it
collides. Photons with little energy will still carry sufficient energy to affect the rotation
of an atom or a molecule and so can create warming. The higher energy UV photons can
change the energy state of the electrons to make the atom electronically excited. Both
nucleic acid and proteins within the cells can absorb the energy of UV photons (Taylor,
4 2.3 Eye Damage
The eye has greater sensitivity to injury by some wavelengths than others (Taylor, 1989).
The high-energy radiation in the solar spectrum especially UV in sunlight is harmful to
the human eye. It is especially hazardous to the retina (Young, 1994). The health of the
eye is impacted on by UV radiation, heat and oxidation. For example, in the United
States, nearly 1 in 5 individuals suffer from eye damage caused by UV radiation before
the age of 75 years and nearly one-half of the population by the age of 84 (Young, 1994).
The effect of UV radiation can be injurious to the lens of the eye, as it can significantly
hasten its deterioration and can eventually culminate in visual impairment and blindness
(Young, 1994).
In New Zealand it has been found that the number of eye operations decreases with
latitude (Young, 1994). Eye operations are also more prevalent in coastal areas subjected
to bright sunshine than in inland areas (Young, 1994). The photons with the greatest
energy transmitted to the retina are the most dangerous to the eye. For instance, when the
photon energy is high (the blue/violet area of the visible spectrum and the UV), the
radiation can be harmful to the retina (Young, 1994). At wavelengths of UV radiation
between 320 and 400 nm the lens absorbs the radiation strongly. UV is injurious to the
lens cells, specifically those in the nucleus that have a very slow rate of repair (Gies &
Roy, 1988). Also, UV radiation affects the retina as approximately 1% of the UVA
radiation to the eye reaches the retina (Gies & Roy, 1988). Retinal disease (photoretinitis)
can be caused by either extremely bright light for a short exposure time or by a less bright
5
temperature are potential etiological factors that can produce harmful diseases of the eye
such as pterygium and droplet keratopathies (Sliney, 2001). When the cornea and lens
absorb higher wavelengths the retina is consequently exposed to visible light including
blue light (Fletcher et al., 2008). Blue light injuries can be sustained by both the retinal
pigment epithelium and choriocapillaris through generation of responsive oxygen species
and may be a factor in the pathogenesis of age related macular degeneration (AMD)
(Fletcher et al., 2008). The retina is more exposed to blue light at younger ages due to the
transmission of the lens (Fletcher et al., 2008). The Beaver Dam Eye Study demonstrated
that leisure time outdoors in the young adult life was correlated with the incidence of
early AMD (Fletcher et al., 2008).
The Chesapeake Bay Watermen Study obtained occupational exposure data over the
previous 20 years and discovered no association between UVA and UVB light with
AMD (Fletcher et al., 2008). However, the study did note an adverse relationship
between blue light and eye damage involving atrophy and scarring (Fletcher et al., 2008).
Fletcher et al (2008) also discovered that the combination of blue light exposure and low
plasma concentrations of antioxidants was also related with the early stages of AMD and
also that blue light exposure in middle age could be more harmful than at younger ages.
Additionally, UV radiation between 180-400 nm can cause several diseases of the eye
including erythema, carcinogenesis, corneal photokeratities and lens cataracts (Walker et
al., 2012). The human cornea transmits radiant energy only at 295 nm and above (and
thus not in the UVC range). Indeed, all UVC (100- 280 nm) radiations are absorbed by
the human cornea which absorbs radiation (Sliney, 2012). Also, blue light triggers retinal
6
2012). Several researchers have reported that the retinal-pigmented epithelium (RPE), a
cellular layer of the retina responsible for its nourishment, is also injured or destroyed by
excessive blue light exposure (Walker et al., 2012). Each blue light exposure contributes
to the cumulative creation of cytotoxic photoproducts. Individuals who are chronically
exposed to blue light will be at greater risk of contracting AMD (Walker et al., 2012).
Moreover, lipofuscin (cellular debris) accumulates in the retinal pigments epithelium
(RPE) (Roberts, 2011). Blue light waves could be especially toxic to those who are prone
to macular problems due to several factors including genetics, nutrition, environment,
health habits and ageing (Roberts, 2011).
When a photon hits a photoreceptor cell in the retina, it should not be responsive to light
until it has recovered from the blue light waves. It has been shown in rodents that
absorption of blue light can cause the photoreceptor to detect light before it is ready
(Roberts, 2011). This significantly raises the potential for oxidative injury, which leads to
a build-up of lipofuscin in the (RPE) layer (Roberts, 2011). Finally, if there are high
quantities of blue light absorbed by lipofuscin, it can become phototoxic leading to
oxidative injury to the RPE and more cell death (Roberts, 2011). Therefore, the blue light
can cause several diseases to the eye that can affect the retina, RPE and AMD.
2.4 Action Spectrum
The relative effectiveness of different wavelengths for producing a particular biologic
7
2005). Each action spectrum is generally normalized at the wavelength with the highest
response, which is given a unity value. For a particular action spectrum with a
biologically effective irradiance EBE, an action spectrum provides the relative
effectiveness or relative damaging effect of UV for a particular biological process (Parisi
et al., 2004):
EBE = (Equation 1)
Where A (λ) is the action spectrum, S (λ) is the spectral irradiance in Wm-2 nm-1 and λ is
the wavelength increment.
The action spectrum for erythema in humans has been used commonly for measuring the
UV effect on human skin. The weighting of this action spectrum is normalized to unity
298 nm and shorter wavelengths and the biological effectiveness decreases by
approximately a factor of 1000 at 320 nm (CIE, 1987).
The meaning of the action spectrum is the amount of irradiation at a given wavelength or
band of wavelengths that can lead to damage (Taylor, 1989). It is the threshold for a
specific effect and is particular to specific tissues (Taylor, 1989). The action spectrum for
the human cornea is mostly related to that of subhuman primates, while the human cornea
is more sensitive to UV radiation than is the cornea of animals (Taylor, 1989). To
determine an action spectrum scientists employ various methods to detect changes in the
retina for specific wavelengths (van Norren & Gorgels, 2011). Biologically effective
irradiances are measured in milliWatt per square centimetre (mW cm-2). The exposures of
UV radiation given by irradiance over a time period have a radiant exposure given in
8
Figure 1 Blue light hazard action spectrum (ICNIRP, 1997)
2.5 Blue Light Hazard
Photochemical retinal injury, known as photoretinitis, is triggered by light mainly in the
wavelength region of 400-500 nm. The light in this region appears blue to the eye and so
is called blue light (Okuno et al., 2010). The shorter wavelengths pose the greatest hazard
because they inversely contain more energy. Exposure to these wavelengths has been
called the blue light hazard because these wavelengths appear blue to the human eye and
are hazardous (Smith et al., 2005). Blue light is found to cause a reaction in the eye and 0
0.2 0.4 0.6 0.8 1 1.2
B
lu
e
Li
gh
t
H
azar
d
9
has been characterized by the International Commission on Non- Ionising Radiation
Protection (ICNIRP) as the blue light hazard (Figure 1). The Y- axis has no units as it is
displaying normalized values. Exposure to blue light has been found to affect
photoreceptor and retinal pigment epithelium cell function, as well as inducing both
photochemical harm and cell death. This blue light photochemical injury to the human
retina is termed photoretinitis. The blue light hazard action spectrum is appropriate for
broad- band non-laser light sources (ICNIRP, 1997). The hazard of blue light is usually
measured by the effective blue light radiance, which is found by weighting the spectral
radiance of the light against the blue light hazard action spectrum and integrating this in
the wavelength range between 305-700 nm (Okuno et al., 2010). The crystalline lens of
the young and healthy human eye has a high level of transparency for optic radiation of
short wavelengths ranging between 400-500 nm (SCENIHR, 2012). Also, the blue light
hazard action spectrum has been weighted with a sample global solar spectrum. This
shows the minor consequences that solar radiation wavelengths below 380 nm and above
560 nm have as compared to the blue light hazard (Turnbull & Parisi, 2012).
Geometrical factors are important in selective sunlight exposure to specific parts of the
eye such as the lens, cornea and retina. Many studies have shown that sunlight exposure
to local areas of the cornea, lens and retina varies greatly in different environments
(Sliney, 2001). Due to the varying amounts of radiation in different environments, it is
necessary to have a way to measure these different levels. Dosimetry provides a means to
10
2.6 Measurement Techniques
The science of the dosimeter is based on knowledge of radiation measurement. There are
many reasons for measuring UV and visible radiation. Firstly, measurement of this
radiation is necessary to provide safe radiation exposure of patients, animals, cells and
plants. Secondly, measurement of radiation is also necessary to enable the effects of
irradiations provided in diverse laboratory situations to be published and compared
(Diffey, 2002).
The radiometer is a broad-band instrument that is used as a monitor to provide reference
measurements, irradiance measurements and exposure measurements over specific
wavebands (Diffey, 2002). The UVB detector by International Light (IL) responds to
wavelengths of approximately 290-310 nm (Roy et al., 1995). The International Light
meter can responds to UVB radiation; however, it also has a smaller response to UVA
radiation (Roy et al., 1995). For example, in Melbourne the Solar Light UV biometers
(model 501B) have been installed and are also located in the other main Australian
capitals (Roy et al., 1995). The IL actinic detectors and the Solar Light UV biometers
have important spectral responses related to the erythemal action spectrum (Roy et al.,
1995). A miniature version of the Sunburn Ultraviolet Meter is a solid-state device that
measures 35 mm in diameter by 13 mm in height and uses a magnesium tungsten
phosphor. It emits visible light when exposed to UV (Rosenthal el al., 1985). This visible
light is converted by a photoelectric diode to an electrical current, which is integrated by
11
Spectroradiometry is the technique for measuring the spectral power distribution in
narrow waveband increments (Diffey, 2002). Spectroradiometers have a significant role
in measuring radiation for the evaluation of biological hazards (Wengraitis et al., 1998).
These instruments can measure the spectral irradiance at every wavelength for their
sensitivity range (Wengraitis et al., 1998). Diffusers or integrating spheres are used as the
input optics for measurement of spectral irradiance, particularly for extended sources
such as linear arrays of fluorescent lamps or day-light. This is to avoid direct irradiation
of the entrance slit (Diffey, 2002). Monochromators particularly double monochromators
are used mainly because of better stray radiation rejection characteristics (Diffey, 2002).
The gratings of the monochromator are moved with a stepper motor to allow scanning of
the spectrum.
There are two significant spectroradiometer devices: the Brewer spectroradiometer and
the Bentham spectroradiometer. The Brewer MKIII and the Bentham DTM300 are types
of monochromator UV spectroradiometers that can be used to measure both the global
and the direct solar spectral irradiance and from data analysis the aerosol optical depth
(Kazadzis et al., 2005). The Brewer spectroradiometer is a double monochromator
instrument involving two identical holographic gratings (3600 lines/mm) (Kazadzis et al.,
2005). The instrument has a wavelength range of 287.5 - 366.0 nm. It also has the
necessary properties to measure the direct sun spectral irradiances (Kazadzis et al., 2005).
The Bentham DTM300 contains a double monochromator with a 300 mm focal length
and there are two sets of holographic gratings. The spectral resolution is approximately
0.48 nm (Kazadzis et al., 2005). The Bentham spectroradiometers can be set up to
12
Another type of spectroradiometer is based on a CCD array. A CCD array has been used
instead of the holographic gratings and shown to be very constant without variations in
sensitivity (at 25o C) in 10 years of operation (Forgan & McGlynn, 2010). The
characteristics of CCDs have to be determined before effective measurements can be
attempted (Forgan & McGlynn, 2010). The technology of CCD arrays can be used to
respond to the ageing of both Dobson spectrophotometers for monitoring ozone and
improving a more compact device for monitoring solar UV (Forgan & McGlynn, 2010).
Chemical dosimeters in the ultraviolet waveband can be employed to measure erythemal
UV exposures using polysulphone dosimeters (Davis et al., 1976). These polysulphone
dosimeters have the necessary properties to be used extensively in research to measure
the erythemal UV exposure (Davis et al., 1976). The potential of the photochemical
polysulphone (PS) with Naladixic acid (NDA) has been considered as a dosimeter and
has been found to have a reaction that extends into the UVA (Davis et al., 1976).
Polysulphone is used as a 40-micron polymer film that undergoes photodegradation in the
presence of UV resulting in an increase in optical absorbance over a range of
wavelengths shorter than 330 nm. Sheets of the polymer film are cut into 2.0 by 2.0 cm
squares and mounted on cardboard badges with windows measuring approximately 15
mm in diameter (Rosenthal el al., 1985). Forty micron polysulphone films have been used
as a UV dosimeter to measure UVB exposure at seven anatomical sites of volunteers
undertaking recreational events (Roy et al., 1995). This film has an advantage in its ease
of preparation for use for both analysis and calibration (Roy et al., 1995). The film used
in dosimeters of approximately 3 cm x 3 cm has been employed to monitor personal UV
13
There are different types of photoactive chemical dosimeters that have been developed
for use in the measurement of UV radiation exposures including polyphenylene oxide,
phenothiazine, 8- methoxypsoralen and nalidixic acid (Turnbull & Parisi, 2012).
Polysulphone has been shown to have a spectral sensitivity that is high in the UVB
region; however, its response above approximately 340 nm is negligible, whereas
phenothiazine has been shown to respond to both UVB and UVA wavelengths (Jia et al.,
2010). Polysulphone does not react to the blue light but the phenothiazine does react to
the blue light. The optical absorbance changes as a result of exposure as measured with a
spectrophotometer.
The polysulphone and phenothiazine solution is cast into thin film form of 40 µm
thickness. The polysulphone acts like a polymer substrate to prevent the film from being
brittle and useable as a thin film. The solution is cast on a glass slab that is optically flat
to 1 micron (Turnbull & Parisi, 2012). The technique used for calibration of the
dosimeter for the measurement of UVA is to expose a series of dosimeters to different
periods of solar UV exposure on a horizontal plane while concurrently measuring the
UVA exposure with a calibrated meter (Jia et al., 2010).
These polysulphone and phenothiazine dosimeters are very sensitive to both UVA and
UVB and blue light wavebands. In order to create a dosimeter that responds to blue light
hazard wavelengths only, a film of the filter Llumar is used to remove the UVA and UVB
wavelengths. The polysulphone and phenothiazine dosimeters alter in optical absorbance
(ΔA) as a result of exposure to blue light radiation. The maximum ΔA occurs at 437 nm
(Turnbull & Parisi, 2012). This previous research has not characterised the properties of
14
previous research will be extended to quantify the properties for use as a blue light hazard
dosimeter.
2.7 Research Project
2.7.1 Research Hypothesis
The hypothesis of this research is that a dosimeter based on polysulphone and
phenothiazine has the necessary properties to measure the blue light hazard exposure.
2.7.2 Research Objectives
The purpose of this research is to investigate whether a proposed blue light dosimeter has
the characteristics suitable for measuring blue light hazard exposures.
The objectives of the research are:
To evaluate the combined polysulphone and phenothiazine dosimeters for
measuring the blue light hazard exposure.
To characterize the properties of polysulphone and phenothiazine dosimeters. The
properties being measured are change in absorbance, dose response, influence of the
angle of the receiving plane, dark reaction, reproducibility, dose rate independence
15
3.
CHAPTER THREE
3.1 Methodology
3.1.1 Equipment and Materials:
Spectrophotometer: model UV1604, Shimadzu & Co, Kyoto, Japan.
Spectroradiometer: model DMc150, Bentham instruments, Ltd., Reading, UK.
That has been previously calibrated to a 150 W lamp with calibration traceable to
the National Physical Laboratory, UK.
Light sources: Sunlight, Fluorescent lamps for lighting, Compact Fluorescent
lamp (15 W, 5000 K), LED light and Solar simulator Solar simulator (model 15S
solar UV simulator, Solar Light Co., Philadelphia, USA).
Materials for fabricating dosimeters: Phenothiazine, Polysulphone & Llumar.
3.1.2 Dosimeters
Chemical dosimeters are an effective and less costly means of quantifying an individual’s
level of non-ionizing radiation exposure than electronic dosimeters. Numerous
photoactive chemical dosimeters have been developed for use in the measurement of UV
radiation exposures such as, polysulphone, phenothiazine, polyphenylene oxide, 8-
16
authors fabricated dosimeters from 40 µm thick film that has phenothiazine as the
chromophore. Phenothiazine cannot be cast into a thin film on its own, as it is brittle and
not usable as a thin film. Consequently it was mixed with either polysulphone or poly
vinyl chloride to allow casting in thin film form (Turnbull and Parisi, 2012). The thin
film was cut into pieces of approximately 20 mm x 20 mm and taped onto holders that
are 30 mm x 30 mm in size and have a hole of 12 mm x 16 mm over which the thin film
is taped. Phenothiazine also responds to the UVA and UVB wavelengths (Parisi et al.,
2005). The majority of the irradiances at these wavelengths are removed with the use of
Llumar film (Supplier, MEP Films) that is taped over the dosimeters.
3.2 Blue Light Hazard Exposure
To determine the dose response a series of dosimeters will be exposed on a horizontal
plane to light from each of sunlight, a fluorescent tube, a compact fluorescent light and a
LED light. The spectral irradiance at the plane of the dosimeters will be measured with an
UV/visible spectroradiometer (model DMc150, Bentham instruments, Ltd., Reading,
UK). This will be done at set intervals to allow for any variation. The blue light hazard
effective exposures BL will be calculated (equation 2) for each of the light sources by
multiplying the spectral irradiances with the action spectrum (ICNIRP, 1997) as follows:
Δ (Equation 2)
where T is the time period in seconds, S () is the spectrum; A () is the action spectrum
17
set exposures. The A will be measured at four sites over each dosimeter, calculating the
average of the four measurements and the standard deviation. For this research the
dosimeters will be measured 24 hours post-exposure to take into account the effect of the
dark reaction (Turnbull & Parisi, 2012). A calibration curve for each light source will
then be calculated. This calibration curve is necessary to determine the blue light hazard
exposure for a given change in absorbance.
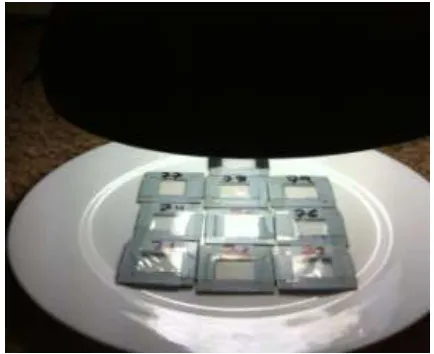
3.3 Making Dosimeters
The first step of the methodology involved making dosimeters from different films that included
polysulphone, phenothiazine and Llumar films. Firstly, the polysulphone was mixed with the
phenothiazine in chloroform and cast in thin film. This film was then cut into pieces of
approximately 2 cm × 2 cm. This film was attached with tape over a holder with an opening of
1.2 cm × 1.6 cm as shown in Figure 2. Llumar was taped over the polysulphone and
[image:26.612.204.411.533.651.2]phenothiazine films to act as a filter in order to block the UV wavelengths.
18 3.4 Change in Absorbance
This experiment investigated the determination of the wavelength at which the maximum change
in absorbance ( ) occurs due to blue light exposure. Firstly, a batch of 10 dosimeters was
measured for their pre exposure transmission from 300 nm to 600 nm in 1 nm increments in a
spectrophotometer (model UV1604, Shimadzu Co, Kyoto, Japan). These dosimeters were then
exposed on a horizontal plane to 3 hours of sunshine in order to provide a change in the
dosimeter. The details of the exposure period are given in Table 1. The dosimeters were then
measured for their post exposure transmission from 300 nm to 600 nm. Finally, all the data were
collected and analysed to determine the wavelength with the maximum change in absorbance.
Table 1 Sunlight exposure data collection dates and times
Dosimeter
Number
Date Start Time Stop Time Cloud
Conditions
1-10 18/11/2012 10.24 am 1.24 pm Nil
Another 10 dosimeters were measured for their pre-exposure transmission from 300 nm to 600
nm. They were then exposed to 5 days of light at 10 cm from a compact fluorescent lamp (15 W,
5000 K) as shown in Table 2 in order to investigate the influence of a different spectrum.
Subsequently, these dosimeters were also measured for their post exposure transmission from 300
nm to 600 nm in a spectrophotometer. Thus, for each light source, the average pre exposure
19
maximum change occurred. The analysis found that the maximum change in absorbance (λΔαmax)
[image:28.612.82.514.157.258.2]that occurred was approximately at 420 nm.
Table 2 Lamp exposure data collection dates and times
Dosimeter
Number
Start Day Start Time Stop Day Stop Time
11-20 Tuesday 12.30 pm Sunday 12.30 pm
3.5 Dose response
From the previous section, the wavelength at which the maximum change in absorbance occurred
was 420 nm. The spectrophotometer was now set to work in photometric mode at λΔαmax with the
dosimeter holder in place and auto zeroed for each series of measurements. Thirty eight
dosimeters were measured for their pre-exposure absorbance at λΔαmax at four sites over each
dosimeter. To determine the dose response, the dosimeters in these series were exposed on a
horizontal plane to a solar simulator, and at 10 cm from the fluorescent tube, the compact
fluorescent light and the LED light. The setup for the LED light is shown in Figure 3. The
spectral irradiance at the plane of the dosimeters from each of the lamp sources was measured
with the UV/visible spectroradiometer (model DMc150, Bentham instruments, Ltd, Reading, UK)
from 300 nm to 600 nm. Figures 4, 6, 7 and 9 show the spectral irradiances for the four light
20
Six dosimeters were exposed for up to 6 days of light from the LED light at 10 cm for exposure
periods of 46, 54, 69, 77, 92 and 100 hours (Table 3). These dosimeters were measured for their
post exposure absorbance at λΔαmax. Thus, for each of the exposure intervals, the blue light hazard
effective exposure was calculated and a calibration curve was plotted of the exposure versus the
[image:29.612.192.421.241.479.2]resulting change in absorbance.
21
Figure 4 the spectral irradiance for the LED light
Table 3 Exposure periods for the dose response for six dosimeters to the LED light
Dosimeter Number Start Day Start Time Exposure Time (hours)
42 10/08/2013 1.00 pm 46 h
41 11/08/2013 11.00 pm 54 h
40 12/08/2013 2.00 pm 69 h
39 13/08/2013 1.00 pm 77 h
38 14/08/2013 4.00 am 92 h
37 15/08/2013 12.30 pm 100 h
0 100 200 300 400 500 600
300 331 361 392 423 451 482 512 543 573
[image:30.612.95.519.452.707.2]22
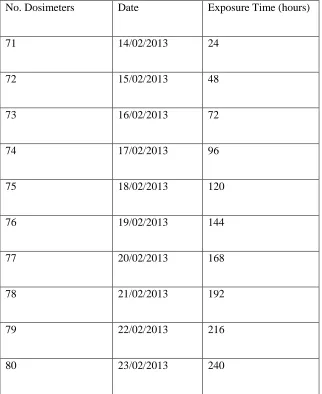
The second type of source light investigated for a dose response was a compact fluorescent light.
Ten dosimeters were measured for their pre exposure absorbance at 420 nm at four sites (Table
4). These dosimeters were then exposed to 10 days of light at 10 cm from a compact fluorescent
lamp (15 W, 5000 K). Each dosimeter was exposed to the light throughout the day with the
exposure times given in Table 4 and then the post-exposure absorbance was measured at 420 nm.
[image:31.612.198.415.322.499.2]This data were analysed to provide the dose response.
23
Figure 6 The spectral irradiance for a compact fluorescent lamp
0 200 400 600 800 1000 1200
300 331 361 392 423 451 482 512 543 573
Sp
ect
ru
m Ir
ra
d
ia
nce
(m
Wm
-²
nm
-¹)
24
Table 4 Exposure periods for the dose response for dosimeters 71-80 from the compact fluorescent lamp
No. Dosimeters Date Exposure Time (hours)
71 14/02/2013 24
72 15/02/2013 48
73 16/02/2013 72
74 17/02/2013 96
75 18/02/2013 120
76 19/02/2013 144
77 20/02/2013 168
78 21/02/2013 192
79 22/02/2013 216
80 23/02/2013 240
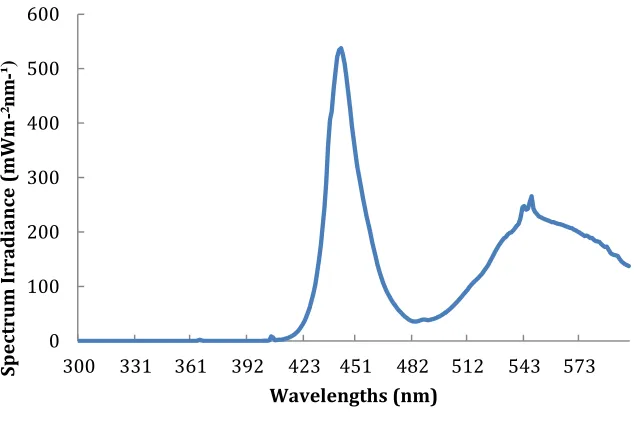
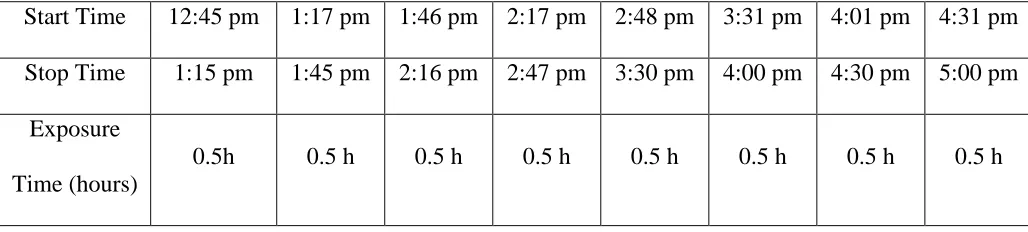
The third type of light source was a solar simulator (model 15S solar UV simulator, Solar Light
Co., PA, USA). Due to the cloudy weather, this equivalent source to sunlight was used to expose
the dosimeters. One dosimeter was measured for the pre-exposure absorbance at 420 nm at four
dosimeter sites. Only one dosimeter was exposed due to the small size of the solar simulator
beam. This dosimeter was then exposed to the solar simulator at 10 cm. This dosimeter was
25
the dosimeter was measured for the post exposure absorbance (Table 5). All the data were then
collected to calculate the average and the difference between the pre and post exposure
[image:34.612.152.467.192.398.2]absorbance. A calibration curve for this light source was then determined.
Figure 7 The spectral irradiance for the solar simulator
0 500 1000 1500 2000 2500 3000 3500
300 331 361 392 423 451 482 512 543 573
Sp
ect
ru
m Ir
ra
d
ia
nce
(m
Wm
-²
nm
-¹)
26
Table 5 Exposure periods for the dose response from the solar simulator
Start Time 12:45 pm 1:17 pm 1:46 pm 2:17 pm 2:48 pm 3:31 pm 4:01 pm 4:31 pm
Stop Time 1:15 pm 1:45 pm 2:16 pm 2:47 pm 3:30 pm 4:00 pm 4:30 pm 5:00 pm
Exposure
Time (hours)
27
The last light source for the dose response was a fluorescent tube (40 Watt). In this part, ten
dosimeters were measured for their pre-exposure absorbance and they were exposed for a range
of times to the fluorescent tube at 10 cm during ten days (Table 6). Each day, just one dosimeter
was taken so the dosimeters were exposed for a range of times from one to ten days. After ten
days, all dosimeters were measured for the post exposure absorbance. After all the measurements,
the averages and the change in absorbance were calculated to determine a calibration curve.
28
Figure 9 The spectral irradiance for the fluorescent light
0 200 400 600 800 1000 1200
300 331 361 392 423 451 482 512 543 573
Sp
ect
ru
m Ir
ra
d
ia
nce
(m
Wm
-²
nm
-¹)
29
Table 6 Exposure periods for the dose response for the fluorescent light
Dosimeter Number Date Exposure Time (hours)
91 2/08/2013 24
92 3/08/2013 48
93 4/08/2013 72
94 5/08/2013 96
95 6/08/2013 120
96 7/08/2013 144
97 8/08/2013 168
98 9/08/2013 192
99 10/08/2013 216
30
3.6 Influence of the Angle of the Receiving Plane
The exposures in the previous section with the solar simulator were repeated for planes inclined
to the beam. Firstly, seven dosimeters were measured for their pre exposure absorbance at 420
nm. By using a solar simulator being a controlled source, all dosimeters were exposed to the
same amount of radiation during two hours at 10 cm at a range of angles normal to the incident
irradiance. These different angles were 10 , 20 , 30 , 40 , 50 , 60 and 70 . All dosimeters were
then measured for the post exposure absorbance. Thus, the change in absorbance of these
[image:39.612.185.479.341.472.2]dosimeters at a given angle was 30ormalized to 0 incidence.
31
Table 7 Different angles with different dosimeters data collection
Dosimeter Number Angles Start time Stop time
82 10º 9:30 am 11:30 am
83 20º 11:30 am 1:30 pm
84 30º 1:30 pm 3:30 pm
85 40º 3:30 pm 5:30 pm
86 50º 11:00 am 1:00 pm
87 60º 1:00 pm 3:00 pm
88 70º 3:00 pm 5:00 pm
3.7 Dose Rate Independence
This experiment was conducted to test the dose rate independence. Firstly, approximately
seventeen dosimeters were measured for their pre exposure absorbance in a spectrophotometer at
four sites over each dosimeter. These dosimeters were placed at four different distances of 5 cm,
10 cm, 15 cm and 20 cm from a light source. The light source was the fluorescent lamp. All the
dosimeters at different distances were exposed for different times (Table 8), so they received the
same exposure. The spectral irradiance at each distance was measured with the spectroradiometer
and is shown in Figure 12. These irradiances were used to determine the exposure time to
32
absorbance and all the data were analysed to calculate the average and standard deviation of the
[image:41.612.129.487.130.298.2]ΔA and the dose rate independence.
33
Figure 12 The spectral irradiances of the fluorescent lamp at distances of 5 cm, 10 cm, 15 cm and 20 cm.
Table 8 The exposure times and irradiances for the dose rate independence
Distances (cm) Exposure Time (hours) Irradiances (W/m2)
5 31.1 14.13
10 48 9.17
15 64.7 6.80
20 89.4 4.92
0 200 400 600 800 1000 1200 1400 1600 1800
300 331 361 392 423 451 482 512 543 573
[image:42.612.81.480.450.577.2]34 3.8 Reproducibility
This section of the research investigated the reproducibility of the dosimeter. Fifteen dosimeters
were exposed on a horizontal plane to an artificial light source for an exposure that produces a
measurable ΔΑ. Firstly, fifteen dosimeters were measured for their pre exposure absorbance at
λΔαmax at four sites over each dosimeter in the spectrophotometer. They were then exposed to the
sunlight for four hours. The dosimeters were then measured for the post exposure absorbance at
λΔαmax. All data were analysed to find the average and standard error in order to determine the
reproducibility.
3.8.1 Dark reaction
Fifteen dosimeters were kept from the previous section in a bag in a cupboard for 24 hours of
darkness. These dosimeters were then measured for the post exposure absorbance in a
spectrophotometer at four sites over each dosimeter. Data were collected to find the average for
the pre and the post exposure. Following this, the fifteen dosimeters were kept in a dark place for
seven days and again measured for the post exposure absorbance. All these results were analysed:
(0 hours, 24 hours and 7 days) to determine the dark reaction. All these measurements were
analysed to determine the dark reaction that occurs post exposure.
35 3.9 Temperature Independence:
Fifteen dosimeters were measured for their pre exposure absorbance prior to exposure at
temperatures between 20 and 40 C. Five dosimeters were exposed on a horizontal plane to the
fluorescent lamp at 10 cm at each of three temperatures. Three groups of the dosimeters had their
temperature measured with a thermometer. The different temperatures were obtained with a hair
dryer blowing hot air over the dosimeters. Firstly, before starting this experiment, the
temperature was measured after half an hour for each of the three thermometers. The group of
dosimeters was exposed to the light source with measurements of the temperature taken at
different times (Table 9). Finally, the fifteen dosimeters were measured for the post exposure
absorbance at four sites for each dosimeter. The average and standard deviation were calculated
[image:44.612.85.513.452.640.2]to find the effect of temperature.
Table 9 Data collection with different temperatures
Time Temperature 1 Temperature 2 Temperature 3
0.5 h 22 25 35
3 h 23 26 36
1 day 23.5 28 38
36
4.
CHAPTER FOUR
4.1 Results
4.1.1 Change in Absorbance
The pre exposure spectral transmission averaged over ten dosimeters and the average post
exposure spectral transmission after exposure to sunlight are shown in Figure 13. The maximum
[image:45.612.138.463.377.626.2]change in absorbance between the pre and post exposure values occurs at approximately 420 nm
Figure 13 The pre exposure spectral transmission averaged over ten dosimeters (top curve) and the average post exposure (bottom curve) spectral transmission following
exposure to sunlight. 0 10 20 30 40 50 60 70 80 90 100
300 350 400 450 500 550 600
37
Figure 14 shows the pre-exposure spectral transmission averaged for ten dosimeters and the
average post exposure transmission after exposure to a compact fluorescent lamp. The maximum
[image:46.612.103.479.199.365.2]change is at approximately 420 nm.
Figure 14 The spectral transmission averaged over twenty dosimeters for pre (top curve) and post exposure (bottom curve) to a lamp
0 5 10 15 20 25 30 35 40 45
300 350 400 450 500 550 600
Tr
an
sm
issi
o
n
(%
)
38
4.1.2 Dose Response
Figure 15 shows the calibration curve for the LED source. The relationship between the blue light
[image:47.612.99.428.203.391.2]exposure and the change in absorbance provides the dose response.
Figure 15 The blue light hazard exposure dose response for the LED source 1000 1500 2000 2500 3000 3500 4000 4500 5000
0 0.02 0.04 0.06 0.08
B lu e li gh t e xp o su re ( kJ /m ² )
39
Figure 16 shows the calibrations curve for a compact fluorescent light source for several days.
The dosimeters were calibrated by comparing the change in optical absorbance of the dosimeter
with exposures to measure the dose response. All data from the spectral measurements were
[image:48.612.105.451.260.511.2]acquired with the scanning spectroradiometer.
Figure 16 The blue light hazard for the exposure dose response for the compact fluorescent source 1000 11000 21000 31000 41000 51000 61000 71000 81000
0 0.02 0.04 0.06 0.08 0.1 0.12 0.14
40
Figure 17 shows the relationship between the blue light hazard exposure and the AMAX 420 for
the solar simulator. The data positions are the averages of the measured changes in absorbency
measured at (ΔAmax 420 nm) transversely at four points on each dosimeter. The error bars
[image:49.612.95.448.239.466.2]illustrate the standard deviation of the four measurements.
Figure 17 Dose response for the solar simulator lamp y = 106x2 + 647.x
R² = 0.92
0 500 1000 1500 2000 2500
0 0.02 0.04 0.06 0.08 0.1 0.12 0.14
41
Figure 18 shows the calibration curve for the fluorescent tube. The error bars show the standard
[image:50.612.103.442.212.412.2]deviation for each point.
Figure 18 The dose response curve for the fluorescent tube light. y = -2E+06x2 + 24674x
R² = 0.96
0 10000 20000 30000 40000 50000 60000 70000 80000 90000
0 0.02 0.04 0.06 0.08 0.1 0.12 0.14
B lu e li gh t e xp o su re ( kJ /m ²)
42
4.1.3 Influence of the Angle of the Receiving Plane
Figure 19 shows the contrast of cosine response of the blue light dosimeter to the cosine curve.
The influence of the angle of the receiving plane of the blue light hazard dosimeter (VISBL)
compared with the cosine function for angles from 10º to 70º and the error bars describe the
[image:51.612.99.442.288.487.2]average for post exposure absorbance measurements.
Figure 19 The response to a collimated beam incident at a plane inclined for the following angles: 10 , 20 , 30 , 40 , 50 , 60 and 70
0 0.2 0.4 0.6 0.8 1 1.2
0 20 40 60 80
N
o
rm
al
ised
r
e
sp
o
n
se
43
4.1.4 Dose Rate Independence
Figure 20 shows the change in absorbance for the same total exposure at different irradiances. It
also illustrates the relationship between the change in absorbance and the blue light irradiance;
the y-axis error bars represent the standard deviation in ΔA of the absorbance data due to the
irradiance. There was no significant change for irradiances between 5 W/m² and 7 W/m². The
response of the dosimeters for blue light irradiance showed a small increasing trend from 10
W/m² to 15 W/m², however the averages are still within the error bars of those for the lower
[image:52.612.137.515.365.555.2]irradiances.
Figure 20 The change in absorbance at different irradiances at different distances of 5 cm, 10 cm, 15 cm and 20 cm
0 0.01 0.02 0.03 0.04 0.05 0.06 0.07 0.08 0.09 0.1
0 2 4 6 8 10 12 14 16
Δ Am a x 4 2 0
44
4.1.5 Dark Reaction
The dark reaction of both polysulphone and phenothiazine films is shown in Table 10 for the
[image:53.612.87.550.255.356.2]change in absorbance after periods of zero hour, one day and seven days after exposure.
Table 10 Dark reaction (zero hours, one day and seven days)
Time after exposure 0 hours 1 day 7 days
Average 0.056 0.058 0.067
Standard Deviation 0.041 0.048 0.049
The dark reaction of the blue light dosimeter was measured at 420 nm for different periods of
45
Figure 21 The dark reaction of the blue light dosimeters at periods of zero hours, one day and seven days
4.1.5.1 Reproducibility
For the reproducibility tests, fifteen dosimeters were exposed to the sun light over one day. The
results show that the average in the change in absorbance was 0.056 with a standard error of
0.005.
0 0.02 0.04 0.06 0.08 0.1 0.12 0.14 0.16 0.18 0.2
0 1 2 3 4 5 6 7 8
Δ
Am
a
x
4
2
0
46
4.1.6 Temperature Independence
Figure 22 shows the change in absorbance calculated for the blue light hazard dosimeters exposed
at different temperatures for four different time periods and between 23 ºC and 37 ºC no response
[image:55.612.94.500.212.468.2]was found between the temperature and the response.
Figure 22 The change in absorbance for temperatures between 20 and 40 with the average for each dosimeter
0 0.01 0.02 0.03 0.04 0.05
20 22 24 26 28 30 32 34 36 38
Δ
A
m
ax
420
47
5.
CHAPTER FIVE
5.1 Discussion
5.1.1 Change in Absorbance
The spectral transmission of the blue light dosimeter was measured pre exposure and post
exposure from 300 nm to 600 nm in a spectrophotometer to both sun light and a compact
fluorescent lamp. As can be seen from Figures 13 and 14, from 300 nm to 600 nm, the
maximum change in optical transmission after an exposure was approximately at 420 nm.
Consequently, 420 nm was chosen as wavelength to determine the calibration of the
VISBL dosimeter. That was comparable to the maximum change in optical transmission
previously found at about 437 nm (Turnbull and Parisi, 2012).
5.1.2 Dose Response
All dose response calibration curves were calculated by exposing the films on a
horizontal plane using three films of polysulphone, phenothiazine and Llumar to make
the dosimeter. The dosimeters for the dose response were exposed to different sources of
light including the solar simulator, a fluorescent tube, a compact fluorescent light and a
LED light. Each source had different exposure periods to calculate the change in
absorbance and determine the dose response.
First, dosimeters were exposed to a LED light for different periods to determine the
48
of the dosimeters due to the LED light. Also, the change in absorbance shows increasing
response with increasing exposure of the dosimeters from 0.04 to 0.07.
The second type of light source was a compact fluorescent light. The dosimeters were
exposed to this light at 10 cm during ten days to provide a dose response. As shown in
Figure 16, there is a response of the dosimeter to the light from the compact fluorescent
lamp. However, there is a reasonable scatter of the values. Also, there is not much
increasing response between the change in absorbance and the blue light exposure. This
may be due to the need to have a more uniform coverage of the dosimeters by this
compact fluorescent light.
The third type of light source was a solar simulator to provide a dose response. For eight
times, at each half hour interval the dosimeter was measured for the post exposure
absorbance to determine the dose response. Figure 17 shows the relationship between the
change in absorbance and the blue light exposure through an equation that goes through
the origin to describe the relationship. The error bars illustrate the standard deviation for
each point.
The last light source for the dose response was a fluorescent tube. The period of
exposure for the dosimeters was ten days to measure the dose response calibration curve.
Figure 18 shows that the change in absorbance is increasing from 0.03 to 0.12. In
summary, the blue light hazard dosimeters have been measured for their dose response to
49
5.1.3 Influence of the Angle of the Receiving Plane
The dosimeter was tested for the cosine response with a solar simulator. This dosimeter
was exposed at different angles from the normal plane to the incident irradiance from 10º
to 70º degrees. As can be seen from Figure 19, the error bars are the standard deviation of
the statistics for all points. The change in absorbance of the dosimeter at a given angle
was normalized so that it could be compared with the cosine curve. The normalized
response of the dosimeter was predominantly within the error bars of the cosine curve for
the range up to 70º. The variation between the influence of the angle of the receiving
plane of the dosimeter and the theoretical response was approximately 0.2 or less. In
comparison, Jia et al. (2010) found the difference between the cosine response of the
dosimeter and the theoretical response was less than 0.1.
5.1.4 Dose Rate Independence
The dose rate independence of blue light irradiance refers to the rate of change of the
absorbance of the dosimeter. For dose rate independence tests, the dosimeters were
exposed to the fluorescent tube for a range of times at different distances of 5 cm, 10 cm,
15 cm and 20 cm during four days. As indicated in Figure 20, the VISBL dosimeter has a
consistent ΔA for the irradiance range within which it will be used of 5 W/m² and 7
W/m². The observed change in response between 10 W/m² and 15 W/m² is within the
50
5.1.5 Dark reaction
Dark reaction showed the change in absorbance for the three different time periods
measured. The dosimeter was returned to the light free environment and removed to be
measured again after 24 hours following the initial removal from the irradiance and
finally measured again after seven days. Table 10 shows that the average change in
absorbance was from 0.056 to 0.058 after twenty four hours with an increase to 0.067
after a week. In comparison the dark reaction had the average change in absorbance of
-7.0 % and -11.3 % after 24 hours and 1 week, respectively (Turnbull & Parisi, 2012).
Also, Davis et al. (1976) found that polysulphone had a dark reaction of 4% after 24
hours and 5% after one week. Consequently, the dark reaction was taken into account
during the field use of the dosimeter by measuring the post exposure absorbance of the
VISBL dosimeters after a consistent time period following exposure.
5.1.5.1 Reproducibility
For the reproducibility tests, dosimeters were situated on a horizontal plane and exposed
to the sun light for four hours. The reproducibility test found the dosimeters exposed to
the same exposure of solar radiation provided a standard error in the change in
absorbance of 0.005. This is comparable to the standard deviation for polysulphone of
51
5.1.6 Temperature Independence
The temperature independence was established by recording the change in absorbance of
the dosimeter at different temperatures. It was tested at temperatures between 20º and 40º
C exposed on a horizontal plane to the fluorescent lamp. As indicated in Figure 22, the
temperature independence was found as the dosimeters response did not change with
temperature from 23 ºC to 37 ºC. The change in absorbance of the dosimeter was within
the error bars of the ΔA from 23 ºC to 37 ºC. These results indicate that the dosimeter
52 5.2 Significance
Blue light can be damaging to the human eye. In order to reduce the implications on
public health due to the blue light hazard, it is necessary to first quantify the amount of
blue light received by humans during normal daily activities. A potential dosimeter for
measuring the blue light hazard effective wavelengths has been proposed (Turnbull and
Parisi, 2012). This current project has extended this previous research to characterise the
properties of this dosimeter for quantifying the blue light hazard exposures.
5.3 Future Directions
Future research using a blue light hazard dosimeter based on polysulphone and
phenothiazine could measure different exposures of blue light and UV radiation including
in different seasons and environments and to the human body and plants. Future
directions with these dosimeters include:
Investigate how to extend the dynamic range of the dosimeter to more than one
day for use in sunlight.
Examine the dose response of the polysulphone and phenothiazine dosimeters
over a range of angles; this would determine if the calibration that is done on a
horizontal plane is valid for exposures at a range of angles.
Investigate if a combined dosimeter of polysulphone with phenothiazine is useful
in determining the blue light hazard exposures to humans during normal activities.
Measure the dose response from a stronger LED light would be useful to
53
Measure the dose response from a higher intensity of a compact fluorescent light
source.
Determine the appropriate corrections to be made for temperature independence
in further studies.
54
6.
CHAPTER SIX
6.1 Conclusion
Exposure to blue light can be harmful to the human eye, especially the retina. Blue light has
been established to cause a reaction in the eye and has been characterized by the International
Commission on Non- Ionising Radiation Safeguard as the blue light hazard. Different
dosimeters have been used to measure the blue light exposure lasting longer than one day
including one made from polysulphone, phenothiazine and Llumar films. This study aimed to
establish whether this proposed blue light dosimeter has the properties suitable for
measuring ocular blue light hazard exposures.
The objective was to confirm that useful dosimetry based on polysulphone and
phenothiazine can measure the blue light hazard exposure. This was done by quantifying
the characteristics of the dosimeter including: change in absorbance, dose response, influence
of the angle of the receiving plane, dark reaction, reproducibility, dose rate independence and
temperature independence.
.
The change in the optical transmission due to blue light exposure was found. The response of
the dosimeter indicated a maximum change due to the exposure at approximately 420 nm.
The polysulphone and phenothiazine dosimeters were exposed to four light sources and a
dose response calibration curve between the blue light exposure and the change in
absorbance was established. The influence of the angle of the receiving plane was found to