University of Southern Queensland
Faculty of Health, Engineering & Sciences
Transitioning roadways from high-speed to low-speed
environments when approaching regional towns in North
Queensland
A dissertation submitted by
Jared West
In fulfilment of the requirements of
Bachelor of Engineering (Honours) (Civil)
Abstract
This project combines a desktop study and field sampling to assess the effectiveness
of traffic control devices currently in place to transition motorists from high-speed to
low-speed environments. The project focuses on regional town approaches within
North Queensland as there is limited research and experimentation on this sector of
road safety in the area. Speed sampling, crash data and the analysis of relevant
environmental factors form the basis of the evaluation of the effectiveness of traffic
control devices in place.
Background information presented includes the physical and psychological elements
which dictate the speed environment, speed and transition zones, current gateway
treatments and other management strategies. International case study experiments
relevant to transition zones approaching regional towns are evaluated and signal the
performance of different treatments. The experimentation methodology employed was
the speed sampling of five transition zones throughout North Queensland. Crash data
within the five transition zones was critically evaluated to ascertain if a link between
speed and crash data could be established.
Speed sample results indicate that the current traffic control devices are ineffective in
achieving acceptable speed compliance. However, the evaluation also indicates that
the crash rates in the focus areas are not significant enough to be considered high
priority as current traffic control devices are effective in limiting ‘fatal crashes’. Site
specific recommendations are provided for changes to improve speed compliance
University of Southern Queensland
Faculty of Health, Engineering and Sciences
ENG4111/ENG4112 Research Project
Limitations of Use
The Council of the University of Southern Queensland, its Faculty of Health,
Engineering & Sciences, and the staff of the University of Southern Queensland, do
not accept any responsibility for the truth, accuracy or completeness of material
contained within or associated with this dissertation.
Persons using all or any part of this material do so at their own risk, and not at the risk
of the Council of the University of Southern Queensland, its Faculty of Health, Engineering & Sciences or the staff of the University of Southern Queensland.
This dissertation reports an educational exercise and has no purpose or validity beyond
this exercise. The sole purpose of the course pair entitled “Research Project” is to contribute to the overall education within the student’s chosen degree program. This
document, the associated hardware, software, drawings, and other material set out in
the associated appendices should not be used for any other purpose: if they are so used,
Acknowledgements
I would like to take the opportunity to thank my supervisor, Professor Ron Ayers, for
Table of Contents
Page Number
Abstract i
Limitations of use ii
Candidate certification iii
Acknowledgements iv
List of figures vii
Abbreviations x
Chapter 1 Introduction 1
1.1 Project Objectives 2
1.2 Geographical Focus 3
Chapter 2 Background - What Dictates the Speed Environment? 7
2.1 Roadside Development 7
2.2 Traffic Characteristics 10
2.3 Road Characteristics and Design Standards 13
Chapter 3 Background – Speed and Transition Zones 17
3.1 Speeding and Speed Management 17
3.2 Types of Speed Limits and Speed Zones 19
3.3 Speed Zone Length 23
3.4 Transition Zones 24
Chapter 4 Background – Current Gateway Treatments and Management
Strategies 27
4.1 Signage 28
4.2 Rumble Strips 34
4.3 Pavement Marking 37
Chapter 5 Project Methodologies 48
5.1 Methodology – Field Speed Sample Analysis 48
Chapter 6 Field Speed Sample Results 57
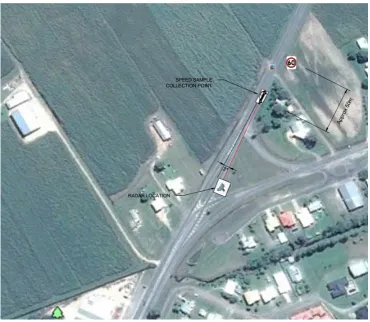
6.1 Charters Towers – Flinders Highway (East Approach) 57
6.2 Ingham 64
6.2.1 Bruce Highway (North Approach) 64
6.2.2 Bruce Highway (South Approach) 69
6.3 Pentland – Flinders Highway (West Approach) 74
6.4 Ayr – Bruce Highway (North Approach) 79
6.5 Sample Site Comparison 84
Chapter 7 Crash Data Analysis 86
7.1 Pentland – Flinders Highway (West Approach) 86 7.2 Charters Towers – Flinders Highway (East Approach) 86
7.3 Ingham - Bruce Highway (North Approach) 87
7.4 Ingham - Bruce Highway (South Approach) 89
7.5 Ayr – Bruce Highway (North Approach) 90
Chapter 8 Environmental Factors 93
Chapter 9 Recommendations for Changes at Sample Sites 95
9.1 Site Specific Recommendations 95
Chapter 10 Conclusions and Recommendations for Further Work 98
10.1 Accomplishment of Project Objectives 99
10.2 Further Research 100
References 101
Appendix A – Project Specification 104
List of Figures
No Title Page
1.1 Geographical Focus Area – North Queensland 4 1.2 Typical depiction of Bruce Highway (Ayr to Townsville) 5 1.3 Typical depiction of Flinders Highway (Townsville to Charters Towers) 6
2.1 Typical guide post 8
2.2 Estimated night-time crash reduction for road lighting 9 2.3 Relationship between hourly traffic volumes AADT 11 2.4 Typical pavement crossfall on straight roads 14
2.5 Suitable design road widths 15
2.6 Sight distance depiction 15
3.1(a) Relationship between speed and casualty rates 18 3.1(b) Relationship between speed and casualty rates – graphical 19 3.2 Typical speed limits for roads in rural residential areas 20
3.3 Burdekin Bridge south approach 21
3.4 Burdekin Bridge facing north 22
3.5 Minimum lengths of speed zones 23
3.6 Transition zone and approach zone concepts 25
4.1 Depiction of gateway 28
4.2 Speed restriction sign – 60km/hr (R4-1) 29
4.3 Alternative speed reduction sign – Cungulla, QLD 30
4.4 Wheelie bin – speed reminder sticker 31
4.5 Speed count down marker signs 32
4.6 Speed Feedback Sign Example 33
4.7 Speed-activated speed limit sign 33
4.8 Full width rumble strip 36
4.9 Rumble strip – wheel paths only 36
4.10 Summary of treatments in Iowa, USA 37
4.11 Treatment and data collection locations in Union, USA 38 4.12 Experimental transverse markings at entrance to Union, USA 39 4.13 Results of transverse pavement markings with and without speed feedback signs at entrances to
Union, USA 39
4.21 Experimental results of “SLOW” pavement legend in Slater, USA 45
4.22 Driver view of speed table in Gilbert, USA 46
4.23 Experimental results of speed table in Gilbert, USA 46 4.24 Summary of impact and cost of rural traffic calming treatments 47
5.1 Phantom 53550 radar gun 50
5.2 Phantom 53550 radar gun – technical specifications 50 5.3 Cosine angle adjustment table for Phantom 53550 51
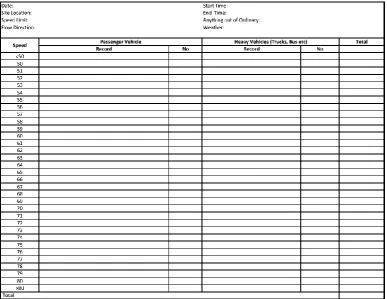
5.4 Speed sample data spreadsheet 54
5.5 Project methodology – flow chart 56
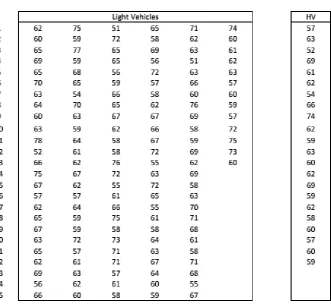
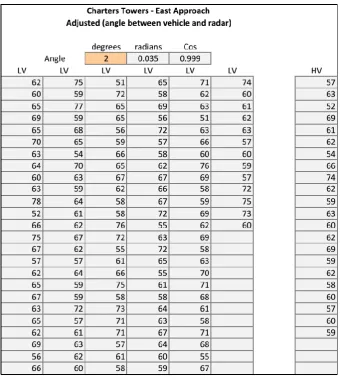
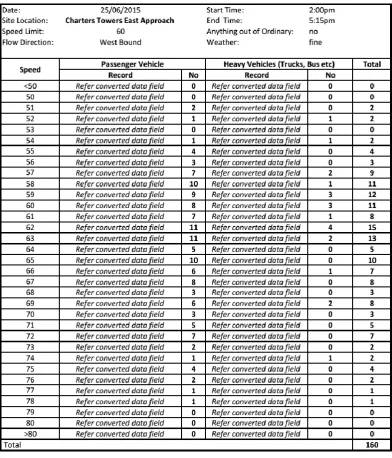
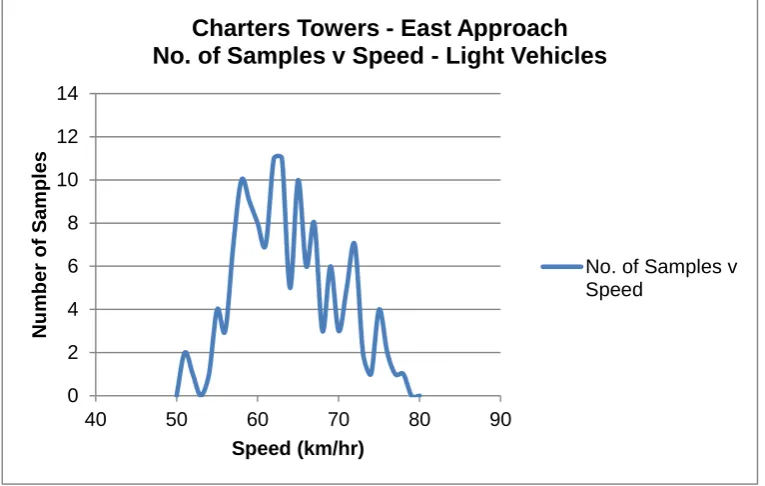
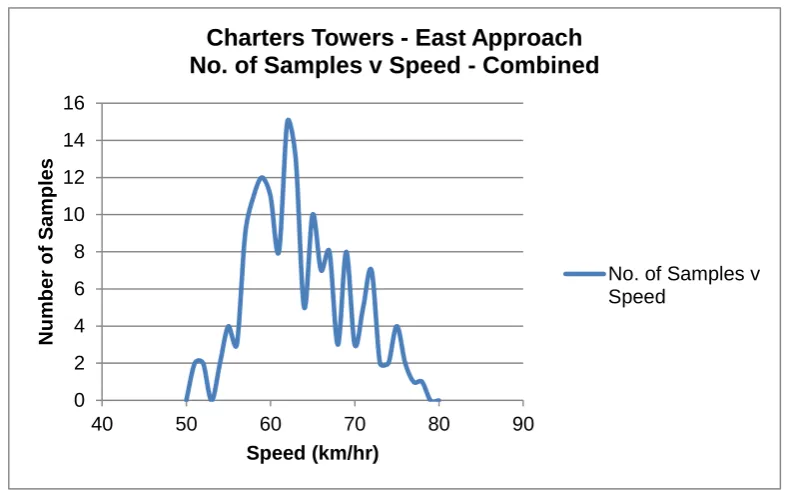
6.1 Charters Towers east approach (facing west) 58 6.2 Charters Towers east approach – speed sample survey layout 58 6.3 Charters Towers east approach – raw speed sample data 59 6.4 Charters Towers east approach – angle adjusted speed sample data 60 6.5 Charters Towers east approach – raw speed sample data 61 6.6 Charters Towers east approach – light vehicle sampling graph 62 6.7 Charters Towers east approach – heavy vehicle sampling graph 62 6.8 Charters Towers east approach – combined vehicles sampling graph 63 6.9 Charters Towers east approach – 85th Percentile speed graph 64
6.10 Ingham north approach (facing north) 65
6.11 Ingham north approach – speed sample survey layout 66 6.12 Ingham north approach – light vehicle sampling graph 67 6.13 Ingham north approach – heavy vehicle sampling graph 67 6.14 Ingham north approach – combined vehicles sampling graph 68 6.15 Ingham north approach – 85th Percentile speed graph 69
6.16 Ingham south approach (facing south) 70
6.17 Ingham south approach – speed sample survey layout 71 6.18 Ingham south approach – light vehicle sampling graph 72 6.19 Ingham south approach – heavy vehicle sampling graph 72 6.20 Ingham south approach – combined vehicles sampling graph 73 6.21 Ingham south approach – 85th Percentile speed graph 74
6.22 Pentland west approach (facing east) 75
6.23 Pentland west approach (facing west) 75
6.24 Pentland west approach – speed sample survey layout 76 6.25 Ingham south approach – light vehicle sampling graph 77 6.26 Pentland west approach – heavy vehicle sampling graph 77 6.27 Pentland west approach – combined vehicles sampling graph 78 6.28 Pentland west approach – 85th Percentile speed graph 79
6.29 Ayr north approach (facing south) 80
6.34 Ayr north approach – 85th Percentile speed graph 83 6.35 All sites – 85th Percentile speed graph (light vehicles) 84 6.36 All sites – 85th Percentile speed graph (light & heavy vehicles) 85 6.37 All sites – 85th Percentile speed graph (combined vehicles) 85 7.1 Charters Towers east approach – crash location overlay 86 7.2 Ingham north east approach – crash location overlay 87
7.3 Ayr south approach – crash location overlay 89
Abbreviations
ADT Average daily traffic
AADT Annual average daily traffic
DHV Design hourly volume
Chapter 1
Introduction
Road transportation is a major platform for Australian’s to carry out their lives and has
become an integral component of modern society. The benefits road transportation
provides Australians and their families are hard to rival. Unfortunately road
transportation is also associated with a long history of incidents which too often result
in fatalities or serious harm.
With the exponential societal increase in usage of road transport, a significant
emphasis has been placed on improving road safety to combat the exposure to public
harm. The focus on road safety has been implemented by all areas of Government and
some private industry for many years. Over the past few decades the road transport
network has transformed from humble beginnings to a truly spectacular segment of
Australia’s infrastructure. The major cities have motorways and freeways with
impressive overpasses, ramps and bridges. North Queensland’s regional town
approaches however are generally serviced by significantly less complex
infrastructure.
Queensland’s sheer size, quality of roads and long stretches between built-up
environments requires a real focus on road safety in order to allow for safe passage of
residents and tourists alike. Observations have been made that the compliance to speed
limits upon entering built-up areas can at times be poor in regional North Queensland.
This lack of compliance is generally treated with additional police enforcement where
resource allocations allow.
The project’s importance is reinforced by the lack of research undertaken into the
transition between the rural environment and the built-up regional environment
The project will provide an understanding of the fundamental elements of transitioning
roadways from high-speed to low-speed environment. The project compiles a
comprehensive literature review of relevant traffic engineering and road safety
elements in order to provide a local and global appreciation of roadway speed
transitioning. The current performance in the North Queensland region is assessed by
acquiring relevant crash data and undertaking speed sample field testing. A critical
review of the results was undertaken to assess current compliance issues and
recommend measures to improve speed conformance when transitioning from
high-speed to low-high-speed environments.
1.1 Project Objectives
This project seeks to analyse the effectiveness of traffic control devices currently in
place to transition motorists from high-speed to low-speed environments. The specific
geographical focus will be on approaches to rural townships within North Queensland.
Specific project objectives are as follows;
Develop a clear understanding of what current treatment and management strategies are in place to transition between speed environments.
Attain crash data which may be associated with not effectively transitioning speeds in the North Queensland area.
Undertake field survey’s to measure compliance to the posted speed limits in speed reduction zones. The field surveys will require speed samples of motorists
to be recorded with the use of a speed detection gun.
Analyse environmental factors relevant to the region and determine whether that has an effect on the appropriateness of the strategies in place.
Research additional treatments that exist outside of the region.
Initial works on this project required a literature review to be conducted in order to
determine relevant characteristics which contribute to the project. This included
background research on road design standards relevant to the focus area, an
understanding of the speed environment and what treatments and management
standards exist both nationally and internationally. Review of the Austroads
publications has been crucial for the project’s literature review. The Transport and
Main Roads (QLD) website provides the Manual of Uniform Traffic Control Devices
and the Road Planning and Design Manual which is used in conjunction with
Austroads Guide to Road Design for the design of roads throughout Queensland.
1.2 Geographical focus
North Queensland has no official boundary to separate itself from the rest of
Queensland. For the purposes of this study North Queensland will be defined as the
area bounded by Ingham to the north, Pentland to the west and Home Hill to the south.
This is aligned with the Queensland Department of Transport and Main Roads
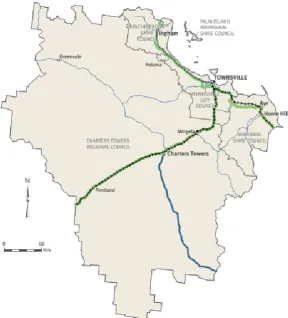
definition of the Northern District. The following map provided by the Queensland
Figure 1.1: Geographical Focus Area – North Queensland
Source: (Department of Transport and Main Roads 2014)
North Queensland’s largest urban centre is Townsville which is home to around
180,000 people and is approximately 1,350 kilometres north of Brisbane. Townsville
has a large port which exports material from mines to the west along with cattle
exports. The surrounding townships are much smaller and towns such as Ingham and
Ayr are significant sugar cane growers whilst Charters Towers is based on gold mining
and cattle farming. Annual temperatures and humidity throughout coastal areas are
generally high and seasonal rainfall is usually significant.
The major highway for this area is the Bruce Highway which runs along the east coast
of Queensland. The Bruce Highway begins in Brisbane and concludes in Cairns. The
Bruce Highway is approximately 1,700km long and is entirely sealed. Within North
Queensland the heavily trafficked highway passes along the coastal towns of Home
Hill, Ayr, Townsville and Ingham. Due to increasing traffic volumes, numerous
opportunities for vehicles trailing slower moving trucks or with caravans. The roadside
development varies substantially along the route with sugarcane plantations, urban
areas, cattle properties and consists of both flat and elevated terrain. The posted speed
limit varies from 60km/hr in urban areas up to 100km/hr which is typically
experienced on this highway within North Queensland. For the most part the roadway
consists of two line-marked 3.5 metre wide lanes with 1 metre shoulders.
Figure 1.2: Typical depiction of Bruce Highway (Ayr to Townsville)
Source: (Google Maps)
The Flinders Highway extends from Townsville to the west, encompassing Charters
Towers and Pentland within the defined geographical focus area of North Queensland.
The Flinders Highway’s roadside development generally consists of bushland with
posted limits up to 110km/hr in areas. Two 3.5 metre wide lanes separated with line
marking and 1 metre wide shoulders is the most common road layout of the Flinders
Highway. Large kangaroos by the roadside are common along this stretch and due care
needs to be taken to evade them wherever possible to prevent significant damage to
Figure 1.3: Typical depiction of Flinders Highway (Townsville to Charters Towers)
Source: (Google Maps)
Urban locations throughout the focus area which were assessed for driver compliance
to transitioning from high-speed to low-speed environments included;
Charters Towers (Flinders Highway Eastern approach)
Ingham (Bruce Highway Northern approach)
Ingham (Bruce Highway Southern approach)
Pentland (Flinders Highway West Approach)
Ayr (Bruce Highway Northern approach)
The projects geographic focus on North Queensland will add to the state-of-the-art
literature base within the field of road safety engineering for this area.
The roadway characteristics, traffic control devices and infrastructure of regional
North Queensland are similar to many regional centres throughout Australia. The
project findings could be applied and transferred to a large majority of Australian
regional areas. The findings would not be applicable to larger urban towns or cities
Chapter 2
Background - What Dictates the Speed Environment?
The speed environment can be described as the mean vehicle speeds of the traffic flow.
The speed environment governs the speed at which vehicles are restricted to travel at
or below and dictates the standard of road design to be implemented. It is achievable
to increase the speed environment with a higher level of service road design however
this generally incurs significant cost.
The speed environment is dictated by three elements; namely including roadside
development, road characteristics and traffic characteristics. These elements influence
the driver’s perception of what is an acceptable maximum travel speed. This chapter
explores these elements.
2.1 Roadside Development
Fildes & Lee (1993) describe roadside development as any aspect of the physical
environment which is close enough to make impact on driving behaviour.
Generally road user’s compliance to posted speed limits is poor in situations where the
roadside development abutting the roadway does not have an acceptable relationship
with the speed limit.
Austroads (2010b) identifies that rural roads are required to accommodate for a
number of roadside features such as signage and open drain excavations. Urban roads
generally need to cater for many other aspects such as footpaths, service utilities
and landscaping. Application of best practise in design will lead to road safety
to mark the edge of the road. Guide posts assist the road user by indicating upcoming
road alignment. Guide posts are generally closely spaced when positioned adjacent to
horizontal and vertical curves in order to reinforce their effect. During the night the
road users headlights activate the guide posts retroreflective markers providing
guidance at all times.
Figure 2.1: Typical guide post
Source: (Austroads 2009b)
The general concept of road lighting design is defined by Austroads (2009a) as
ensuring the road environment is sufficiently visible to ensure that the driving task is
performed successfully. Austroads (2009a) highlights the significant road safety
improvements that road lighting provides by presenting the findings of their road
safety engineering risk assessment project. The estimated results for various
Figure 2.2: Estimated night-time crash reduction for road lighting
Source: (Austroads 2009a)
Austroads (2008) advises that the activity levels generated by bordering roadside
environment have a significant impact on vehicle speeds. Speed zones should be
assessed considering the relevant roadside factors such as; do access restrictions to the
road exist such as rail lines, beaches, hill cuttings and parks? Is there a significant
variation in development between opposing sides of the road? How many intersections
are present whether controlled or uncontrolled? Also of interest is the number and
setback distance of adjoining driveways and the nature of the environment (residential,
industrial, commercial or rural).
Fildes et al (1987) undertook experimental testing to develop an appreciation of the
effect the roadside environment had on vehicle speeds, comparing spacious roadside
environment’s to walled and congested environments. Their findings generally suggested that the environment had more effect on driver’s safety responses rather than
the travel speeds. They also found that the walling usually found in rural scenarios
2.2 Traffic Characteristics
(Austroads 2006) divides road users into three categories in relation to their vehicles.
Categories include motorised vehicles such as trucks, buses, cars and motorcycles,
non-motorised or low-powered vehicles and pedestrians who do not utilise a vehicle.
As this projects focus is based on regional township approaches the large majority of
road users will fall within the first category, namely motorised vehicles.
Traffic characteristics requiring consideration are outlined in (MUTCD 2003)
highlighting traffic volume/pattern and traffic composition. The traffic volume and
pattern needs to consider the amount of daily traffic incorporating fluctuations which
may occur. These could include such activities as sporting events, school hours or the
local town show. Traffic composition analysis provides an understanding of the
proportion of heavy vehicles, pedestrians and cyclists.
Traffic volumes are described by AASHTO (2001). Average daily traffic (ADT) is a
basic measure of highway traffic demand. ADT is defined as the total traffic volume
over a period of time. The period of time is required to be greater than one whole day
and less than three hundred and sixty five days. ADT volumes are essential in
determining current usage of roadways. This understanding should lead to more
effective allocation of funding to repair or provide efficiency increases to roadways.
However the issues with ADT volumes is it will usually negate the variations in traffic
volumes during months of the year, days of the week or hours of the day. This is an
important distinction to be aware of as in some rural locations traffic volumes can be
double the ADT during certain times of the year.
More locally the Department of Main Roads (2004) reinforce the importance of traffic
demand and note that traffic patterns are of special interest due to the large tourist
demand in coastal areas. The design of a road network should utilise localised traffic
variations, which can be attained by collection of data. The term Annual Average Daily
Traffic (AADT) defines the total yearly traffic volume divided by the number of days
to the design of roads due to the lack of detailed information on volume variation
throughout the day, week or year. Hourly volumes will provide a more appropriate
measure of the traffic conditions needing to be addressed by the road design. It is
apparent all roads will experience fluctuations and periods of high activity throughout
the day. The following figure provides an indication of the relationship between hourly
volumes and AADT.
Figure 2.3: Relationship between hourly traffic volumes AADT
Source: (Department of Main Roads 2005)
The distribution of traffic also requires consideration when selecting a Design Hourly
Volume (DHV). Department of Main Roads (2004) notes that that the volume of traffic
flow in each direction can vary from 55 to 70 percent of overall flow. Therefore the
design must incorporate the transverse distribution of vehicles to ascertain a proper
design. Vehicle longitudinal distribution describes relative position in a direction of
flow. This distribution is calculated from the travelling distance between the
vehicles referred to as ‘gaps’ and the actual length of the vehicles. In rural situations
it is common for vehicles to travel in bunches due to factors such as limited overtaking
opportunities, roadworks or traffic signal control upstream. It is worth noting that
consideration is required to estimate the projection of future traffic. This projection is
Traffic composition according to the Department of Main Roads (2004) is the division
of groups within the traffic streams. These groups are divided into four categories
namely passenger cars (cars and light trucks), trucks (includes all buses, combination
vehicles and other multi combination vehicles, motorcycles and bicycles. It is noted
that when a car tows a caravan it forms part of the truck group within the traffic stream
due to the similarity in characteristics as a result of increased weight and decreased
speed, acceleration and braking capability.
Austroads (2010a) highlights road user behaviour should be considered as central to
the majority of the design decisions relating to roadways. The performance of the
drivers is the single most important factor when considering the efficiency and safety
of a road system. Past understanding of road user behaviours provides a basis for many
elementary design perimeters such as geometric design and selecting a suitable
operating speed. A better understanding of road user behaviour may result in designers
producing more appropriate and beneficial road designs.
Further emphasis on the appreciation of driver performance is provided in AASHTO
2001 where it defines the appreciation as essential to produce suitable highway
designs. Where a highway has been designed to accommodate driver capabilities and
their limitations roadway performance is increased. Attention is drawn to the increase
in older drivers in the highway user population. An ageing population may have the
potential to undesirably change the highways efficiency and safety spectrum. Older
drivers possess special needs which must to be considered in the design of roadways.
These needs require consideration such as additional brightness at night to assist in
understanding visual information. It was found that drivers need double the brightness
for each decade following the age of twenty-five.
AASHTO (2001) divides the act of driving or riding a vehicle into three tasks. These
tasks include navigation (planning and route following), guidance (following road
markings and adjusting path in response to changes in a safe manner) and control
According to Austroads (2010a) a significant number of geometric design standards
are guided by the sensory ability of driver’s vision and hearing. Many traffic control
devices incorporate vibration and hearing to provide a sensory cue to the operator;
these include devices such as rumble strips and audio tactile edge lines. Critical
attributes to an operators driving performance include colour sensitivity, peripheral
vision and visual acuity. Lighting conditions can have a significant impact on those
visual attributes along with aging and the consumption of drugs and or alcohol. Design
factors such as sign design and sight distance are heavily reliant on visual recognition
and response timings.
2.3 Road Characteristics and Design Standards
An informed decision is required when selecting the design speed to ensure the road
is engineered to perform well and balance cost effectiveness.
Road characteristics which influence the speed environment are outlined in MUTCD
(2003) and include alignment, road access, road junctions/intersections, adjoining road
section, shoulder width/type, roadside hazards and lane width.
A traffic lane is described by Austroads (2010a) as part of a roadway allocated for
one-way flow of single stream vehicles. The quantity and width of the lane has a substantial
influence on the roadways comfort, capacity and safety. Lane characteristics such as
number and width usually depend on volumes, percentage of heavy vehicles, cyclist
or pedestrian usage, available corridor width, adjoining roadside development and
accident rates. Lane widths on rural roads are desirably 3.5m. A width of this
magnitude allows overtaking manoeuvres to be undertaken without any requirement
for either vehicle to position the vehicle in close proximity to the edge of the road.
Where wider lanes are provided in rural situations it is observed that the additional
cost of construction is partly offset by reduced maintenance of the road shoulder in the
long term. The concentration of wheel paths in the vicinity of pavement edge increase
when travelling through narrow lanes drivers reduce speed and try to position the
vehicle closer to the centre of the road to provide more clearance to the road edge.
Another important element of roadway design is Crossfall. According to Austroads
(2010a) crossfall is a measurement of the cross-sectional slope of the road away from
the crown (highpoint in cross-section). Crossfall is required to drain the pavement
surface and can be used to provide additional friction on curves. The following table
provides some typical values for crossfall on straight roads for various pavement types.
Figure 2.4: Typical pavement crossfall on straight roads
Source: (Austroads 2010a)
Austroads (2010a) advises that many Australian roads carry less than 150 vehicles
each day. Single lane carriageways may be implemented throughout the road network
in areas where the terrain is open and vast. It is suggested that the single lane
carriageway be at least 3.7m wide to reduce the potential for disproportionate shoulder
wear, however a width between 4.5m and 6.0m has the potential for vehicles to attempt
passing without moving partially off the sealed pavement. The following table
Figure 2.5: Suitable design road widths
Source: (Austroads 2010a)
The sight distance is described by Austroads (2010a) as the length along the
carriageway which allows visibility of an object by a driver, or between two drivers.
Sufficient sight distance allows for drivers to recognise and react to upcoming hazards
on the road. Roads without satisfactory sight distance will provide less safety,
efficiency and driver comfort. Wherever possible the designer should endeavour to
maximise sight distance whilst understanding that elements such as vertical curves and
obstructions will provide restrictions.
Figure 2.6: Sight distance depiction
Source: (Austroads 2010a)
Whilst road geometry has a significant impact on the operating speeds of drivers there
are numerous other factors. Austroads (2010a) provides some insight into factors such
as the amount of risk the drivers are prepared to carry, speed limits and the limits
themselves in the principles of behavioural science. Designers rely on a psychological
understanding outside of safety and design to predict driver behaviour as a result of
the perceived roadway and environment. Behaviour modifiers include the presence of
a busy or stimulated environment which has the ability to distract road users or
overload them to the point that they perceive higher risk and consequently reduce
overall speed. Poor road conditions and high levels of pedestrian movements can lead
to lower driver speeds whilst smooth roads resulting in reduced noise, vibration and
harshness inside the vehicle can result in higher driver speeds. Other factors
contributing to higher speeds include significant road lighting, increased clearing
adjacent to roadway and user familiarity to the roadway. Other speed reduction
modifiers include high levels of police enforcement or a high percentage of heavy
vehicles within the traffic stream which causes an increased risk perception. It is worth
noting that while all of these factors appear to correlate with most people’s experiences
Chapter 3
Background - Speed and Transition Zones
This chapter explores in detail speed zones, speed limits along with transition zones
and their place in modern roadway design and classification.
3.1 Speeding and Speed Management
Speeding is described within NCHRP Synthesis 412 (2011) as either travelling too fast
for prevailing conditions or driving in excess of the posted speed limit. Speeding is
well documented as a major contributor to road crashes. Speed contributed to 31% of
fatal crashes throughout North America in 2008. It is estimated that the economic cost
to society in North America for speed related crashes is in excess of $40 billion US
Dollars.
According to NCHRP Synthesis 412 (2011) speeding within urban areas creates both
a safety and quality of life concern. Higher speeds are well documented with an
associated increased severity of road crashes, in particular with other road stakeholders
such as cyclists and pedestrians. Conventional wisdom supports this documentation as
a result of the increased distance travelled during perception-reaction time and a
reduced visual field affecting periphery vision whilst travelling at higher speeds.
Closer to home, Austroads (2008) links travel speed and casualties directly. Research
and evaluation has identified that even small reductions in travel speeds will
significantly reduce crashes and their associated trauma. This is a result of lower
speeds providing road users additional time for hazard assessment and crash
the risk of incurring a casualty in a road crash. It also found that small percentage
reductions in speeds (such as one or two percent) had a significant impact on the
reduction of death or injury. Methods implemented to establish these findings include
reviewing other bodies of research which included before and after studies of the
impact of speed limit changes and speed enforcement changes. Other methods include
correlating crash rates of comparable roads with varying speed distributions, detailed
investigation and crash reconstructions.
Austroads (2008) summarised the analysis of research undertaken by Elvik et al (2004)
to present findings on travel speed and casualty rate relationships. The research was
very extensive including 98 studies from 20 different countries between 1966 and
2004. Approximately 50% of the studies included were conducted after 1990,
including both urban and rural roads with speed ranging from approximately 25km/hr
to 120km/hr. Summary of the results are provided in the following figures.
Figure 3.1(a): Relationship between speed and casualty rates
Figure 3.1(b): Relationship between speed and casualty rates – graphical
Source: (Austroads 2008)
The results demonstrate the significant and severe impact that speed has on road crash
casualties and injuries reinforcing the importance of enforced speed limits on our
roads.
3.2 Types of Speed Limits and Speed Zones
According to MUTCD (2003) in the absence of definitive means to establish speed
limits, general speed limits are applied by law to classes of roads dependant on their
environment. These general speed limits fall into two categories. Firstly a general
urban speed limit is prescribed as 50km/hr which is applied to urbanised/built up areas
without a defined speed zone. Secondly a general speed limit for rural areas is
prescribed as 100km/hr, which is also applied in the absence of a defined speed zone.
In Queensland the general speed limits are enforceable by policing bodies whether or
not a posted sign is installed.
The MUTCD (2003) refers to criteria based speed limits as the selection of a speed
Local street 50km/hr limit (this limit is applied to street where the prime function is to provide direct access to properties with limited neighbourhood travel
movement)
Undivided rural road 110km/hr limit (applicable to National and State Highways of very high standards)
Divided roads 110km/hr limit (also applicable to National and State Highways of very high standards such as motorways and the adjoining divided
carriageways)
Rural residential speed limits
The rural residential speed limit is of particular interest where a risk management
approach is the basis for speed limits. The functional road classification and number
of property/driveway access are the prime considerations; MUTCD (2003) outlines the
procedure for determining speed limits for roads in this category. The following table
represents typical guidance on the appropriate speed limit for the road classification
and average accesses relationship.
Figure 3.2: Typical speed limits for roads in rural residential areas
Source: (MUTCD 2003)
Additionally the MUTCD (2003) introduces special speed limits for a variety of
applications. These include;
Temporary limits (imposed during periods of roadworks and special events).
Classes of vehicle or driver limits (imposed usually for safety, where certain classes of vehicles require a reduced limit).
An example of a vehicle class limit is the Burdekin River Bridge located between Ayr
and Home Hill in Queensland. The speed limit for heavy vehicles is reduced from the
posted 70km/hr limit to a special speed limit of 50km/hr by way of signage. This is
required due to the long and narrow characteristics of the bridge which also facilitates
a rail line. The following photos of the southern approach depict the sign implemented
and the physical constraints of the bridge requiring the need for heavy vehicles to
reduce speed.
Figure 3.3: Burdekin Bridge south approach
Figure 3.4: Burdekin Bridge facing north
Source: (Google Maps)
MUTCD (2003) identifies the need for variable speed limits (VSL) to change limits
periodically. This variability can be beneficial for reasons including change in weather
condition or operating heavy vehicle inspection stations where the speed needs a
temporary reduction to cater for trucks either leaving or re-joining the traffic flow.
Other beneficial situations include high pedestrian areas, regulation of traffic flow and
reduction of congestion.
MUTCD (2003) describes speed zones as locations which are always signed and take
precedence over the general speed limits that may otherwise be applicable. Speed
zones can consist of the following types;
Linear speed zone – applied to a length of road with appropriate signage.
Area speed zone – applied to a road network within a specific area.
School zone – A short linear speed zone applied at the approaches to schools.
Shared zone – applied when a section or area is shared by pedestrians and vehicles.
Hospital zone – Similar to the school zone, a hospital zone is a reduced limit in the vicinity of the hospital. This is general used when high levels of pedestrian
Variable speed zone – speed varies throughout the day, such as a school zone or weather dependant speed classification.
Special speed zones – applied for special situations and range from 10km/hr to 50km/hr.
3.3 Speed Zone Length
Guidance for the length of speed zone is provided in MUTCD (2003), where the
minimum length is dependent on the speed limit. It is advised to maintain the absolute
minimum speed zone length where the speed limit is less than that of the prevailing
conditions. Generally speed zones with the exception of special zones should
maximise length and achieve the normal minimum length specified below.
Speed limit reductions of only 10km/hr should generally not be utilised if possible.
Further advice recommends usage of 50km/hr, 60km/hr, 80km/hr and 100km/hr speed
zones when considering a new allocation of a speed zone.
The following table provides guidance on the minimum lengths suitable to specific
speed zones.
Figure 3.5: Minimum lengths of speed zones
3.4 Transition Zones
Transition zones represent sections of a roadway where vehicles change between speed
environments, of particular interest is the change from high to low speed environments.
According to NCHRP (2012) transition zones are a unique portion of the roadway
system. Generally road design continuity is desired and abrupt changes are avoided
where possible. However within most transition zones a change occurs between rural
environment and a community or urban environment. This change can sometimes be
classified as abrupt and there is an expectation that the driver will make the necessary
adjustments to match the change. Safety and community liveability is negatively
affected when drivers do not respond appropriately.
Forbes (2011) defines the transition zone as the change from a rural to a community
zone. It is within this zone where drivers are required to undertake measures to reduce
their speed in order to facilitate safe passage through a developed area. NCHRP (2012)
expresses that a series of characteristics determine the location of
and length of the zone. The zone may include a section with features remnant of a rural
zone and also a section with characteristics similar to the edge of a built-up
community. It is important however to ensure that this zone has differentiating features
to the upstream and downstream zones to assist drivers to make a safe and efficient
reduction in speed.
NCHRP (2012) divides the transition zone into the perception-reaction area and the
deceleration area. The perception-reaction area is the segment of the transition zone
where the focus is on ensuring that drivers are alerted and aware of an upcoming need
to reduce their speed. This area has features similar to that of the upstream rural zone
with the introduction of some changes to assist in alerting the driver to upcoming
change. Drivers should be treated to good visibility of signs and other
warning/psychological devices to alert them of the changes ahead. These devices may
either be placed within the area of the upcoming deceleration area depending on the
device and design requirements. Whilst some deceleration may take place within this
prepare the drivers in order to get them prepared to adjust their speed and behaviour
within the next area. Further downstream is the deceleration area, where the
expectation is that all motorists will reduce speed to comply with the upcoming
developed/built-up areas operating speed. The driver’s awareness and mental
astuteness should enhance along with the shift to a more passive driving style. Within
this area, changes to the road environment and characteristics are generally beginning
to take place. The length of the perception-reaction area is determined by sight
visibility, design criteria and the speed profile whilst the deceleration zone should be
positioned based on land-use, roadway and safety conditions.
NCHRP (2010) states that the ultimate goal of designing and selecting transition zone
treatments is for drivers to be travelling at lower speed limit prior to entering the
developed area. This is achieved by first notifying the motorist of the upcoming change
with the use of warning devices and psychological measures followed by physical
changes in the transition zone. It is within this transition zone where a majority of the
speed reduction should occur. The following figure provides a clear understanding of
this process.
Figure 3.6: Transition zone and approach zone concepts
Cruzador & Donnell (2010) note that whilst it is desirable for significant speed
reductions to take place within transition zones it is uncommon for the design speed to
be modified to aid in facilitating this reduction. It is identified that more flexibility in
Chapter 4
Background - Current Gateway Treatments and Management
Strategies
This chapter investigates the current gateway treatment and management strategies in
place to allow safe and efficient passage from high speed to low speed environments.
Treatments consist of various traffic control devices which guide and regulate traffic.
A combination of national and international text has been reviewed to provide a broad
understanding of these domains.
‘Gateways’ are defined by Makwasha & Turner (2013) as a combination of traditional
and non-traditional traffic calming measures designed to slow traffic entering low
speed environments. Makwasha & Turner (2013) describe a wide variety of gateway
treatments including but not limited to signage, lighting, wall and fence structures, lane
narrowing, linemarking, medians and vegetation. The selection of a treatment usually
depends on location, geometry, costs and local standards. Makwasha & Turner (2013)
note that although gateways have been used to a great extent throughout the world
Figure 4.1: Depiction of gateway
Source: (Makwasha & Turner 2013)
4.1 Signage
Signage is a common and predominant measure for speed management and speed
transitioning throughout regional North Queensland. Austroads (2009b) advises that
road signs are provided to inform, alert, guide and regulate road users. Signs are
generally standardised throughout their application in Queensland in order to provide
the road user with more meaningful and familiar cues.
MUTCD (2003) outlines the signs used in various applications throughout
Queensland. The speed restriction sign is the most common sign for transitioning
motorists approaching townships from high to low speeds. The MUTCD code for the
Figure 4.2: Speed restriction sign – 60km/hr (R4-1)
Source: (MUTCD 2003)
Another commonly used sign referenced in the MUTCD (2003) in preparing motorists
for a transition of speed is the ‘Speed Limit Ahead sign’ (G9-79). This sign’s purpose
is to inform the driver that they are approaching an area where the speed limit is
reduced by more than 20km/hr and there is no requirement for an intermediate speed
zone. Generally this sign should be installed 300m in advance of the lower speed
limited area.
Austroads (2009b) provides guidance on lateral placement and height of signage. The
sign lateral position should be as close as practical to the roadway edge whilst
considering elements such as vehicle clearance requirements, road safety requirements
and road user obstruction. Signs along the edge of unkerbed roads should have a
minimum lateral clearance of 600mm to the road shoulder whilst ensuring the offset
from the travel edge does not exceed the limits of <2m or >5m. Throughout Australia
in rural and urban areas where there is limited pedestrian presence the bottom of the
sign face should be positioned at a height greater then 1.5m above the road pavement.
Austroads (2009b) advises that designers should consider the following factors when
considering the application a new (standard) sign. Will drivers be overloaded with
information? Are drivers likely to identify and respond to the message? Do existing
devices need to be relocated or removed? Is a new sign the appropriate response to the
problem? Is road layout modification necessary?
Driving throughout North Queensland it is apparent that other signage measures are in
place which may aid in the effective transitioning of vehicle speed and subsequent road
approaching the suburb of Cungulla located approximately 40km south of Townsville,
QLD.
Figure 4.3: Alternative speed reduction sign – Cungulla, QLD
This sign is at the approach to Cungulla which has quite a significant transition zone
reducing from 100km/hr to 50km/hr and implements a T-Intersection entrance.
An alternative measure which may be effective in persuading road users to undertake
a speed transition is the “wheelie bin speed reminder sticker” as depicted in figure 4.4.
Although this sign would get limited time exposure throughout the week it would serve
Figure 4.4: Wheelie bin – speed reminder sticker
Source: (MUTCD 2015)
NCHRP (2011) investigated studies undertaken on techniques to reduce speed for rural
high-to-low speed transitions. One treatment undertaken by Barker and
Helliar-Symons (1997) involved the installation of Countdown Speed Signs/Markers in the
U.K. The countdown marker signs were installed below traditional speed signs in a
longitudinal series of three. The most upstream complementary sign consisted of a
white background with three black diagonal slashes which reduced back to one
diagonal slash 100m upstream of the reduced speed limit. The following figure
Figure 4.5: Speed count down marker signs
Source: (NCHRP 2011)
Results showed no significant reduction in mean speeds upon approaching villages. It
was found that this non-numeric, coded information would require public education
and long-term exposure to provide any significant improvements in speed compliance.
A modern traffic control device adeptly named ‘speed feedback sign’ has produced
promising results. Speed feedback signs are electronic signs which have the capability
to measure oncoming vehicle speeds and display that travel speed to the driver.
Cruzado & Donnell (2008) installed speed feedback signs in transition zones in
Pennsylvania, USA. Findings included mean speed reductions of approximately 6 mph
(10km/hr) at both the actual location and downstream of the device. It was also noted
that the reduction effect was only present when the signs were in place. When the signs
were removed, travel speeds defaulted to the higher speed within a week. An example
Figure 4.6: Speed Feedback Sign Example
Source: (NCHRP 2011)
These signs require power and if a power source is unable to be easily installed then
significant installation costs could be expected. Solar power is an alternative however
theft could be an ongoing issue or concern. The real-time feedback serves an
interactive notice to the driver and is a very effective device in reducing speeds and
improving compliance.
Another treatment of similar nature is speed-activated speed limit sign. These signs
are also electronic however only activate a message when the measured speed of the
oncoming vehicle exceeds the legal speed limit. When activated the electronic sign
Winnett and Wheeler (2002) recorded a reduction of up to 80% of vehicles exceeding
the posted speed limit when this device was used at village approaches. Similar to the
speed feedback sign this device also requires power and has the associated problems
or costs in attaining power. It is also worth noting that devices such as these which are
installed in rural or regional locations may be subject to vandalism and as such
appropriate measures would need to be carried out to ensure their long term use.
Transitional Speed Limit treatments are a commonly used treatment throughout
Australia where an intermediate speed limit sign is installed between the 100km/hr
speed zone and the 60km/hr speed zone. Generally throughout North Queensland this
sign consists of the 80km/hr speed limit sign. Hildebrand et al. (2004) tested the
effectiveness of this practice in the province of New Brunswick, Canada and found
that the inclusion of the transitional speed limit sign had no significant impact on the
mean speed or the number of drivers exceeding the speed limit. Hildebrand et al (2004)
also concluded that these signs are not very effective in reducing speeds if there is not
a corresponding change in road characteristics.
4.2 Rumble Strips
Rumble strips can be used as a road safety feature to warn drivers of the need to
transition speed. The rumble strip alerts the driver as they pass over via vibration and
sound.
According to Austroads (2009) common forms of transverse rumble strips include;
raised bars, grooved bars and corrugated concrete. Rumble strips formed from grooves
within hot asphalt or retrofitted by grinding grooves into in-situ roadways can require
ongoing maintenance. Issues arise with this treatment when soil and debris collects
with the groove reducing the rumble strips effectiveness. The treatment is suited to
asphalt surfacing and is found to be not suitable for areas with thin bitumen sealing as
Throughout North Queensland there is a combination of asphalt and bitumen sealing
so consideration to the site surfacing type is essential. If installing rumble strips within
thin bitumen sealed areas, it is necessary for the treatment footprint to be replaced with
asphalt surfacing.
Austroads (2009b) identifies findings from previous studies into rumble strip
outcomes as shown below;
When installed on intersection approaches they can substantially reduce crashes.
There have been very few studies which quantify crash reduction potential of rumble strips outside of intersection locations.
When used on rural town approaches they are an effective alerting device and may reduce speed at the devices, but are unlikely to reduce speeds at other
locations within the town.
Adverse effects identified in Austroads (2009b) include continuous noise, attempts by
the driver to make dangerous manoeuvres in order to avoid the rumble strip and the
stability problems presented to cyclist and motorcyclists as a result of abrupt rise or
depressions in the roadway. It is advised that this device should be accompanied by
appropriate signage to express the nature of the possible hazard.
The following two examples are applications which are relevant to aiding the transition
of speed from a high to low speed zone. The rumble strip can be constructed over the
entire lane or just over the vehicles wheel paths. An example of a full width rumble
Figure 4.8: Full width rumble strip
Source: (Corkle et al, 2001)
In-lane rumble strips installed on the wheel paths only is depicted below.
Figure 4.9: Rumble strip – wheel paths only
Source: (Corkle et al, 2001)
Corkle et al, (2001) describes the use of rumble strips to alert drivers to changing
conditions as common however notes that there is minimal information available to
support that the rumble strips are effective in reducing crash rates. The report also
In New Zealand however, Charlton and Bass (2006) found up to a 6% reduction in
speed following installation of rumble strips during their research carried out between
July 2004 and June 2005. This research supports the merits of installing rumble strips
and in providing an effective measure to assist in successfully transitioning vehicle
speeds.
4.3 Pavement Marking
Similar in design intent to rumble strips, pavement markings also alert drivers to an
upcoming change in the road environment.
Federal Highway Administration (2009) evaluated the effects of pavement marking
traffic calming devices when employed as transition treatments between high-speed
rural environments and low-speed townships in Iowa.
Federal Highway Administration (2009) describes transverse markings as a series of
parallel bars painted onto the inside edges of the paved travel lane. The longitudinal
spacing is reduced as the driver approaches the built-up community. The intention of
this reduction is to give drivers the perception that the vehicle is increasing in speed,
resulting in the driver becoming aware of the upcoming need to reduce speed. The
study employed transverse marking which were 12 inches (305mm) wide and 18
inches (457mm) long. It is important to note speed feedback signs were also included
with the transverse markings in two of the three locations. However the speed feedback
signs were not able to be installed until nine months into the experiment as a result of
purchasing and installation issues. The speed feedback signs consisted of a posted sign
on the footpath with an electronic/digital speed display identifying the approaching
vehicle’s speed.
Installation locations and results for Federal Highway Administration (2009)
evaluation of transverse pavement markings with and without speed feedback signs
are depicted in the following three figures.
Figure 4.11: Treatment and data collection locations in Union, USA
Figure 4.12: Experimental transverse markings at entrance to Union, USA
Source: (Federal Highway Administration, 2009)
Figure 4.13: Results of transverse pavement markings with and without speed feedback signs at entrances to Union, USA
Source: (Federal Highway Administration, 2009)
Federal Highway Administration (2009) reported that the samples were collected
immediately downstream of the treatments via pneumatic road tubes. The results show
a significant spike in the reduction of speed at the 9 month period when the speed
feedback sign is installed. The combination of the speed feedback signs and transverse
marking resulted in speed reductions ranging from 3-7mi/h (4.8-11.3km/hr). The
In Dexter, USA, The Federal Highway Administration (2009) installed the
experimental red background with speed limit markings as depicted below.
Figure 4.14: Speed limit markings with experimental red background in Dexter, USA
Source: (Federal Highway Administration, 2009)
Speed sampling was taken for a 12-month period following the painting of the
roadway. The results are tabulated below.
Figure 4.15: Experimental results of “35 MPH” pavement legend in Dexter, USA
The table shows that the pavement marking has had an immediate speed reduction
effect. The locations ‘Before curve’ and ‘West entrance’ have experienced significant
speed reduction as a result up to the 9 month period. The samples taken at 12 months
however show that driver speeds increased from the 9 month period. This may be a
result of drivers becoming familiar with the markings as time progresses and taking
less notice of the marked pavement 35MPH speed limit.
Summary of other selected results from the Federal Highway Administration (2009)
investigations were as follows;
Lane Narrowing using Painted Centre island and Edge line Markings (Installed in
Union)
The existing roadway with between kerbs was 40ft (12.2m). The treatment consisted
of a 10ft (3.05m) wide painted centre island having the net effect of reducing lane
widths from 16ft (4.9m) to 11ft (3.4m) whilst catering for a 8ft (2.4m) parking lane.
Figure 4.16: Painted centre island and edgeline used to narrow lane
Figure 4.17: Experimental results of narrowing lane using painted centre island and edge line marking Source: (Federal Highway Administration, 2009)
The table of results above clearly shows the treatment had variable positive and
negative results and is considered to be an ineffective treatment, at least for that
location.
Converging Chevrons with “25 MPH” Pavement Marking Legend
The converging chevron markings treatment pictured below was installed at both
entrances to Roland, USA. The markings started at the speed limit sign and carried on
upstream a further 221ft (67.4m). The longitudinal distance between the chevrons
started at 25ft (7.6m) and gradually decreased to 18ft (5.5m). Additionally the marking
widths also decreased from 36 inches (914mm) to 6 inches (152mm) to increase the
perception that the vehicle was increasing in speed. A legend denoting the “25MPH”
Figure 4.18: Converging Chevrons installed at Roland, USA
Source: (Federal Highway Administration, 2009)
Figure 4.19: Experimental results of converging chevron markings and “25 MPH” pavement legend Source: (Federal Highway Administration, 2009)
The results shown above for the combination of converging chevron markings and the
“25MPH” pavement legend indicate a mild positive improvement on driver
compliance to the posted speed. At the West entrance location it is clear that the 3
month test period produced the best results with a 3mi/h (4.8km/hr) reduction of the
85th percentile speed. Following this time period it appears that the treatment lost its
effectiveness resulting in no reduction in the original 85th percentile speed at the 9
analysis period the treatment had produced a 4mi/h (6.4km/hr) reduction of the 85th
percentile speed. The east entrance treatment has been moderately successful in
increasing driver’s compliance to the posted speed limit. It is apparent however that
driver speeds were still 7-9mi/h (11-14.5km/hr) over and above the posted speed limit
after 12 months of the installed treatment.
“SLOW” Pavement Legend
Federal Highway Administration (2009) installed two pavement legends denoting the
text ‘SLOW’ at two locations in Slater, USA. One pavement marking was installed
near the western community entrance where a park and crossing used by children
existed; the second was installed around 1500ft (approx. 460m) downstream of the
first treatment. An image of the actual treatment and the experiment results are
provided in the following two figures.
Figure 4.20: “SLOW” pavement legend in Slater, USA
Figure 4.21: Experimental results of “SLOW” pavement legend in Slater, USA
Source: (Federal Highway Administration, 2009)
The results shown above for this experiment demonstrate the lack of effectiveness this
treatment had on reducing the 85th percentile speed. Remarkably the speeds in the first
legend location actually increased up to an additional 3mi/h (4.8km/hr) with mixed
results and some minor improvement found in the second location. It is clear that this
treatment has proved to be ineffective at this location.
Speed Table
A speed table, commonly referred to within Australia as a speed bump was installed
by the Federal Highway Administration (2009) within the centre of Gilbert. The speed
table was installed on a two-lane asphalt road with a posted speed limit of 25mi/h
(40km/hr). The speed table was 3 inches (76mm) high and 22 inches (approx. 560mm)
long in the travel direction. The speed table was accompanied by white line marking
denoting the speed table’s presence. The following figure shows the actual location
Figure 4.22: Driver view of speed table in Gilbert, USA
Source: (Federal Highway Administration, 2009)
The Federal Highway Administration (2009) found the treatment to be a very effective
tool to reduce driver speeds with consistent reductions of up to 5mi/h (8km/hr). Refer
to the following figure for details of the results.
Figure 4.23: Experimental results of speed table in Gilbert, USA
Source: (Federal Highway Administration, 2009)
Vertical measures such as a speed table need to be designed and installed with due
consideration to ensure the public are adequately warned of the treatments presence as
The Federal Highway Administration (2009) summarised the impacts and costs of
their experimental traffic calming treatments with the results provided in the following
figure.
Figure 4.24: Summary of impact and cost of rural traffic calming treatments
Source: (Federal Highway Administration, 2009)
It is clear that the Federal Highway Administration (2009) experiments improved
driver compliance overall and that it was a relatively successful experiment. It could
be linked to improving driver’s compliance to transitioning to low speed zones in
regional North Queensland, should markings such as the posted speed on a coloured
background, transverse pavement markings or a speed table be installed. Care needs
to be taken to ensure treatments are not overused as this may result in potential motorist
Chapter 5
Project Methodologies
The following chapter outlines the methods utilised to achieve the project objectives
outlined in the introduction.
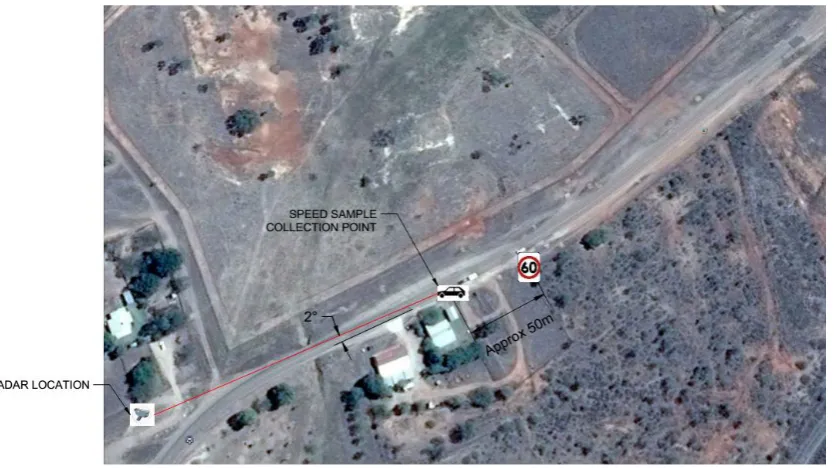
5.1 Methodology – Field Speed Sample Analysis
This project involved undertaking field surveys at various sites throughout North
Queensland to measure compliance to the posted speed limits in speed transition zones,
and to observe motorist behaviour.
The study area was determined as a result of accessibility constraints and limitations.
The approach of narrowing the focus area results in more detailed and specific project
outcomes. Further refinement was undertaken to decide on the field survey sites. Time
was spent analysing all potential locations within the focus area via a desktop mapping
study. An initial pilot survey was undertaken on the Charters Towers (Flinders
Highway East Approach) as a result of finding a suitable location during the desktop
study. Undertaking the first pilot study provided an appreciation of what makes an
acceptable site to undertake a survey and subsequent limitations which may exclude
other survey sites. Following the completion of the first study a field investigation of
the Charters Towers (Flinders Highway West Approach) was un