AUSTRALIA
University of Southern Queensland
Faculty of Health, Engineering and Sciences
FRACTURE BEHAVIOUR OF FIBRE/POLYMER
COMPOSITES BASED ON SYNTHETIC AND NATURAL
FIBRES
In fulfilment of the requirements of
ENG-4111&4112
research project part 1&2
Towards the degree of
Bachelor of Mechanical Engineering (BENG)
By:
Rashed Altamar
Abstract
In the current era, there are high demand to find alternative green and renewable, biodegradable products in several industrial and academic sectors. From the literature, natural fibres found to be a good and promising candidate to replace the synthetic fibres for mechanical and civil engineering applications. However, the literature recommends further understanding on the fracture behaviour of such materials since the main issue with the fibre composite is the crack propagation and the fracture weakness. In this work, bamboo fibres reinforced epoxy composites was fabricated. Moreover, glass fibre/epoxy material was fabricated to study the potential of using bamboo fibres. Fracture behaviour of the three materials was investigated and the mico-fracture mechanisms were categorized using scanning electron microscopy.
The current results revealed that bamboo fibres had decent fracture toughness value with 2.21 MPa m
1
2 for 15 mm fibres length compared to the glass fibres
University of Southern Queensland
Faculty of Health, Engineering and Sciences
ENG4111/ENG4112 Research Project
Limitations of Use
The Council of the University of Southern Queensland, its Faculty of Health, Engineering & Sciences, and the staff of the University of Southern Queensland, do not accept any responsibility for the truth, accuracy or completeness of material contained within or associated with this dissertation. Persons using all or any part of this material do so at their own risk, and not at the risk of the Council of the University of Southern Queensland, its Faculty of Health, Engineering & Sciences or the staff of the University of Southern Queensland.
University of Southern Queensland
Faculty of Health, Engineering and Sciences
ENG4111/ENG4112 Research Project
Certification of Dissertation
I certify that the ideas, designs and experimental work, results, analyses and conclusions set out in this dissertation are entirely my own effort, except where otherwise indicated and acknowledged.
I further certify that the work is original and has not been previously submitted for assessment in any other course or institution, except where specifically stated.
Acknowledgements
I’m using this opportunity to express my gratitude to everyone supported me throughout my learning journey to complete my final year project. Firstly, I offer my sincerest gratitude to my supervisor, Dr Belal Yousif for his support, advice and guidance along the way of my project. I would like also to deeply thank Mr. Mohan Trada and Mr. Adrian Blokland for their assistance in the laps and teaching me all the skills needed to finish my work. Special thanks also to Ms. Sandra Cochrane and all the USQ library staff members for their assistance. At last, I would like to thank my family for there continues support throughout my learning journey.
TABLE OF CONTENTS
Contents
TABLE OF CONTENTS ... 6
LIST OF FIGURE ... 9
LIST OF TABLES ... 10
LIST OF APPENDIX ... 10
LIST OF ABBREVIATIONS ... 11
CHAPTER 1 ... 12
INTRODUCTION ... 12
1.1 Introduction ... 12
1.2 Research Question ... 13
1.3 Objectives ... 13
1.4 Dissertation Organization... 13
CHAPTER 2 ... 15
LITERATURE REVIEW... 15
2.1 Introduction ... 15
2.2 Fundamental of Polymers and Fibre Polymer Composites ... 15
2.2.1 Polymers ... 15
2.2.1.1 Thermoplastic ... 16
2.2.1.2 Thermosetting ... 17
2.2.1.3 Epoxy resin: ... 18
2.2.2 Fibres ... 18
2.2.2.1 Natural Fibres ... 19
2.2.2.2 Synthetic Fibres ... 19
2.2.3 Fibres Reinforce Polymer Composites ... 20
2.3 Recent Work on Synthetic and Natural Fibres ... 20
2.3.1 Synthetic Fibres and Their Issues ... 20
2.3.2 Natural Fibres in Recent Era ... 21
2.3.3 Recent Issues with Natural Fibres ... 25
2.3.4 Fracture Behaviour of Fibre (Natural/Synthetic) Polymer Composites. ... 25
2.3.5 Influence of Chemical Treatment on Natural Fibre Characteristics ... 28
2.3.6.1 Introduction to Bamboo Fibres ... 31
2.3.6.2 Bamboo Fibres advantages ... 32
2.3.6.2 Economic aspect of bamboo fibres ... 33
2.3.6.4 Bamboo Reinforce Epoxy ... 35
2.4 Summary OF the Chapter ... 36
CHAPTER 3 ... 37
METHODOLOGY ... 37
3.1 Introduction ... 37
3.2 Materials Selection and Preparation... 38
3.2.1 Materials Selection ... 38
3.2.2 Bamboo Fibres Preparation ... 38
3.2.3 Glass Fibres Preparation ... 40
3.2.4 Epoxy Composites Preparation ... 42
3.3 Fracture Testing Machine ... 51
3.4 Experimental procedure ... 52
3.5 Morphology Study (SEM)... 53
CHAPTER 4 ... 54
RESULT AND DISCUSSION ... 54
4.1 Introductions ... 54
4.2 Fracture Behaviour of Glass Fibre ... 54
4.3 Fracture Behaviour of Bamboo Fibre ... 59
4.4 Comparison between GFRE & BFRE Fracture Performance ... 64
4.4 SEM Observation on the Fracture Behaviour of the Composite... 65
4.4.1 SEM for 5 mm fibres length... 66
4.4.2 SEM for 10 mm fibres length ... 70
4.4.2 SEM for 15 mm fibres length ... 71
4.5 Comparison with the Previous Work ... 73
4.6 Summary of chapter 4 ... 74
CHAPTER 5 ... 75
CONCLUSIONS AND RECOMMENDATIONS ... 75
5.1 Conclusions ... 75
5.2 Further Research and Recommendations ... 76
REFRINCES ... 77
APPENDIX A ... 81
APPENDIX C ... 87
APPENDIX D ... 88
APPENDIX E ... 89
APPENDIX F ... 90
APPENDIX G ... 92
APPENDIX H ... 93
Appendix I ... 101
Appendix J ... 103
LIST OF FIGURE
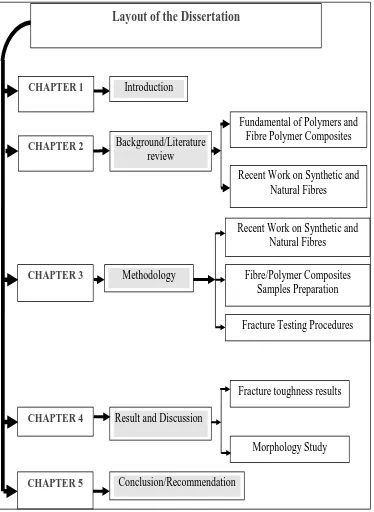
Fig 1. 1: Layout of the Dissertation ... 14
Fig 2. 1: SEM of Bamboo Fibre, (Wong et al., 2010)………28
Fig 2. 2: (a) Surface of the Coir Fibre, (b) Coir Fibre Surface after NaOH Treatment, (Gu, 2009) ... 29
Fig 2. 3: Scanning Electron Microscopy (a) Untreated Sisal Fibre; (b) NaOH Treated Sisal Fibre,(Mohan and Kanny, 2012) ... 30
Fig 2. 4: bamboo fibres percentages across the continents,(Abdul Khalil et al., 2012). ... 32
Fig 3. 1: Bamboo fibre preparation steps………... 39
Fig. 3. 2: Scanning Electron Microscopy for Bamboo Fibres ... 40
Fig 3. 3 : Glass fibre preparation steps ... 41
Fig 3. 4 : Scanning Electron Microscopy of Glass Fibres... 42
Fig 3. 5: Photo showing the used: (a) epoxy and (b) hardener ... 42
Fig 3. 6: shows the 3 different epoxy resins with different hardener percentage in the oven ... 43
Fig 3. 7 : Stage 1: Mould making ... 45
Fig 3. 8 : Stage 2: FRPC preparation ... 46
Fig 3. 9 : Dimensions of a compact tension specimen (ASTM 5045) ... 47
Fig 3. 10: Stage 3, cutting/grinding FRPC samples ... 49
Fig 3. 11: Stage 3: drilling and developing the crack ... 50
Fig 3. 12 : Tensile Machine at USQ ... 51
Fig 3. 13 : Specimens’ testing for fracture toughness ... 53
Fig 3. 14: Scanning Electron Microscopy and coating machin ... 53
Fig 4. 1: Load vs Displacement results of GFRE 56 Fig 4. 2: Average Force vs fibres length of GFRE ... 57
Fig 4. 3: Fracture toughness results for GFRE with different fibres length. ... 59
Fig 4. 4 : Load vs Displacement results of BFRE ... 60
Fig 4. 5: Average Force vs fibres length of BFRE ... 61
Fig 4. 6: Fracture toughness results for GFRE with different fibres length ... 63
Fig 4. 7 : Fracture toughness results for GFRE & BFRE based on average ... 64
Fig 4. 8 schematic drawing showing the influence of the fibre length on the fracture behaviour of the composites... 65
Fig 4. 9 : SEM of fracture surface of GFRE with 5mm fibres length ... 68
Fig 4. 10 : SEM of fracture surface of BFRE with 5mm fibres length ... 69
Fig 4. 11 : SEM of fracture surface of GFRE with 10mm fibres length ... 70
Fig 4. 12 : SEM of fracture surface of BFRE with 10mm fibres length ... 71
Fig 4. 13 : SEM of fracture surface of GFRE with 15mm fibres length ... 72
LIST OF TABLES
Table 2. 1: Comparison between Glass/Natural Fibres, (Wambua et al., 2003). ... 24
Table 2. 2: Tensile strength of Jowa, sisal and bamboo r fibre as reinforcement fibres to polyester composites, ,(Ratna Prasad and Mohana Rao, 2011) ... 24
Table 2. 3: The flexural properties of jowar sisal and bamboo r fibres (Ratna Prasad and Mohana Rao, 2011). ... 25
Table 2. 4 : Fracture test results for sisal fibre reinforce epoxy and plain epoxy, (Reis, 2012a). ... 26
Table 2. 5: Chemical treatment percentage vs tensile strength (Gu, 2009) ... 29
Table 2. 6: Comparison between bamboo and glass fibres (Zakikhani et al., 2014) . 33 Table 2. 7 : Bamboo export and import trade flow, (Abdul Khalil et al., 2012)... 34
Table 4. 1 : Fracture toughness result for GFRE (5 mm fibres length)………. 58
Table 4. 2: Fracture toughness result for GFRE (10 mm fibres length) ... 58
Table 4. 3: Fracture toughness result for GFRE (15 mm fibres length) ... 58
Table 4. 4 : Fracture toughness result for BFRE (5 mm fibres length) ... 62
Table 4. 5 : Fracture toughness result for BFRE (5 mm fibres length) ... 62
Table 4. 6 : Fracture toughness result for BFRE (5 mm fibres length) ... 62
Table 4. 7 : Comparison between glass & Bamboo fibres reinforcing epoxy in term of fracture toughness ... 65
LIST OF APPENDIX
APPENDIX A Project specification APPENDIX B Risk Assessment
APPENDIX C Epoxy resin “Standard work procedures”
APPENDIX D Operation procedures for making composites APPENDIX E Damaged samples during materials preparation APPENDIX F KINETIX Laminating epoxy
APPENDIX G Work Permission APPENDIX H ASTM D5045
[image:10.595.117.532.408.670.2]LIST OF ABBREVIATIONS
FRPC Fibre reinforce polymers composites
USQ University of Southern Queensland
SEM Scanning electron microscope
NaOH Sodium hydroxide
m Meter
mm mile meter
kPa kilo Pascal
Pa.s Pascal Seconds
Vol Volume
EU-27
European Union of 27 member states FRP
Fibre reinforce polymer NFRP
Natural fibre reinforce polymer BFRE
Bamboo fibre reinforce epoxy GFRE
Glass fibre reinforce epoxy FREC
Fibre reinforce epoxy composite
𝐊𝐈𝐂
Fracture toughness B
Specimen Thickness W
Specimen Width P
Load
ƒ (𝑊𝑎)
CHAPTER 1
INTRODUCTION
1.1 Introduction
In recent years, engineers are being challenged to ‘go green’ in many aspects of the engineering areas including environmental friendly processes and innovation of biodegradable or recyclable materials. The usage of the natural fibres brought several issue with regards to their interfacial adhesion with the synthetic matrix such as delamination and decomposition. Fibre reinforce polymer composites (FRPC) are widely used materials among the industry, due to their valuable mechanical properties. The common reinforcement fibres used in the FRPC are carbon and glass as synthetic fibres. However, using synthetic fibres brought several concerns regard their final disposal. Recently researchers are investigating natural fibres ability as a replacement to synthetic fibres (Zakikhani et al., 2014).
The climbing price of synthetic fibres as fibre reinforcement materials, the environmental threat the world facing are the main issues of synthetic fibre, so that natural fibres appear as a great replacement with all the potential, mechanical properties it can provide as reinforcement materials for fabrication of fibre/polymer composites, (Abdul Khalil et al., 2012). However, the usage of the natural fibres brought several issue with regards to their interfacial adhesion with the matrix and their fracture behaviour.
of bamboo fibres to replace glass fibres as reinforcement materials to polymer composites.
1.2 Research Question
The climbing price of synthetic fibres as fibre reinforcement materials, the environmental threat the world facing are the main issues of synthetic fibre, so that natural fibres appear as a great replacement with all the potential, mechanical properties it can provide as reinforcement materials for fabrication of fibre/polymer composites, (Abdul Khalil et al., 2012). However, the usage of the natural fibres brought several issue with regards to their interfacial adhesion with the matrix and their fracture behaviour. In the current study, the research question is focusing on that can bamboo fibres are a possible replacement to glass as a reinforcement material in the fibre reinforce polymer composites, in term of fracture performance?
1.3 Objectives
The main aim of the project is to study the fracture performance of epoxy composites based on glass and bamboo fibres. In details, the objectives are: 1. To address the issue with regard of the fracture behaviour of polymer
composites based on synthetic fibres from the literature.
2. To develop a new composite based on bamboo fibres and synthetic fibres such as glass fibres.
3. To evaluate the fracture characteristics of glass and bamboo fibre reinforced epoxy composites.
4. To evaluate the fracture behaviour of the composites via scanning electron microscopy.
1.4 Dissertation Organization
chapter summarise the main finding and argument in the literature review. Chapter 3 covers the used methodology to accomplish the work that has been done, in chapter 4 the result are introduces with a dissection and comparison of the work. In the end, chapter 5 summaries the report and list the recommendations.
CHAPTER 3
Result and Discussion
CHAPTER 1 Introduction
CHAPTER 2
Fundamental of Polymers and Fibre Polymer Composites
Methodology Fibre/Polymer Composites Samples Preparation
Fracture Testing Procedures
CHAPTER 5 Conclusion/Recommendation
Layout of the Dissertation
CHAPTER 4
Background/Literature review
Recent Work on Synthetic and Natural Fibres
Recent Work on Synthetic and Natural Fibres
Fracture toughness results
[image:14.595.129.503.188.700.2]Morphology Study
CHAPTER 2
LITERATURE REVIEW
2.1 Introduction
This chapter introduces the fundamental science of polymers and fibre polymers composites as background information related to the project field. In addition, the chapter reviews literature on natural/synthetic fibres and there issues, fracture behaviour of fibre/polymer composites and the influence of chemical treatment on natural fibre characteristics. At the end of the chapter, a review on bamboo fibre in the recent research studies and the material industry has been written.
2.2 Fundamental of Polymers and Fibre Polymer Composites
2.2.1 Polymers
Every object in this expanding huge universe is composed of atoms, which will form molecules. Molecules can have different or similar properties from each other’s and they form the material. Polymers are material category consist of a wide range of materials that we rely on in the modern daily life, formed from many repeated subunits called monomers. The scientific definition of polymers is written by (Young, 2011) is ”polymer is a substance composed of molecules which have long sequences of one or more species of atoms or groups of atoms
linked to each other by primary, usually covalent, bond” Polymers have
polymers can offer over other materials, for example its productivity, coast effective and the mechanical properties.
The origins of the modern polymers industry started in the nineteen century, when scientists had discover important modifications of certain natural polymers, and Leo Hendrik invented the world first thermoset plastic the Bakelite, through his invention he helped to form the modern plastic industry. Polymers exist in a wide range of marketable forms such as foams, fibres, thin films and sheets and bulks. Polymers materials can be divided into two main types/classes, and they are thermoplastics and thermosetting, (Ku et al., 2011). Within any class there is variety of different polymers.
2.2.1.1 Thermoplastic
Thermoplastics polymers have the simplest molecular structure, with chemically independent macromolecules. Thermoplastic polymers turn to be soft and deformable because of heating, which is a characteristic of linear polymeric molecules. In this sense, thermoplastic and most of the metals share the same characteristic of gaining ductility at a high temperature, (Shackelford, 2009). According to (Biron, 2007) Nowadays Thermoplastic consumption is roughly 80% at least of the total polymers consumption in the industry. To conclude, thermoplastic forming cycle start with subjecting the materials to heat until it turns to liquid state, after that thermoplastic can be shaped into the new manufacture shapes which they will retain when cooled. Multiple cycles of heating and cooling can be repeated without severe damage, allowing reprocessing and recycling. Some of the common thermoplastic polymers nowadays are nylon, polystyrene and polyethylene.
resistance, light weight and low coast, (MacDermott, 1997). The great design flexibility for thermoplastics and the ability to be recycled, considered one of the main aspects of the current polymers materials domination over the industry. The injection moulding processes can produce a variety of simple or even the most complex shapes, with a good quality saving a lot of time in manufacturing. In addition it can be remoulded and recycled over again, unlike thermosets. Thermoplastic has been applied instead of metals in many applications due to the considerable weight saving, low coast and the significant corrosion resistance over metals, also the predictable performance when they are subjected to these applications.
Thermoplastic main disadvantages are poor creep and relaxation behaviour compared to thermosets, also thermoplastics can melt fairly easily when exposed to heat sometimes with just the sunlight. In addition, thermoplastic have poor resistance to organic solvents, hydrocarbons and highly polar solvents.
2.2.1.2 Thermosetting
Thermoset materials are generally stronger than thermoplastic with better general creep behaviour. Thermosets are degraded by heat without passing through the liquid state. This improves some aspects of fire behaviour. Due to the significant strength and stiffness thermosetting materials considered as a common metal substitutes. The main thermosetting disadvantage is not being recyclable, and nowadays scientists are encouraged to find “green materials” to substitute traditional materials in many applications, due to the environmental issues.
2.2.1.3 Epoxy resin:
Epoxy resins are a class of thermosetting polymers having epoxide end groups. They can offer a mixture of unique properties over other thermosetting resins, and they are applied in variety of applications from aerospace to sport equipment’s industry, where fibres and epoxy resins combine to create composites, (Begum and Islam, 2013). Epoxy resins offer high bending strength, good adhesion, low shrinkage, good electrical insulations and high resistance to deterioration by chemicals and solvents; in addition they are available in wide range of physical forms,(Mallick, 1993). Epoxy resins are used as matrix materials in the fibre reinforcement polymers composites, for example with glass fibre when greater strength is required. Epoxy resins are chemically compatible with other elements so they are great choice for composite applications,(Maureen A. Boyle, 2001). The fracture performance of epoxy composites based on glass and bamboo fibres is going to be evaluated as mentioned in the project aim/objective (Chapter1).
2.2.2 Fibres
man-made materials. Natural fibres can be extracted from the bark (banana, jute, hemp, and ramie), stem (banana, palm, and bamboo), leaf (palm, screw pine, sisal, and agave), husk (coir), seeds (cotton), and grass(Ratna Prasad and Mohana Rao, 2011) . In addition, Animal fibres are obtained from a variety of animal coats, and insect fibres from cocoons. On the other hand, synthetic fibres are manufactured.
2.2.2.1 Natural Fibres
Natural Fibres are materials obtained from the nature of plants/animals as mentioned previously. The characteristics and functionalities of natural fibre can vary depending on the chemistry and the fibre structure itself. Natural fibres are applied in the aerospace, fabric, automotive and transportation manufacturing industry due to their valuable properties. They can be used as a component of composite materials to improve the mechanical properties, (Begum and Islam, 2013). Natural fibres cost more to manufacture in general than synthetic fibres, which makes them a second preference in most of the current industry, they are green environmental friendly materials and even if they cost more than synthetic fibres, Natural fibres still considered cheap compared to other materials, (Wambua et al., 2003). In the past few years a lot of researches have been conducted to determine the ability of natural fibre to replace synthetic fibres in the fibre polymer composites. Examples of natural fibres are hemp, flax, kenaf, sisal and bamboo fibre, (Defoirdt et al., 2010).
2.2.2.2 Synthetic Fibres
compared to natural fibres. So that, they are applied as reinforcement to materials (Zheng and Feldman, 1995),(Mukhopadhyay, 2014).
2.2.3 Fibres Reinforce Polymer Composites
The use of composite materials dates from centuries ago, and it all started with natural fibres. In ancient Egypt some 3000 years ago, clay was reinforced by straw to build walls. Later other more durable construction materials like metals were introduced. During the sixties, the rise of composite materials began when glass fibres in combination with tough rigid resins could be produced on large scale. Fibre Polymer composite is a composite material made of polymer matrix reinforced with fibres. Composites materials can offer combinations of properties are not available in traditional materials. The mechanical properties of fibres whether they are natural or synthetic is way better than polymers themselves. Therefore, fibres reinforce polymer composites will produce a higher mechanical properties. It is possible to introduce the fibres in the polymer matrix at highly stressed regions in a certain position, direction and volume in order to obtain the maximum efficiency from the reinforcement. In conclusion, fibres reinforce polymer composites consist of natural/synthetic fibre and a polymer matrix, fibres provide the composite with high strength and rigidity while the polymer matrix maintain the fibres alignment, (Begum and Islam, 2013).
2.3 Recent Work on Synthetic and Natural Fibres
2.3.1 Synthetic Fibres and Their Issues
depends on fossils fuel. So that, synthetic fibres production lead polluted gas emissions. Furthermore, (Abdul Khalil et al., 2012) claiming that the climbing price of synthetic fibres as fibre reinforcement materials and the environmental threat are the main issues of synthetic fibres. So that, natural fibres appear development is progressing among the industry.
2.3.2 Natural Fibres in Recent Era
Another supporting article has been published by (Reis, 2012a), Natural fibres can be a part of the world solutions towards global environmental issue. They have a wide range of advantages over other inorganic materials, they are cheap, low coast, flexible, biodegradable and available in fibrous form. They got the world industrial attention because of their advantages and they are applied in a variety of applications as reinforcement in the fibre polymers composites. The reason why this study has been conducted is the need of a new natural material
in the world right now to replace synthetic fibre due to the world increasing
environmental concerns. One of the main widely used natural fibres is sisal
fibres. The production of sisal fibres reaches around 4.5 tons a year worldwide.
Sisal is applied in carpets, ropes, mattresses and as reinforcement for polymers
and cement composites. The conclusion of the experimental article, natural
fibres in general and sisal fibres in specific appears as a decent green
alternative materials to reinforced polymers composites and can play a major
part to reduce the environmental effects issue.
According to (Ku et al., 2011) natural fibres are under a lot of study recently
because they have the ability to replace the synthetic fibres as polymers
reinforcement. According to the publishes review “A review on the tensile properties of natural fibre reinforced polymer composites” There are reasonable reasons why natural fibre can be the perfect replacement to
synthetic such as low coast, low density, recyclable, can reduce energy
consumption and comparable tensile strength properties. Another supporting
article which mentioned that natural fibre is under a lot of research and seems as a replacement to synthetic fibres reinforcement has been published by (Milanese et al., 2011). In the article “Mechanical behaviour of natural fibre composites” Sisal fibre has been under the microscope to study the mechanical
behaviour. There was a comparison between four types of sisal fibre reinforcement composites in the experimental study, humid sisal/polyurethane, humid sisal/phenolic resin, dry sisal/phenolic and dry sisal/polyurethane. The
aim of the study was to find out if the sisal fibre could replace glass fibre in
was “Natural fibres: can they replace glass in fibre reinforced plastics” done
by (Wambua et al., 2003), several types of natural fibre were tested and compared between each other’s in terms of their mechanical properties, then compared with glass fibre to reinforced polypropylene composites, to determine their ability if they can replace glass fibre. The result of the work showed that coir as a reinforcement material had the lowest value of mechanical properties whereas hemp reinforcement had the greatest value. Natural Fibre composites mechanical properties had a great values compared to glass. Furthermore in some specific properties natural fibre composites were even better. This indicates that natural fibre composites can replace glass in the reinforcement of a lot of applications.
The influence of natural fibres length on the mechanical properties of the fibre polymer composites studied by (Shalwan and Yousif, 2013), the work mentioned that increasing the fibres length or reducing the diameter, will affect the mechanical properties of the fibre/polymer composite positively, this due to the good load transfer between the polymer matrix and the fibres. On the other hand, reducing the fibre length will lead to lower mechanical properties.
Table 2. 1: Comparison between Glass/Natural Fibres, (Wambua et al., 2003).
Natural Fibre Glass Fibre
Density Low Twice that of natural fibre
Cost Low Low, but higher than NF
Renewability Yes No
Recyclability Yes No
Energy consumption Low High Distribution Wide Wide
CO neutral yes No
Abrasion to mechanics
No Yes
Health risk when inhaled
No Yes
Disposal Biodegradable Not bio-degradable
Table 2. 2: Tensile strength of Jowa, sisal and bamboo r fibre as reinforcement fibres to polyester composites, ,(Ratna Prasad and Mohana
Rao, 2011) Name of the composite Volume fraction of fibre Ultimate tensile strength Flexural modulus (GPa) Plain polyester
0.00 31.5 0.63
Jowar 0.40 124 2.75
Sisal 0.40 65.5 1.90
Table 2. 3: The flexural properties of jowar sisal and bamboo r fibres (Ratna Prasad and Mohana Rao, 2011).
Name of the composite Volume fraction of fibre Ultimate flexural strength (MPa) Flexural modulus (GPa) Plain polyester 0.00 55.08 1.535
Jowar 0.407 134 7.87
Sisal 0.40 99.5 2.49
Bamboo 0.40 128.5 3.70
2.3.3 Recent Issues with Natural Fibres
Zakikhani et al. (2014) Specified that high moisture content consider as one of the main issues of natural fibres. Also, Begum and Islam (2013) reported that natural fibres still do not have the ability to replace synthetic fibres as reinforcement for polymer composites in all applications, because they have lower mechanical strength in general. Many researches has been conducted and some still underway to improve the mechanical strength of natural fibres. Another issue regards natural fibres as a reinforcement material is the high moister and low thermal stability for raw natural fibres. This will lead to deterioration of the mechanical properties due to weakness of the fibre and polymer matrix. To overcome this issue a chemical treatment to the fibre surface is required during the preparation to improve the mechanical properties.
loading and cracks propagation in materials by applying solid mechanics methods to determine the materials mechanical properties such as fracture toughness, (Liu, 2005). This is the main aspect of fracture mechanics that is related to this project.
Reis (2012a) Has published experimental study regards the fracture behaviour of natural fibre reinforced polymer composite. In the study sisal fires were used as raw natural fibres and epoxy resins as the polymer matrix to produce the fibre polymer composite, and study its fracture behaviour. In the experimental study fracture energy and toughness were calculated using the below equations:
𝐆ƒ =𝐖𝟎−𝐦;𝐠;𝛅𝐀 𝟎
𝐥𝐢𝐠
Eq 2. 1
𝐊𝐈𝐂 =𝟑𝐏𝐦𝐚𝐱∗𝐒
𝟐𝐖𝟐∗𝐁 √𝛑𝐚𝐅(𝛂) Eq 2. 2
Where(𝐺ƒ) is the fracture energy, (𝐴𝑙𝑖𝑔) is the fracture area, (𝛿0) maximum displacement and (𝑊0) is the deflection curve vs area under the load. In the second equation (KIC) is the fracture toughness, (S), (W) and (B) are the span
depth and width. (Pmax) is the maximum load that has been measured. The outcome result of fracture testing indicated that the fracture toughness has increased significantly when sisal fibres were used to reinforce epoxy resin compared to plain epoxy as presented in table 2.4.
Table 2. 4 : Fracture test results for sisal fibre reinforce epoxy and plain epoxy, (Reis, 2012a).
Formulation (𝑮ƒ) 𝐊𝐈𝐂
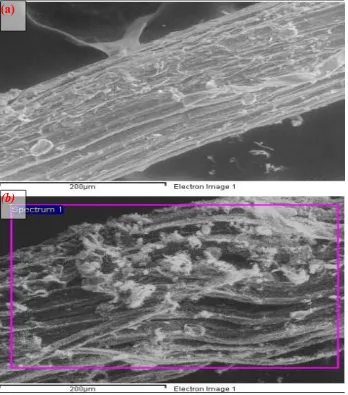
Wong et al. (2010) Placed bamboo fibre reinforced polyester under investigation to have a better understanding of the cracks resistance, toughness and mechanical properties of the short bamboo reinforced polyester. The study used SEM (Scanning Electron Microscopy) to study the fracture surface of the material composite. Several fibres length and volume has been used in the study to determine the best bamboo fibre/polymer composite condition. In the study, hand lay-up technique is used in the composite fabrication, several fracture tests are applied for each composite sample condition (fibre length, volume), and the result indicated by the average. To determine the fracture toughness the below equation is used:
𝐊𝐈𝐂= 𝐁√𝐖𝐩 ƒ (𝑾𝒂) Eq 2. 3
Fig 2. 1: SEM of Bamboo Fibre, (Wong et al., 2010)
On the other hand, fracture performance of synthetic fibres reinforced polymer has been studied by Reis and Ferreira (2003), an investigation has been conducted on glass fibres ability as a reinforcement to polymer composite in term of fracture behaviour. Conclusion of the work is that glass fibre reinforced polymer would improve both of the material crack resistance and the modulus of elasticity.
2.3.5 Influence of Chemical Treatment on Natural Fibre Characteristics
Fig 2. 2: (a) Surface of the Coir Fibre, (b) Coir Fibre Surface after NaOH Treatment, (Gu, 2009)
The result of the study in table 2.5 shows that NaOH with 6% concentration had the highest tensile strength compared to other treatment percentages concentration, which mean the fibre/polymer matrix adhesive issue has been improved with the chemical treatment, from table 2.5 results it also has been noticed that more than 8% of NaOH concentration will start to reduce the tensile strength of the coir fibres.
Table 2. 5: Chemical treatment percentage vs tensile strength (Gu, 2009) Fibre Tensile strength(cN)
Original Fibre 602.8
NAOH 2% 729.3
NAOH 4% 726.1
NAOH 6% 738.9
NAOH 8% 734.4
NAOH 10% 680.0
Mohan and Kanny (2012) Totally agree that NAOH treatments improve the mechanical as well as thermal properties of fibres and reduce water uptake, after studying the influence of chemical treatment on sisal fibres. The results indicate that NAOH treatment improved the fibre matrix interface strength and
tensile properties of composites. In the study the samples were examined by scanning electron microscopy to evidence the result as in Fig 2.3, To conclude the experimental study, sisal fibre that were treated with alkali “NAOH” had better outcome result in terms of mechanical properties, thermal and water absorption resistance over the untreated sisal fibres.
Fig 2. 3: Scanning Electron Microscopy (a) Untreated Sisal Fibre; (b) NaOH Treated Sisal Fibre,(Mohan and Kanny, 2012)
Milanese et al. (2011) Also mentioned that chemical treatment for natural fibres surfaces will reduce the water absorption and improve the strength of the fibre polymer composites. Rokbi et al. (2011) Published a paper regards the the
(a)
influence of chemical treatment on natural fibres reinforcing polymer composites. The study focused natural fibre reinforcing polyester composites, In the experiment fibres has been treated with NaOH, Alfa “grass” fibre has been used to determine the chemical influence. The fibre samples were subjected to 1%, 5% and 10% of NAOH for a period of 0-24-48 hours at 28c⁰, to determine the best conditions of the sample treatment. The experiment result indicated that NAOH treatment increases the fibre/matrix interface. Sample treatment with 10% NAOH in 24 hours had the best flexural properties. However after 48 hours the fibre sample will be more brittle and stiffer. Furthermore Mulinari et al. (2011) has published a similar study in the same area which ensure that alkali “NAOH” treatment improves the natural fibre mechanical properties to reinforce polymers. In the experimental study “mechanical properties of coconut fibres reinforced polyester composites” Fatigue and tensile test has been conducted to determine the mechanical properties of the natural fibre samples after the chemical treatment. On the other hand, Reis (2012a) claims that chemical treatment have not affect the fibre fracture behaviour or lead to any significant improvement, after conducting an experimental study on sisal fibre reinforce epoxy. In spite of the fact that fibre surface treatment supposed to improve the fibre polymer composite adhesion however in this case it was not determined.
2.3.6 Bamboo Fibres
2.3.6.1 Introduction to Bamboo Fibres
Bamboo fibres demands has increased tremendously in the last few years as a substitute to synthetic fibres in the fibre/polymer composite, because of the increasing world demands for green sustainable materials. Presently bamboo fibre rise up as one of the natural fibres that has the potential to be applied as reinforcement material to polymer composites, due to its valuable thermal, mechanical properties and chemical modification. Bamboo fibres are extracted
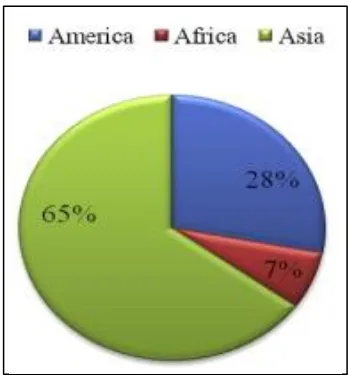
which is extracted directly from the tree without any chemical treatment, and bamboo pulp fibre where chemical additive is involve in the process. Bamboo is available in a large scale in Asia and South America. Fig. 2.4 shows the main three continents and the percentage of bamboo fibres in each (Abdul Khalil et al., 2012).
Fig 2. 4: bamboo fibres percentages across the continents,(Abdul Khalil et al., 2012).
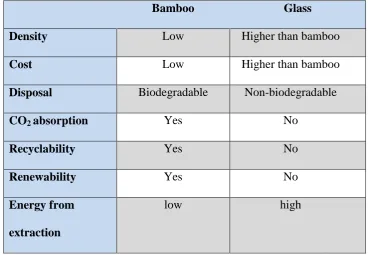
2.3.6.2 Bamboo Fibres advantages
Table 2. 6: Comparison between bamboo and glass fibres (Zakikhani et al., 2014)
Bamboo Glass
Density Low Higher than bamboo
Cost Low Higher than bamboo
Disposal Biodegradable Non-biodegradable
CO2 absorption Yes No
Recyclability Yes No
Renewability Yes No
Energy from extraction
low high
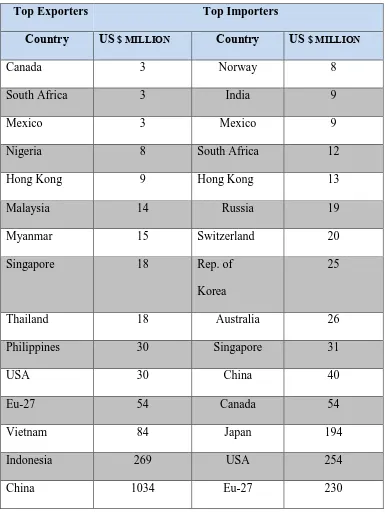
2.3.6.2 Economic aspect of bamboo fibres
Table 2. 7 : Bamboo export and import trade flow, (Abdul Khalil et al., 2012).
Top Exporters Top Importers
Country US $ MILLION Country US $ MILLION
Canada 3 Norway 8
South Africa 3 India 9
Mexico 3 Mexico 9
Nigeria 8 South Africa 12
Hong Kong 9 Hong Kong 13
Malaysia 14 Russia 19
Myanmar 15 Switzerland 20
Singapore 18 Rep. of
Korea
25
Thailand 18 Australia 26
Philippines 30 Singapore 31
USA 30 China 40
Eu-27 54 Canada 54
Vietnam 84 Japan 194
Indonesia 269 USA 254
2.3.6.4 Bamboo Reinforce Epoxy
2.4 Summary OF the Chapter
The current chapter addressed several points in the literature and the main point can be drawn as follows:
1. Thermoplastic consumption is roughly 80% at least of the total polymers consumption in the industry. Epoxy resins can be used as matrix materials for fibre reinforcement composites to improve mechanical properties. 2. Synthetic fibres are non-degradable and there are concerns about their
final disposal, Synthetic fibres are getting more and more expensive. 3. Natural Fibres reinforcement getting high attention worldwide by scantiest
and researchers. Natural fibres cost less than synthetic fibre to manufacture. Production of natural fibres consumes ten times less energy compared to synthetic fibres.
4. Natural fibres have lower mechanical strength than synthetic fibres raw natural fibres are high moister and low thermal stability materials. Natural fibre can be applied instead synthetic in the fibre reinforced polymers composites but still not in all applications. The mechanical properties of the fibre reinforce polymer composites depends on the strength of each fibre
5. Increasing Fibre content will increase fracture toughness of the composites as mentioned in several studied on both natural and synthetic fibres.
CHAPTER 3
METHODOLOGY
3.1
Introduction
3.2 Materials Selection and Preparation
3.2.1 Materials Selection
From the literature (chapter 2), it has been mentioned that there is no much work on the bamboo fibre in term of the fracture behaviour of fibre reinforce polymer composites (FRPC). Based on this fact, bamboo fibre is selected for the current study. For the reasons, there are many available in the; literature and the industries, however, epoxy resin finds its applications in many industrial such as automotive, aerospace and many others (Shih, 2007), therefore it is selected for the current study. Epoxy is used as the polymer resin in the experimental study, Epoxy (R246TX); is supplied by Kinetix composites in a liquid state with specific gravity 1.10 and viscosity 900-1100 MPa.s at room temperature currying, properties of the used epoxy can be found in Appendix F.
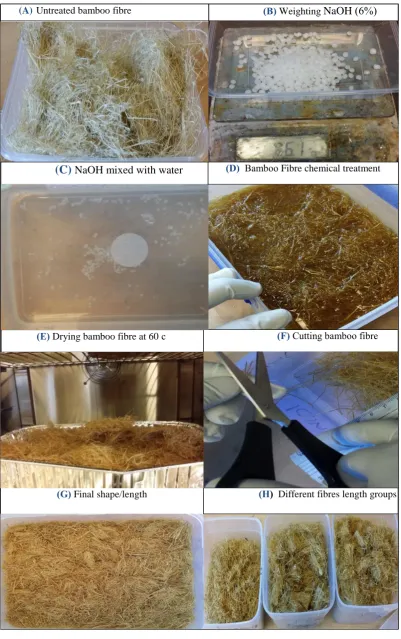
3.2.2 Bamboo Fibres Preparation
Fig 3. 1: Bamboo fibre preparation steps
(A)Untreated bamboo fibre
(C)NaOH mixed with water
(B)Weighting NaOH (6%)
(E)Drying bamboo fibre at 60 c (F)Cutting bamboo fibre
(G)Final shape/length
(D) Bamboo Fibre chemical treatment
(H) Different fibres length groups
The last step is cutting the fibres to the desired sample lengths (0.5cm, 1cm, 1.5cm); the entire fibre cutting has been done manually using scissors Fig. 3.1 (F), randomly fibre samples have been picked after the cutting, to determine the chance of error which was ±1mm. In the end, bamboo fibres stored in three different plastic boxes based on their length waiting for the composite preparation Fig 3.1 (H).
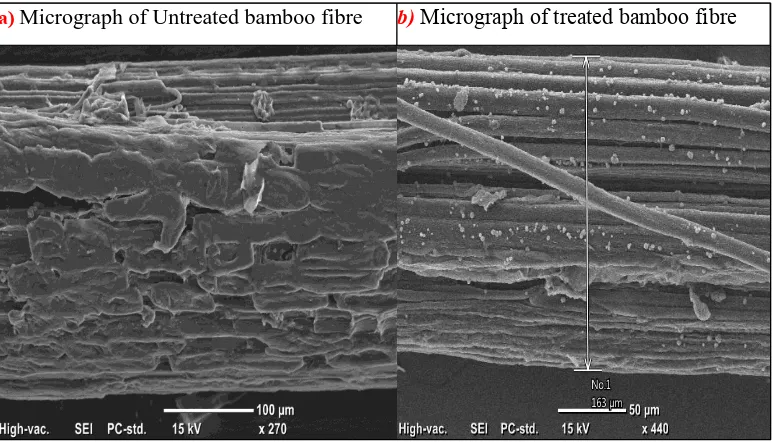
[image:40.595.129.516.360.581.2]Scanning electron microscopy (SEM) is conducted to determine the bamboo fibre radius (163 µm) in Fig. 3.2, also to evaluate and check the fibres situation clearly before and after NaOH treatment. The chemical treatment cleared the surfaced of the fibre as can be seen in Fig. 3.2, so that the epoxy can be fitted between the fibres gabs when manufacturing the fibre polymer composite.
Fig. 3. 2: Scanning Electron Microscopy for Bamboo Fibres
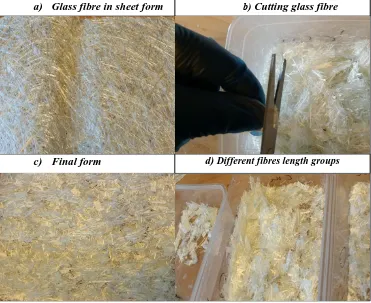
3.2.3 Glass Fibres Preparation
The preparation of glass fibres to develop the FPCs is shown in Fig. 3.3, Glass fibres are obtained in a sheet forum, from the composite center at the USQ Fig. 3.3 (a). Preparation of glass fibre was much quicker compared to bamboo fibre a)Micrograph of Untreated bamboo fibre b) Micrograph of treated bamboo fibre
in the project, the reason behind that is, no chemical treatment has been involved in the fibres preparation, furthermore the cutting process was easier, because glass fibres were in a sheet form. So the main step was cutting the fibres to the desired lengths 0.5cm, 1cm, 1.5cm as shown in Fig. 3.3 (b) to investigate the fracture result with similar length of bamboo fibres samples.
Fig 3. 3 : Glass fibre preparation steps
Similar to bamboo fibre preparation, SEM has been used to determine the glass fibre average diameter, the surface of the fibre has been evaluated and it was clean and relatively free of particles as can be seen in Fig. 3.4.
c) Final form
a) Glass fibre in sheet form b) Cutting glass fibre
Fig 3. 4 : Scanning Electron Microscopy of Glass Fibres
3.2.4 Epoxy Composites Preparation
Epoxy resin is the polymers matrix in the experimental study, it will be reinforced with glass and bamboo fibres in the composite preparation to study their fracture behaviour as mentioned in the project aim/objective (chapter1). The epoxy resin samples are prepared in the faculty of engineering & surveying laps at USQ, standard work procedures was followed carefully and risk assessment for the preparation has been done, all the standard procedures for epoxy usage can be found in appendix C and D. The polymer resin consists of epoxy (R246TX) and hardener (H160) Fig. 3.5.
Fig 3. 5: Photo showing the used: (a) epoxy and (b) hardener
Several samples of epoxy / hardener with different ratios have been developed in the lap, to determine the best ratio by show better solidification, in order to use that ratio in the fibre/polymer composite preparation step later on. The first sample had 80% of epoxy (149.6 grams) and 20% of hardener (37.4 grams) as the supplier recommended 4:1 ration between the epoxy and hardener, however the resin has not solidified after 24 hours in room temperature, so that increasing the hardener percentage was the next attempt to determine the best epoxy/hardener ratio. The second sample had 75% of epoxy (100.5 grams) and 25% of hardener (33.5 grams), while the third sample had 70% of epoxy (103.5 grams) and 30% of hardener (44.35 grams), both of the samples did not solidify after 24 hours in room temperature as well, trying to overcome this issue, the three samples placed in the oven to solidify for another 24 hours at 90 ̊ of temperature, however the result remain the same and the resin have not solidified. Appendix E has some of the unsuccessful /damaged samples during preparation.
Fig 3. 6: shows the 3 different epoxy resins with different hardener percentage in the oven
ordered and used to develop the polymer sample, this time only the recommended ratio from the supplier company (epoxy 80%, hardener 20%) has been applied, positive result were found and the epoxy has solidified after 24 hours in room temperature as recommended.3.2.5 Fibre Reinforce Epoxy Composite Preparation
Fibres reinforce epoxy composite (FRE) Samples preparation for fracture testing has been completed in 3 stages:
Stage 1 : Designing the mould for FRECs Stage 2 : Developing the FRECs
Stage 3 : Fabrication of FREC specimens dimensions according to ATM D5045
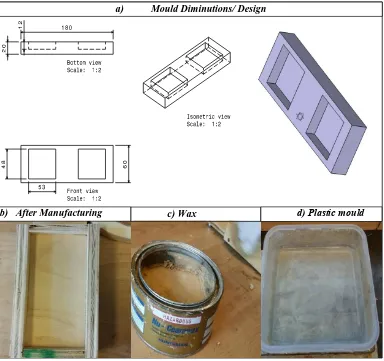
Stage 1: Designing the mould for FRECs
Fig 3. 7 : Stage 1: Mould making
Stage 2: Developing the FRECs
Fig. 3.8 indicate the second stage of FREC samples preparation step by step, Fig. 3.2 (A) show the different fibres length 5mm, 10mm, and 15mm for both bamboo and glass after the cutting process in the previous materials preparation steps. Fig. 3.8 (B) shows the new experimental plastic square mould (12.5cm ×12.5cm) which is obtained instead of the wood mould for the reasons mentioned previously, Coating the mould with wax for better extraction of the FREC samples can be seen in Fig. 3.8 (C), after that the fibres are placed inside the mould in randomly distributed way, and the epoxy is prepared as shown in Fig. 3.8 (D) and (E). The next step is casting the epoxy on the fibres in the mould, and then the FREC samples left for 24 hours at room temperature in the mould to solidify. Fig. 3.8 (H) shows extracting the
a) Mould Diminutions/ Design
FREC samples out of the mould after solidification. Last stage FREC preparation, is placing the samples in the oven as can be seen in Fig. 3.8 (I) at 110 𝑐𝑜 for 8 hours to cure according to the epoxy supplier company, details and properties of the epoxy in appendix F.
Fig 3. 8 : Stage 2: FRPC preparation
(A) Different length of glass/bamboo fibres
(B) Used mould (C) Mould coating
(D)Placing fibres in the mould (E) Preparing epoxy resin (F) Fibre/Epoxy
Stage 3: Fabrication of FREC specimens dimensions according to ATM D5045
[image:47.595.143.494.249.602.2]After FRPC preparation is done, cutting the FRPC samples to the desired dimensions was the next stage of preparing the specimens for fracture testing. The dimensions of the specimen are determined according to ASTM D5045 (APPENDIX F), the fracture toughness specimen’s diminution are shown in Fig. 3.9.
Fig 3. 9 : Dimensions of a compact tension specimen (ASTM 5045)
lack of cutting/shaping skills using saws, drills and grinding machines accurately, chance of error is ±0.4 mm by average.
Fig 3. 10: Stage 3, cutting/grinding FRPC samples
A
B
Fig 3. 11: Stage 3: drilling and developing the crack
A
B
3.3 Fracture Testing Machine
[image:51.595.187.451.253.589.2]MTS universal tensile machine model 810 (Fig. 3.12) has been used in the project to study the fracture behaviour of BRPE and GFRE, the tensile machine located in USQ, Z Block has been used under the supervision of Mr. Mohan Trada Coordinating, Technical Officer of the Faculty of Health, Engineering and Sciences at USQ, Standard working procedures and risk assessment of using the tensile machine has been followed, can be found in appendix J and K
3.4 Experimental procedure
The fracture toughness test for BFRE and GFRE specimens’ has been conducted using the fracture testing machine. The specimens’ placed under test at room temperature with a 1.5 mm/m cross wind speed. The diminutions of the specimens were based on ASTM D5045, with 7.7 mm diameter for the two circles, 16 mm thickness, 50mm width and 15 mm pre-crack.
The tested specimens for fracture toughness are: 4 samples of GFRE, with 5mm fibres length 3 samples of GFRE, with 10mm fibres length 3 samples of GFRE, with 15mm fibres length 3 samples of BFRE, with 5mm fibres length 4 samples of BFRE, with 10mm fibres length 4 samples of BFRE, with 15mm fibres length
The fractures toughness can be determined using the below equation:
𝐊𝐈𝐂 = 𝐩
𝐁√𝐖ƒ ( 𝒂
𝑾) Eq 3. 1
Were (KIC) is the fracture toughness, (p) is the load applied by the tensile machine, (B) is the specimens’ thickness = 16mm, (W) indicate the specimens’ width = 50mm, and ƒ (𝑊𝑎) is the geometry factor which is given by the below equation:
ƒ (𝑾𝒂) = 𝟐+(
𝒂 𝑾)
(𝟏−𝑾𝒂)𝟏.𝟓[𝟎. 𝟖𝟔𝟔 + 𝟒. 𝟔𝟒 ( 𝒂
𝑾) − 𝟏𝟑. 𝟑𝟐 ( 𝒂 𝑾)
𝟐
Fig 3.13 : Specimens’ testing for fracture toughness
3.5 Morphology Study (SEM)
[image:53.595.141.496.70.314.2]Scanning electron microscopy has been used to examine both BFRE and GFRE specimens’ surface conditions after the fracture test. All the specimens has been coated with gold before inspection, the crack propagation on the specimens fracture surface has been studied.
CHAPTER 4
RESULT AND DISCUSSION
4.1 Introductions
In this chapter, comparison has been made between the influence of glass fibres and the bamboo fibres on the fracture behaviour of epoxy composite considering different fibre lengths of 5mm, 10mm and 15mm. Moreover, fracture behaviour of the developed samples has been discussed with the aid of SEM after the test as morphology studies.
4.2 Fracture Behaviour of Glass Fibre
length for the fibre, in which there will be a good transfer of the load during the fracture behaviour.
For comparison purposes the maximum load of the three charts in Fig4.1 has been determined, the average has been taken for the three or four samples depending on the fibres length category associated with the error bar as given in Fig 4.2 for the three different lengths. The Fig. clearly indicates that the longer the length is the better the resistance to the failure during the fracture loading conditions. Since 15 mm shows the maximum loading capacity followed by 10 mm and 5mm in Fig 4.2, similar explanation to the previous finding in Fig 4.1, can be used here in which there is a critical length for the fibre which will be able to transfer the load between the matrix and the fibres.
Fig 4. 2: Average Force vs fibres length of GFRE
For the fracture toughness(KIC), the three different samples are calculated using the average which has been determined using equation 3.1 and equation 3.2 provided and explained in the experimental procedures (chapter 3). The fracture toughness for GFRE samples for different fibre lengths are determined in Table 4.1, Table 4.2 and Table 4.3, and the average also has been given. Basically from the three tables, we can see that the fracture toughness for 15 mm fibres in Table 4.3 is the highest followed by 10 mm fibres in Table 4.2
0 0.2 0.4 0.6 0.8 1 1.2
15 mm 10 mm 5 mm
Fo
rc
e
(
K
N
)
and 5mm fibres in Table 4.1, again the main reason for the better result of highest fibre length, is the capacity of the fibre to transfer the load between the matrix and the fibre.
Table 4. 1 : Fracture toughness result for GFRE (5 mm fibres length)
5mm fibres length (GFRE)
Sample number 1 2 3 4
Max (𝐊𝐈𝐂) result (MPa 𝐦
𝟏
𝟐) 1.4509 1.4515 1.8421 1.3521
Average(𝐊𝐈𝐂) samples result (MPa 𝐦
𝟏
𝟐) 1.5242 Table 4. 2: Fracture toughness result for GFRE (10 mm fibres length)
10mm fibres length (GFRE)
Sample number 1 2 3
Max (𝐊𝐈𝐂) result (MPa 𝐦
𝟏
𝟐) 2.4356 1.5840 2.8807
Average(𝐊𝐈𝐂) samples result (MPa 𝐦
𝟏
𝟐) 2.3001 Table 4. 3: Fracture toughness result for GFRE (15 mm fibres length)
15mm fibres length (GFRE)
Sample number 1 2 3
Max (𝐊𝐈𝐂) result (MPa 𝐦
𝟏
𝟐) 2.4988 2.6620 2.3879
Average(𝐊𝐈𝐂) samples result (MPa 𝐦
𝟏
𝟐) 2.5162
Fig. 4.3 shows the final fracture toughness (KIC) results for GFRE based on average testes samples as mention previously. From the figure 15mm fibres had the max fracture toughness result with 2.51 Mpa m
1
2 followed by 10mm with 2.30 Mpa m
1
2 and 5mm with 1.52Mpa m 1
Fig 4. 3: Fracture toughness results for GFRE with different fibres length.
4.3 Fracture Behaviour of Bamboo Fibre
In determining the fracture toughness of bamboo fibres, similar pattern of the previous section for glass fibres has been followed to compare and discuss the two results. Force vs displacement of different BFRE samples considering different fibres length are given in Fig. 4.4, each set of data has been conducted at least three times as can be seen in Fig. 4.4. In general, Fig 4.4 (a) to (c) showing smooth curve of until reaching the peak where the force drop dramatically. This indicate that bamboo fibres did not have the ability to resists the failure during the loading conditions, whereas glass fibre samples resisted as can be seen in Fig. 4.1 (a), (b) and (c). All samples in Fig. 4.4 (a), (b) and (c) showed similar trend pattern until the fracture point in spite of the different bamboo fibres length used to reinforce the epoxy composite.
0 0.5 1 1.5 2 2.5 3
(K
_
IC
)
M
p
a
m
0.5
Diffrent fibres length (mm)
GFRE Fracture Tougness
5MM Fibres (GFRE)
10MM Fibres (GFRE)
Fig 4.5 shows the average forces considering different fibres length samples of BFRE. The average has been taken for the three or four samples depending on the fibres length category associated with the error bar as given in Fig 4.4 for the three different lengths. Similar to glass fibres result, it seems the longer length of the bamboo fibres the maximum load can be reached, 15 mm fibres length had the maximum loading capacity with 0.988 KN. On the other hand, 5 mm and 10 mm bamboo fibres had almost similar load capacity value with 0.72 KN and 0.70 KN respectively. Since 15 mm shows the maximum loading capacity followed by 10 mm and 5mm in Fig 4.5, similar explanation to the previous finding in Fig 4.1 and Fig 4.2, can be used here in which there is a critical length for the fibre which will be able to transfer the load between the matrix and the fibres.
Fig 4. 5: Average Force vs fibres length of BFRE
0 0.2 0.4 0.6 0.8 1 1.2
15 mm Bamboo Fibres 10 mm Bamboo Fibres 5 mm Bamboo Fibres
Fo
rc
e
(
K
N
)
For BFRE fracture toughness(KIC), the three different samples are calculated using the average force which has been determined using equation 3.1 and equation 3.2 similar to the steps used in calculating GFRE fracture toughness values in the previous section. Tables 4.4, 4.5 and 4.6 show the fracture toughness results for different fibre lengths samples. The average fracture toughness also has been given in each table. Based on average (KIC) results, 15 mm fibres length had the highest value with 2.21 MPa m12 in table 4.6, followed by 10 mm and 5 mm fibres with relatively close (KIC) values of 1.69 MPa m12 and 1.60 MPa m
1
2 respectivly.
Table 4. 4 : Fracture toughness result for BFRE (5 mm fibres length)
5mm fibres length (BFRE)
Sample number 1 2 3
Max (𝐊𝐈𝐂) result(MPa 𝐦
𝟏
𝟐) 1.6004 1.4718 1.7564
Average(𝐊𝐈𝐂) samples result (MPa 𝐦
𝟏
𝟐) 1.6095
Table 4. 5 : Fracture toughness result for BFRE (5 mm fibres length)
10mm fibres length (BFRE)
Sample number 1 2 3 4
Max (𝐊𝐈𝐂) result (MPa 𝐦
𝟏
𝟐) 1.8956 1.491 1.7318 1.4562
Average(𝐊𝐈𝐂) samples result (MPa 𝐦
𝟏
𝟐) 1.6945
Table 4. 6 : Fracture toughness result for BFRE (5 mm fibres length)
15mm fibres length (BFRE)
Sample number 1 2 3 4
Max (𝐊𝐈𝐂) result (MPa 𝐦
𝟏
𝟐) 2.0447 2.4653 2.6092 1.7379
Average(𝐊𝐈𝐂) samples result (MPa 𝐦
𝟏
Fracture toughness results for BFRE shown in Fig 4.6 based on the average test results found previously in tables 4.4, 4.5 and 4.6 for different fibres length. In general, 0.5 mm and 10 mm bamboo fibres length had similar influence on the BFRE in terms of fracture behaviour. Starting with the lowest (KIC) result in
Fig 4.6, 5 mm fibres (KIC) = 1.6095 MPa m12 followed with a slight increase when 10 mm fibres used with (KIC) = 1.6945 MPa m
1
2 . Fracture behaviour of BFRE increased by 38.12% when 15 mm fibres used compared to 5mm and increased again by 30.76% compared to 10 mm fibres length, again the main
reason for the better result of highest fibre length, is the capacity of the fibre to transfer the load between the matrix and the fibre.
Fig 4. 6: Fracture toughness results for GFRE with different fibres length
0 0.5 1 1.5 2 2.5
(K
_
IC
)
M
p
a
m
0.5
Diffrent fibres length (mm)
5mm fibres length (BFRE)
10mm fibres length (BFRE)
15mm fibres length (BFRE)
4.4 Comparison between GFRE & BFRE Fracture
Performance
Based on the previous two section fracture behaviour results for both bamboo and glass fibres reinforcing epoxy composite, a comparison of the two results are introduced in this section. Fig 4.7 shows the fracture behaviour of all the 6 different samples of GFRE and BFRE with different glass and bamboo fibres length ranging from 5 mm, 10 mm and 15 mm. In general, Fig 4.7 show that glass fibres has better fracture behaviour compared to bamboo with the highest
(KIC) in the current experimental study 2.51 MPa m12 , however bamboo fibres showed decent results to be considered. It also can be noticed from Fig 4.7 that in spite of the natural or synthetic fibre used, increasing the fibre length had positive effect on the fracture behaviour on the fibre/polymer composite.
Summary of fracture toughness results is introduced in table 4.7.
Fig 4. 7 : Fracture toughness results for GFRE & BFRE based on average
0 0.5 1 1.5 2 2.5 3 (K _ IC) M p a m 0. 5
Diffrent fibres length (mm)
Fracture Tougness for GFRE & BFRE
5mm fibres length (BFRE)
10mm fibres length (BFRE)
15mm fibres length (BFRE)
5MM Fibres (GFRE)
10MM Fibres (GFRE)
Table 4. 7 : Comparison between glass & Bamboo fibres reinforcing epoxy in term of fracture toughness
Fibres
length Glass (𝐊𝐈𝐂) MPa 𝐦 𝟏
𝟐 Bamboo (𝐊𝐈𝐂) MPa 𝐦 𝟏 𝟐
5mm 1.52 1.60
10mm 2.30 1.69
15 mm 2.51 2.21
4.4 SEM Observation on the Fracture Behaviour of the
Composite
The most significant parameter infusing the fracture behaviour of the composite was the fibre length. To show the influence of the fibre length on the fracture behaviour of the composite, schematic drawing was plotted and presented in Fig 4.8. During the loading process, if the fibre length is short, the possibility of transferring the load form the matric to the fibre is less than the longer length of fibre .In other words, the longer fibres length the better, to transfer the load between fibres and the polymer matrix. However, form the literature their is a critical length In which there is no influence of the fibre length if it is increased. For further understanding, the micrographs of the fractured surfaces are presented in Figs. 4.9-4.15 for different fibre lengths.
Fig 4. 8 schematic drawing showing the influence of the fibre length on the fracture behaviour of the composites
4.4.1 SEM for 5 mm fibres length
The micrographs of both synthetic and natural fibres are given in Fig. 4.9 and Fig. 4.10 for the fibre length of 5 mm. The experimental data showing in the previous section showed that the glass fibre had better fracture performance compared to bamboo fibre. However, the result is very close to each other and bamboo fibres is very promising fibre that could be alternative to glass fibres.
In Fig. 4.9 (a), (b) and (c) one can see that the fracture behaviour of the compote can be pre-dominant by micro fracture, river like, detachment, pull out, fragmentation and breakage in the GFRE. Failure of the composite can be indicated as a brittle failure, due to the present of river like and also micro cracks close to the fibre and the detachment of the glass fibre. Despite of the fact, in the surface of the composite are highly and significantly ditoreited the result of the synthetic composite was slightly better than the natural fibre, the main reason for that is the glass fibres itself has better mechanical properties compared to bamboo fibres, from the literature review (chapter 2) the tensile strength of glass fibre can reach 88.6 MPa (Wambua et al., 2003) ,compared to bamboo which is about 51 MPa (Wong et al., 2010). This could be the main reason of the better performance of the synthetic compared to the natural fibres.
fibres, which could be the main reason of the comparable fracture behaviour of the bamboo fibre with the glass fibre.
In Fig. 4.10 (b), there is clear indication of breakage in the fibre and there is no pull out and the fibre still adhered well in the bulk of the composite, and there is no clear debonding of the fibre. In addition there are some debris of the epoxy resin inside the core of the fibre, which interlocks the fibre inside the composite, which results very good interfacial adhesion and improvement of the load transfer between the fibre and the resin.
Also in Fig. 4.19 (c), similar behaviour can be seen, despite there is breakage in the fibre, which actually represent the good interfacial adhesion and the good transfer of the load, since the fibre not pulled out from the matrix, similarly can be seen in Fig. 4.10 (d), despite of the fracture behaviour and harsh fracture nature in the resins region associated with sharp lips and river like, but still the fibre adhered well in the bulk of the composite and there is slight breakage in some of the fibres as well, which indicate very good interfacial adhesion of the fibre with the epoxy matrix, so based on these to Figs. one can say that, the bamboo fibre has very good interfacial adhesion with the matrix, which result in good fracture behaviour compared to the glass fibres, which supposed to have much better fracture behaviour than bamboo fibre, however the poor
Fig 4. 9 : SEM of fracture surface of GFRE with 5mm fibres length
River-like
Macro-Fracture
(a )
(b)
(c)
River-like
Detachment
Fig 4. 10 : SEM of fracture surface of BFRE with 5mm fibres length
(c) (d)
(b)
(a )
Detachment
Sharp lip
debonding
Core fibre
Lip
River-like
Adhered well
Fibre
4.4.2 SEM for 10 mm fibres length
[image:70.595.126.511.287.680.2]Scanning electron microscopy of natural/synthetic fibres reinforcing epoxy based on glass and bamboo fibres with 10 mm fibres length is shown in fig 4.10 and Fig 4.11, 10 mm glass