1
Dual-pin electrohydrodynamic generator driven by
alternating current
Van Thanh Dau
1*, Thien Xuan Dinh
2, Canh-Dung Tran
3, Tibor Terebessy
4and Tung Thanh Bui
51
Research Group (Environmental Health), Sumitomo Chemical. Ltd, Hyogo, 665-8555, Japan 2
Graduate School of Science and Engineering, Ritsumeikan University, Kyoto, 525–8577, Japan 3
School of Mechanical and Electrical Engineering, University of Southern Queensland, Queensland QLD 4350, Australia
4
Atrium Innovation Ltd., Lupton Road, OX10 9BT, Wallingford, United Kingdom 5
VNUUniversity of Engineering and Technology, Hanoi, Vietnam
*
Contact authors:[email protected], [email protected]
Abstract
We report a unique alternating current (AC) driven corona based air-flow generator using symmetrically arranged electrodes. Unlike the conventional configuration where one electrode generates charged ions moving towards the reference electrode, this configuration allows both negative and positive charges to simultaneously move away from the device and generate ion wind in parallel with the electrodes. In comparison with the direct current (DC) driven corona generator, the time oscillating AC field allows the device a better stabilization owing to the independence of ion wind strength from the inter-electrode spacing. Our results by both simulation and experiment showed that when the AC frequency exceeds a threshold value of 1100 Hz, the electric field at the electrode tips is determined dominantly by the charge cloud created in the previous half-cycle, resulting in stronger net electric field and thus stronger ion wind. In addition, the electrode separation in the AC driven corona based generator is less critical
above the frequency threshold, yielding a more robust design with minimized susceptibility to manufacturing tolerances and impurities on the electrodes. Moreover, lower voltage levels of the AC driven system allow simpler and more economical design in the high voltage circuit of the AC generator.
Key words: alternating current, bipolar discharge, ion wind, parallel pin.
1.
Introduction
Electric field driven air flow requires the accelerated charged particles to transfer their momentum to the surrounding neutral particles. A widely-used configuration for generating air flow utilizes ionization by gas discharge, where strong electric field capable of ionization is generated nearby a suitable electrode. The ions accelerate in the electric field and collide with neutral air molecules, resulting in momentum transfer represented by volumetric electrohydrodynamic force, which gives rise to bulk air movement commonly called as ion wind. The ion wind has been used in various airflow control applications1–3, cooling application4–7, propulsion technology8–10, micro-pump design11,12, precipitation filtering13,14, and electronic devices15–17. There are several methods generating electric-field driven ion wind and two principal approaches are reviewed below.
For the direct corona discharge (DCD) method, ion wind is generated by the direct discharge from one electrode to another one. The fundamental requirement for a conventional corona discharge includes a high-curvature electrode where ions are generated, and a reference electrode of low-curvature directing the movement of charged particles (Figure 1a). The discharge mechanism of the positive and negative coronas is different and the resulting discharge is dependent on the polarity of the electrical field and the geometrical configuration of electrodes. For this approach, various electrode configurations have been published, including point-to-ring18–21, point-to-plane22–26, point-to-grid27–30, or wire-to-plate31–33. Recent works have shown further improvements on ion wind generation, including the use of alternating negative/positive discharge34,35, multiple electrodes36, and multiple stages37,38. *Manuscript
2
Since this method uses DC driven static electric field, the discharge ion current and the space charge need to be compensated in the downstream space to prevent the charging of the device39,40.
Another widely used approach for creating ion wind is the dielectric barrier discharge (DBD). For this approach, the configuration usually consists of two electrodes separated by an insulating dielectric barrier to prevent sparking. Thus, it can be considered as the indirect discharge method41 (see Figure 1b). In the DBD, the charge generated from one or both electrodes quickly accumulates on the dielectric surface. This reduces the net electric field and stops the process of ion generation42. Many different electrode configurations have been introduced, such as wire-dielectric-wire43 and ring-dielectric-ring, with time-varying applied voltage to ensure that the accumulated charge is neutralized and the discharge is periodically restarted. The scaling law for this type of discharge has been established44 together with the effect of governing parameters such as voltage and ambient gas45,46. Since the discharge is generated by AC voltage, the DBD produces a pulsed wind that oscillates with a frequency twice of that of the driving signal. This approach usually generates two similar ion winds with opposing charges in a time period, and therefore the DBD may also be referred to as the bipolar discharge method.
While the force by electric field directs the charge from one electrode to another one in the DCD based system, the electric force in the DBD applied system varies with respect to the direction of electric field and intuitively yields a zero resultant force. However, several research works pointed out that the transient migration of charged species within the AC field increases the net ion wind47. Over the last two decades, many publications on corona discharge driven by AC have shown some interesting results. For example, Kim et al48 observed that the onset voltage in DCD was 10% - 20% lower than that of the DC
regime using wire-to-half ring configuration, and the effect of AC on the increase of ion wind was noticed in the range of frequencies 2000 Hz – 3000 Hz. Meanwhile, using the point-to-ring configuration, ion wind reached a peak value in the range of frequencies 500 Hz – 1000 Hz and 200 Hz – 2300 Hz by Ohyama et al49,50 and Drews et al21, respectively.
[image:2.595.95.500.82.205.2]Figure 1. Mechanism of ion wind generation: (a) DC driven Direct Corona Discharge (DCD) method with point-to-ring configuration; and (b) AC driven Dielectric Barrier Discharge (DBD) method.
[image:2.595.99.512.266.363.2]3
The difference in the mechanism of above two methods results in the different ion wind characteristics. The stationary electric field in DCD generates ion wind of only positive or negative charge. On the other hand, the transient electric field in DBD generates two ion winds of opposing charges for its pair of symmetrical electrodes. However, despite generating two ion winds of opposing charges, only one of them can be used at any one time because of the opposing direction of the ion wind movements.
In this paper, we present a hybrid configuration of ion wind corona discharge where a pair of electrodes arranged in parallel connects to an AC power as described in Figure 2. The presented configuration is a further development expanding on our recent work51–57 and possesses several configurational characteristics of DCD and DBD approaches. This configuration allows both negative and positive charges to simultaneously move away from the device in the same direction in parallel with the electrodes, and generate ion wind for both constant and transient applied voltages. In particular, experimental results show that the effect of AC in this configuration creates an ion wind flow independent of the electrode separation. For the system characterization, the correlation of ion wind with electrode separation, AC voltage and frequency are presented using experiments and numerical simulation. The effect of charge movement on the discharge operation and the generated ion wind are also discussed.
2.
Mechanism and experimental setup
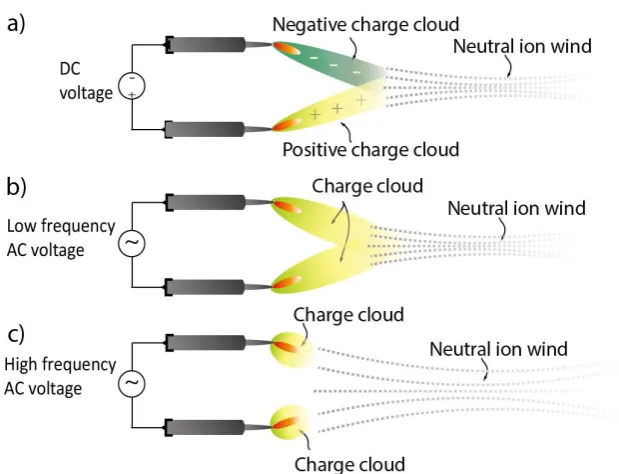
The mechanism of bipolar discharge using parallel pin electrodes driven DC high voltage has been established and described in our previous publications51,52. In the DC based regime, the flows of oppositely charged ions generated at the electrode tips impinge on each other and recombine within the inter-electrode space, create a steady ion wind flow. The electrode separation is a governing parameter of this regime because it allows to determine the impact angle of the oppositely charged flows as well as the corona generation due to electric field strength at the electrode tips, therefore defining the total wind flow. The mechanism of DC driven bipolar discharge is schematically described in Figure 3a.
Figure 3. Schematic of driving frequency on the system: (a) at DC the ion cloud extends
toward the electrode interspace where it is consumed, (b) with frequency increase, the ion
cloud extends, however it is consumed by the ion recombination with charge generated by
[image:3.595.146.456.79.316.2]4
Our experiment showed that the mechanism of AC driven bipolar discharge at low frequencies is not different from the DC driven system as described by the schematics in Figure 3b. With low switching frequencies the space charge has sufficient time to diffuse and its additional effect is negligible in time scales compared with the switching frequency. On the other hand, the accumulated space charge plays a significant role when the AC frequency increases. The ion cloud becomes more localized because of the recombination with the ions generated in the previous half cycle. As described in Figure 3c, for a given polarity, charge is generated similarly as in DC regime, subsequently moving away from the electrode under the influence of the electric field. When the polarity changes, the opposite charge from the previous half-cycle will exert an additional electrostatic force. This additional electric field increases with increasing frequency until it overcomes the electric field defined by the opposite electrode, and at this stage the electric field driving the ion wind becomes independent of the electrode separation. Intuitively, it can be seen that there is a limit to the enhancement of the electric field and subsequent ion wind generation by increasing frequency. At even higher frequencies, where the time of ion drift between the electrodes is comparable with the half cycle of the applied frequency, the corona discharge is not fully created and the ion cloud is not generated.
The experiment is schematically shown in Figure 2. A symmetrical electrode configuration is set up using two stainless steel pins (SUS304, each 8.0 mm long and 0.4 mm in diameter) placed in parallel with spherical radius of pin tips of 80 µm. The distance of electrode separation is adjustable using a three-axis movable stage TSD-40DC (OptoSigma, resolution of 0.1 mm). Since the two electrodes are electrically isolated from the stage, the leak current measured between the pin contact points is less than 10 nA.
In order to determine the velocity of the generated ion wind, an aerodynamically shaped collector of ion wind with outlet gate of 15×15 mm2 is set up as shown in Figure 2. A thermal anemometer ISA-90N (Sibata Scientific Technology Ltd.) is located 10 mm away from the end of the wind collector.
Time-varying electric potentials are applied to the electrodes using a high voltage amplifier HVA 4321 (NF Corporation) driven by a function generator 33522A (Keysight Technologies). The waveform of the system is investigated for a frequency range of 0.1 Hz to 1500 Hz using sinusoidal and square waveform functions with a slew rate of 500 V/µs.
3.
Experimental results and Discussions
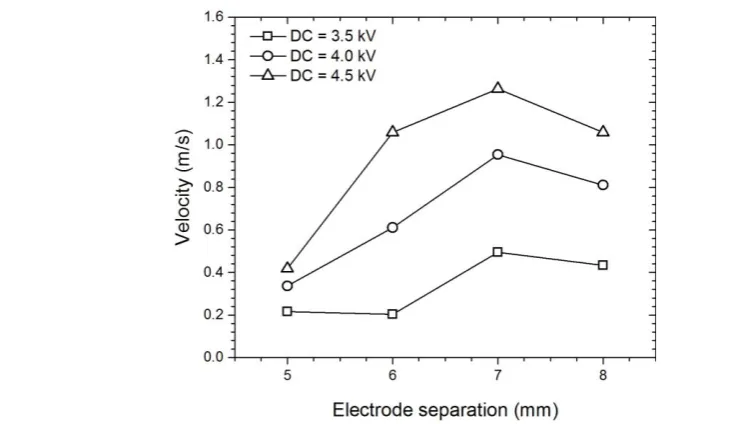
[image:4.595.97.465.72.284.2]In the DC driven regime, the ion wind velocity strongly depends on the electrode separation as shown in Figure 4. Firstly, the ion wind rapidly increases with the increase of electrode separation until it reaches
5
an optimized distance beyond which the velocity decreases. The experimental results show that the optimized separation of electrodes is about 7 mm where the velocity of the ion wind reaches maximum values of 0.4 m/s, 0.95 m/s and 1.25 m/s for DC applied voltages of 3.5 kV, 4.0 kV and 4.5 kV, respectively. This characteristic makes the DC driven regime susceptible to the tolerances in manufacturing and assembling of electrodes.
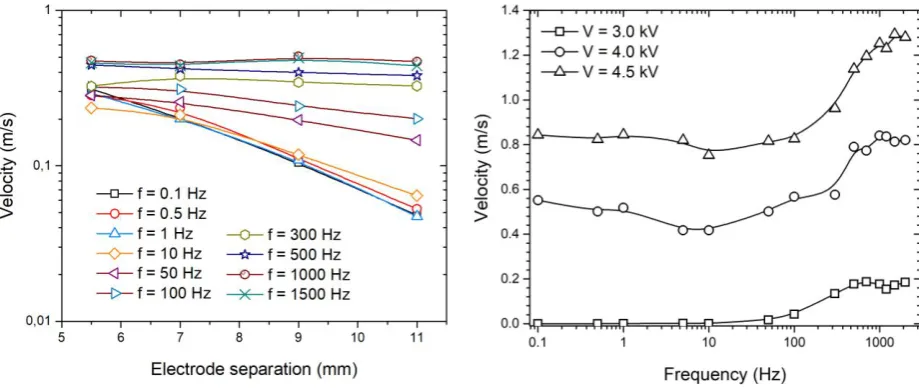
The influence of electrode separation on the ion wind velocity is studied in Figure 5a, where the relationship is considered for frequencies ranging from 0.1 Hz to 1500 Hz using square waveform. At low frequencies, the ion wind velocity U decreases with increasing electrode separation s. However, at high frequencies (above 1000 Hz for V = 4.0 kV), the ion wind velocity is constant and thus, independent of the electrode separation. Experimental results also show that there is a smooth transition of the ion wind velocity at intermediate frequencies between the two regimes generating ion winds using the low frequency and the high frequency driven corona discharge.
Figure 5b presents the relationship between the ion wind velocity and the frequency of AC driven system for an electrode separation of 6 mm and three different applied voltages of 3.0 kV, 4.0 kV and 4.5 kV square waves. The results indicate that the ion wind velocity is almost independent of the driving frequency at very low frequencies (less than 10 Hz as shown in Figure 5b). Furthermore, the experiment confirms that an onset voltage higher than 3.0 kV is required for the discharge operation at such low frequencies, where the discharge mechanism is not principally different from the DC driven bipolar corona discharge.51In this regime, switching the applied voltage polarity weakens the electric field and yields a momentary disruption to the ion flow, hence a slight decrease of the ion wind velocity is observed below 10Hz. However at moderate frequencies above 100 Hz, the increased frequency yields an increase in ion wind velocity. This indicates that the space charge enhances the electric field. With a further increase of the frequency, the ion wind velocity gradually becomes independent of the AC frequency.
Furthermore, Figures 5a and 5b yield another interesting result. For a given applied voltage, there is a threshold frequency above which the ion wind velocity is independent of both the driving frequency and electrode separation. This threshold value slightly increases with the increase of applied voltage. As an example, with the applied voltage of 4.5 kV, the threshold frequency is approximately 1100 Hz, and above this value only the applied voltage affects the ion wind speed.
Figure 5a. Relation between ion wind velocity and electrode separation at different applied frequencies and with applied voltage of 4.0 kV (square waveform).
[image:5.595.72.532.75.270.2]6
The experiment is repeated with the same parameters as above using AC sinusoidal waveform. Results in Figure 6a show that the ion wind velocity is stronger when square waveform is used, which is understandable as for the sinusoidal waveform the time, where the voltage is below the threshold level for generating corona discharge is much longer. On the other hand, relationships between the ion wind velocity and electrode separation, frequency and applied voltage are similar with those of square waveform. As the frequency increases, the influence of electrode separation on the ion wind velocity decreases as shown in Figure 6b.
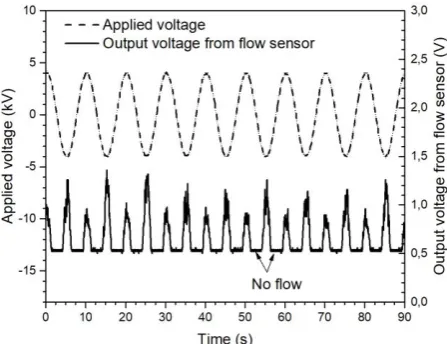
Figure 6c shows the time evolution of the output voltage by the flow sensor and the applied voltage with electrode separation of 6 mm, applied voltage of 4 kV and AC sinusoidal waveform frequency of 0.1 Hz. The time evolution of ion wind voltage shows that the ion wind is successfully generated in every half cycle in synch with the variation of applied voltage, when the induced electric field is above the threshold value required for discharge generation. In addition, there is a difference of the ion wind speed in the two successive halves of a cycle. This can be explained by the difference in creating positive
Figure 6a. Relationship between the ion wind velocity and frequency with several different electrode separations and applied peak voltage of 4.0 kV for both the sinusoidal and square waveforms.
Figure 6b. Relationship between the ion wind velocity and electrode separation with several different sinusoidal waveform frequencies and applied voltage of 4.0 kV .
Figure 6c. Time evolution of ion wind speed presented by the flow sensor voltage, measured with electrode separation of 6.0 mm, applied voltage of 4.0 kV and AC sinusoidal waveform
frequency of 0.1 Hz: The ion wind generated over every half cycle at peak voltage. The output
[image:6.595.291.517.74.264.2] [image:6.595.51.276.76.267.2] [image:6.595.173.397.340.512.2]7
and negative discharges with the same experimental conditions (Enloe 2004 47, Bouef 200545, Pon 200541 and Likhanskii 2006 58). Even if the two electrodes have the same geometrical shape, a small difference between the electrodes (manufacturing or tolerance) generates different positive and negative coronas when the electrode polarity changes. This result demonstrates that the use of AC driven corona discharge ensures a stabilized system less dependent on the geometry of electrodes. Furthermore, the velocity of ion wind can be maintained at lower applied voltages.
Based on the above results, a range of frequencies from 800 Hz to 1500 Hz has been established for the most optimized velocity of ion wind, which is in good agreement with the frequencies as cited in AC-driven corona generated ion wind literature21,48–50 . The frequency range is related to the enhancement of the electric field on the ion wind cloud 59. Unlike the DC driven system, ions generated by AC driven regime tend to localize with the increase of the applied voltage frequency due to a recombination of ions occurring at the region close to the electrodes. From a sufficiently high frequency limit, ions generated from one electrode do not reach the absorbing zone where the ions would be recombined with ions from the other electrode. Instead, ions of the same electrode recombine with each other. In this case, ions from one electrode distribute in a space characterized by a length scale . This length scale can be roughly predicted as , where is the dimensionless
parameter characterizing the rates of ion recombination and ion screening 21,60.
With the ion mobility ; the rate constant for the process of ion-ion recombination, V = 4 kV and f = 1500 Hz, is calculated as 12 mm. The result is in relatively good agreement with the distance from the electrode to the impingement region of ion wind jet obtained by the simulation in the next section. At this frequency (1500 Hz), it is reasonable to assume that the corona discharge regime transits from DC driven regime to AC driven regime. However, the result is only an approximation as it neglects the effect of the mutual influence of pins in our bipolar configuration.
4.
Numerical simulation
A numerical simulation has been conducted to consider the effect of space charge on the properties of ion wind in more detail. The equation system describing the bipolar ionized field includes
(1)
(2)
(3)
, (4)
Where and are the charge densities of positive and negative ions of the current density caused by the ion drift ( ) and the ion convection ( ); is the charge of electron; is the velocity of air drifted by the motion of charges and is the
permittivity of the air. The electric field is a function of the electric potential by the Gauss law
; p is the pressure, is the kinematic viscosity, and is
the air density.
The equations (1)-(4) are solved for the potential , space charge density , ion wind velocity as functions of the space and time following the applied AC current. However, this simulation requires high computing time because of the time scale difference between the discharge process (
and the momentum transfer of the flow ( . Since the aim of this simulation is to
8
The initial condition of the corona discharge is set up as the boundary condition at the electrodes with assumptions that the charge density is constant and determined as a function of the current iexp measured from the curve of I-V experimental characteristics as follows.
, (5)
where A is the total area of electrodes on which the electric field magnitude is greater than the onset electric field 61. The charge density is then applied to the tips of electrodes of which is higher
than . Furthermore, in the simulation a monitoring probe is set up relatively close the negative
electrode outside the ionization region, at a position of (0.5 mm, 0.25 mm) away from the negative electrode tip and towards the positive electrode as shown in Figure 7. The simulated results are obtained using our solver which was developed using the OpenFOAM library based finite volume method 62.
[image:8.595.78.459.78.266.2]Figure 7. Simulation schematics showing the negative electrode and probe point for monitoring. The outer cylinder is plot to schematic demonstrative of the configuration. In the simulation, the cylinder is 30 times larger than the electrode separation. Simulated data at monitoring point is recorded during transient simulation.
[image:8.595.85.447.344.556.2]9
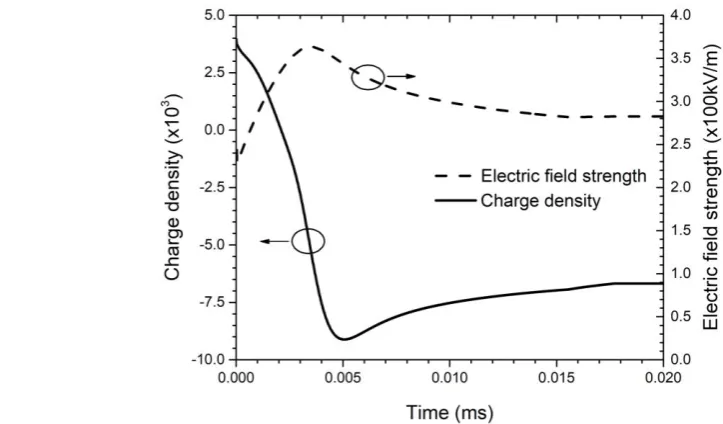
Figure 8 presents the simulated result recorded at the probe point where the space charge quickly changes from positive to negative peak and then reaches to a slight saturation due to the charge recombination. Results by the simulation show an enhancement of the electric field during the transition of charge polarity, i.e. while the positive charge moves away from the probe, the opposite charge reaches to the probe. This enhancement is gradually decreasing because of the charge dissipation in the electrode interspace. However, as shown in Figure 9, the ion wind velocity does not increase during the computed time. This can be explained by the significant difference of the time scale of flow momentum transfer compared with the transfer of charge. In the steady state simulation, assuming the maximum ion wind velocity of about 1.5 m/s, ions need at least 0.36 ms to reach the
probe, which is outside of the presented time scale.
5.
Conclusions
In this work, we reported the development of an AC driven bipolar ion wind generator using symmetric configuration with two parallel electrodes. The analysis of the system by our experimental work and numerical simulation showed that the velocity of ion wind generated by the system can be controlled by both the amplitude and frequency of the applied voltage, and the electrode separation does not significantly affect the characteristic of ion wind with AC driven voltages. Most notably, the ion wind does not depend on the electrode separation when the AC frequency exceeds a threshold value. Furthermore, our numerical simulation demonstrates that the effect of electric field is significantly enhanced with AC driven system and the ion wind generated by AC driven system is fully symmetrical and neutralized compared with the DC regime.
Acknowledgement
Tung Thanh Bui would like to thank Vietnam National Foundation for Science and Technology Development (NAFOSTED) for financial support under grant 107.99-2016.36.
Reference
1
E. Moreau, J. Phys. D. Appl. Phys. 40, 605 (2007).
2
T.C. Corke, C.L. Enloe, and S.P. Wilkinson, Annu. Rev. Fluid Mech. 42, 505 (2010).
3
D.F. Opaits, NASA Rep. NASA/CR (2012).
4
A. Alamgholilou and E. Esmaeilzadeh, Exp. Therm. Fluid Sci. 38, 61 (2012).
5
D.B. Go, T.S. Fisher, and S. V Garimella, J. Phys. D. Appl. Phys. 42, 55203 (2009).
6
K.G. Kibler and H.G. Carter, J. Appl. Phys. 45, 4436 (1974).
7
A. Rashkovan, E. Sher, and H. Kalman, Appl. Therm. Eng. 22, 1587 (2002).
8
[image:9.595.79.528.219.380.2]A.A. Martins, J. Electrostat. 71, 61 (2013).
Figure 9. Ion wind velocity at time 0.02 ms after switching the polarity of electrodes .
Negative pin
Positive pin
Ion winds
s
10
9
L. Zhao and K. Adamiak, J. Electrostat. 63, 729 (2005).
10
A.A. Martins and M.J. Pinheiro, Phys. Plasmas 18, 33512 (2011).
11
O.M. Stuetzer, J. Appl. Phys. 31, 136 (1960).
12
M. Rickard, D. Dunn-Rankin, F. Weinberg, and F. Carleton, J. Electrostat. 63, 711 (2005).
13
M. Meziane, O. Eichwald, J.P. Sarrette, O. Ducasse, M. Yousfi, and F. Marchal, J. Appl. Phys. 113, 0 (2013).
14
H. Ait Said, H. Nouri, and Y. Zebboudj, J. Electrostat. 73, 19 (2015).
15
B. Chua and J.J. Pak, Sensors Actuators A Phys. 224, 65 (2015).
16
P. Béquin, V. Joly, and P. Herzog, J. Phys. D. Appl. Phys. 46, 175204 (2013).
17
T.H. Kim and S.J. Kim, Sensors Actuators, A Phys. 167, 297 (2011).
18
L. Li, S.J. Lee, W. Kim, and D. Kim, J. Electrostat. 73, 125 (2015).
19
P. Giubbilini, J. Appl. Phys. 64, 3730 (1988).
20
H. Kawamoto and S. Umezu, J. Electrostat. 66, 445 (2008).
21
A.M. Drews, L. Cademartiri, G.M. Whitesides, and K.J.M. Bishop, J. Appl. Phys. 114, (2013).
22
B.L. Henson, J. Appl. Phys. 55, 150 (1984).
23
G.F.L. Ferreira, O.N. Oliveira, and J. a. Giacometti, J. Appl. Phys. 59, 3045 (1986).
24
, J. Paillol, and N. Soulem, J. Appl. Phys. 95, 3943 (2004).
25 J. Zhang and F.C. Lai, J. Electrostat. 69, 486 (2011). 26
H. Kawamoto, H. Yasuda, and S. Umezu, J. Electrostat. 64, 400 (2006).
27
A. Ongkodjojo Ong, A.R. Abramson, and N.C. Tien, J. Heat Transfer 136, 61703 (2014).
28
M. Rickard, D. Dunn-Rankin, F. Weinberg, and F. Carleton, J. Electrostat. 64, 368 (2006).
29
I.Y. Chen, M.Z. Guo, K.S. Yang, and C.C. Wang, Int. J. Heat Mass Transf. 57, 285 (2013).
30
K. Yamada, J. Appl. Phys. 96, 2472 (2004).
31
D.B. Go, S. V. Garimella, T.S. Fisher, and R.K. Mongia, J. Appl. Phys. 102, (2007).
32
R. Tirumala, Y. Li, D. a. Pohlman, and D.B. Go, J. Electrostat. 69, 36 (2011).
33
Y. Zebboudj and R. Ikene, Eur. Phys. J. Appl. Phys. 10, 211 (2000).
34
C. Kim, K.C. Noh, S.Y. Kim, and J. Hwang, Appl. Phys. Lett. 99, 2013 (2011).
35
J.S. Cotton, A.J. Robinson, M. Shoukri, and J.S. Chang, Exp. Therm. Fluid Sci. 41, 31 (2012).
36
D.F. Colas, A. Ferret, D.Z. Pai, D. a. Lacoste, and C.O. Laux, J. Appl. Phys. 108, 0 (2010).
37
C. Kim, D. Park, K.C. Noh, and J. Hwang, J. Electrostat. 68, 36 (2010).
38
A.K.M.M.H. Mazumder and F.C. Lai, IEEE Trans. Ind. Appl. 50, 2296 (2014).
39
K. Nishiyama and H. Kuninaka, Trans. Japan Soc. Aeronaut. Sp. Sci. Aerosp. Technol. Japan 10, Tb_1 (2012).
40
D.M. Goebel and I. Katz, Fundamentals of Electric Propulsion: Ion and Hall Thrusters (John Wiley & Sons, Hoboken, New Jersey, 2008).
41
J. Pons, E. Moreau, and G. Touchard, J. Phys. D. Appl. Phys. 38, 3635 (2005).
42
J.P. Boeuf and L.C. Pitchford, J. Appl. Phys. 97, (2005).
43
H. Aono, S. Yamakawa, K. Iwamura, S. Honami, and H. Ishikawa, Exp. Therm. Fluid Sci. 88, 16 (2017).
44
Y. Lagmich, T. Callegari, T. Unfer, L.C. Pitchford, and J.P. Boeuf, Appl. Phys. Lett. 90, 51502 (2007).
45
J.P. Boeuf, Y. Lagmich, T. Unfer, T. Callegari, and L.C. Pitchford, J. Phys. D. Appl. Phys. 40, 652 (2007).
46
J.P. Boeuf, Y. Lagmich, and L.C. Pitchford, J. Appl. Phys. 106, 0 (2009).
47
C.L. Enloe, T.E. McLaughlin, R.D. Van Dyken, K.D. Kachner, E.J. Jumper, T.C. Corke, M. Post, and O. Haddad, AIAA J. 42, 595 (2004).
48
B. Kim, S. Lee, Y.S. Lee, and K.H. Kang, J. Electrostat. 70, 438 (2012).
49
S. Ohyama and R. Ohyama, Annu. Rep. - Conf. Electr. Insul. Dielectr. Phenomena, CEIDP 227 (2011).
50
R.I. Ohyama, K. Kaneko, and J.S. Chang, IEEE Trans. Dielectr. Electr. Insul. 10, 57 (2003).
51
V.T. Dau, T.X. Dinh, T.T. Bui, C.D. Tran, H.T. Phan, and T. Terebessy, Exp. Therm. Fluid Sci. 79, 52 (2016).
52
V.T. Dau, T.X. Dinh, T. Terebessy, and T.T. Bui, IEEE Trans. Plasma Sci. 44, 2979 (2016).
53
T.X. Dinh, D.B. Lam, C.-D. Tran, T.T. Bui, P.H. Pham, and V.T. Dau, Mechatronics 47, 126 (2017).
54
11
55
V.T. Dau, T.X. Dinh, T.T. Bui, and T. Terebessy, Flow Meas. Instrum. 50, 252 (2016).
56
V.T. Dau, T.X. Dinh, T. Terebessy, and T.T. Bui, Sensors Actuators A Phys. 244, 146 (2016).
57
V.T. Dau, T.T. Bui, T.X. Dinh, and T. Terebessy, Sensors Actuators A Phys. 237, 81 (2016).
58
A. V. Likhanskii, M.N. Shneider, S.O. Macheret, and R.B. Miles, 44th AIAA Aerosp. Sci. Meet. Exhib. 1 (2006).
59
L.Y.L. Yeo, D. Hou, S. Maheshswari, and H.-C.C. Chang, Appl. Phys. Lett. 88, 2006 (2006).
60
A.M. Drews, L. Cademartiri, M.L. Chemama, M.P. Brenner, G.M. Whitesides, and K.J.M. Bishop, Phys. Rev. E 86, 36314 (2012).
61
J.S. Chang, P. a. Lawless, and T. Yamamoto, IEEE Trans. Plasma Sci. 19, 1152 (1991).
62