1
TO STUDY THE INFLAMMATORY MARKERS IN ACTIVE PULMONARY TUBERCULOSIS, IT’S CORRELATION WTH DISEASE SEVERITY AND IT’S
RESPONSE TO ANTI TUBERCULAR TREATMENT
Dissertation submitted to The Tamil Nadu Dr. M.G.R. Medical University in partial fulfillment of the requirements for the degree of
Doctor of Medicine (M.D) in Tuberculosis and Respiratory Diseases
Branch – XVII
GOVERNMENT KILPAUK MEDICAL COLLEGE & HOSPITAL CHENNAI, TAMIL NADU
2
BONAFIDE CERTIFICATE
This is to certify that the dissertation “To study the inflammatory markers in active pulmonary tuberculosis, it’s correlation with disease severity and its response to anti tubercular treatment” is the Bonafide work done by Dr. K.RAJARAJESWARI during her MD (Tuberculosis and Respiratory Diseases) course from May 2016 to April 2019 at Government Kilpauk Medical College, Chennai.
Assoc Prof. Dr. P.M.RAMESH, M.D (TB&RD),
Associate Professor and Head, Department of TB & Respiratory Diseases, Government Kilpauk Medical College,
3
DECLARATION BY THE GUIDE
This is to certify that the dissertation titled “To study the inflammatory markers in active pulmonary tuberculosis, it’s correlation with disease severity and its response to anti tubercular treatment” is the bonafide work done by DR.K.RAJARAJESWARI, during her MD (Tuberculosis and Respiratory Diseases) course in the academic years 2016-2019 at Government Kilpauk Medical College, Chennai, under my guidance
Signature of the Guide,
Name and Designation of the Guide:
Assoc Prof. Dr. P. M. RAMESH, M.D (TB & RD) HOD, Department of TB and Respiratory Diseases, Government Kilpauk Medical College,
4
GOVERNMENT KILPAUK MEDICAL COLLEGE AND HOSPITAL,
KILPAUK, CHENNAI-10
DECLARATION BY THE SCHOLAR
I, Dr. K.RAJARAJESWARI, solemnly declare that the dissertation titled “To study the inflammatory markers in active pulmonary tuberculosis, it’s correlation with disease severity and its response to anti tubercular treatment” has been prepared by me. This is submitted to “The Tamil Nadu Dr. M.G.R. Medical University, Chennai” in partial fulfillment of the requirement for the award of M.D degree examination branch XVII Tuberculosis and Respiratory Diseases from May 2016 to April 2019.
5
ACKNOWLEDGEMENT
At the outset, I wish to thank our beloved Dean Dr. P.Vasanthamani M.D;DGO for permitting me to conduct this study as a part of my dissertation.
I wish to express my due respect and gratitude to Dr.P.M.Ramesh, Associate Professor & HOD, Department of TB and Respiratory Diseases, Government Kilpauk Medical College and who is my guide for his generous support, guidance and encouragement for this study and helping me complete my work more efficiently.
I offer my heartfelt thanks to our Deputy Superintendent Dr.G.Allwyn Vijay and our former HODs, Prof. Dr. N. Nalini Jayanthi, M.D (TB&RD), D.T.R.D, and Prof. Dr. A. Chitra Kumar, M.D, DCH Department of TB and Respiratory Diseases, Government Kilpauk Medical College for their valuable advice and guidance throughout my post graduate course.
I sincerely thank my Assistant Professors and Tutors for their constant encouragement, timely help and critical suggestions throughout the study
I would be failing miserably in my duty if I don’t place my sincere thanks to those who were the subjects of my study.
I extend my love and gratitude to my Co PGs, senior and Junior PGs, My parents and my husband who were the source of my strength and energy.
6
S.no
Topic
Page no
1
Introduction
7
2
Review of literature
20
3
Methodology
38
4
Results
58
5
Discussion
80
6
Conclusion
85
7
Bibliography
87
8
Annexures
(i)Abbreviations
(ii)Proforma
( iii)master chart with keys
( iv)Ethical committee approval
certificate
7
8
TUBERCULOSIS thought to be one of the oldest human diseases, the history of TB is atleast as old as the mankind over the years, not only the medical implications but also the social and economic impact of TB has been TUBERCULOSIS has been a major cause of suffering and death since times immemorial. (1)
At the dawn of the new millennium, we are still mute witnessess to the silent yet efficient march of this sagacious disease, its myriad manifestationsand above all its unequalled ,vicious killing power through the millennia.TB never ever disappeared from the developing world.(1)
Most technologically advanced world has seen more than a century of declining incidence of tuberculosis but the less developed world has not been so fortunate and in those populous regions TB incidence is increasing. In acquired immunodeficiency region (AIDS) stricken regions – sub Saharan Africa, For example –TB case rates now are 50-100 times those in North America and Europe. Spurred by immune deficiencies resulting from HIV infection, these case rates will continue to increase in coming decades.
9
In pulmonary tuberculosis patients are dependent on sputum smear/culture based monitoring of treatment, but this will be challenging to use in extra pulmonary TB, and in patients with pauci -bacillary disease such as is seen in HIV-coinfected patients and in children. Both sputum volume and quality decreases in response to treatment and many patients cannot provide sputum samples for culture/smear after a few weeks of treatment. The development of non-sputum-based biomarkers of treatment response would represent an advance for individual monitoring of TB patients.
10
BURDEN OF TUBERCULOSIS
The regions shown in red are very high burden countries, that is the incidence rate is >300//1,00,000, they are mostly African countries. India belongs belong to high burden country having incidence rate of> 200-300 per 1 lac people.
11
mycobacterium tuberculosis (prevalence of infection). It is estimated that there are 2.5 million prevalent cases of all form of tuberculosis. it is also estimated 2.2 lakhs people die of TB annually.
Incidence Prevalence mortality
Global 9.6 million
176/lac year
13 million 227/lac /year
1.1million 21/lac /year
India 2.2 million
167/lac/year
2.5 million 197/ lac/year
2.2 lakhs 17/ lac/year
Tuberculosis (TB) is one of the top 10 causes of death worldwide.
In 2017, 10 million people fell ill with TB, and 1.6 million died from the disease (including 0.3 million among people with HIV).
Millions of people fall sick with TB each year,there were cases and age groups but overall 90% were adults,9% were those living with HIV and 2/3rd were in eight countries ; INDIA (27%),china (9%),Indonesia (8%), the Philippines, Pakistan, Nigeria, Bangladesh, and South Africa amounting to 4-7 %
In 2017, an estimated 1 million children became ill with TB and 230 000 children died of TB (including children with HIV associated TB).
12
TB is a leading killer of HIV-positive people: in 2016, 40% of HIV deaths were due to TB.
Multidrug-resistant TB (MDR-TB) remains a public health crisis and a health security threat. WHO estimates that there were 5,58 000 new cases with resistance to rifampicin – the most effective first-line drug, of which - 82% had MDR-TB.
Globally, TB incidence is falling at about 2% per year. This needs to accelerate to a 4–5% annual decline to reach the 2020 milestones of the End TB Strategy
An estimated 54 million lives were saved through TB diagnosis and treatment between 2000 and 2017.
Ending the TB epidemic by 2030 is among the health targets of the Sustainable Development Goals (12)
Impact Indicators for the National Strategic Plan 2017 – 2025
13
TUBERCULOSIS IMMUNO PATHOGENESIS
TB is a communicable infectious disease, spread almost exclusively by coughed aerosols carrying pathogens from the mycobacterium tuberculosis complex. TB is characterized pathologically by necrotizing granulomatous inflammation usually in the lung, although any extra pulmonary site can be involved.
Protective immunity and varied clinical manifestations of infection with mycobacterium tuberculosis represent a delicate balance between the bacillus and the type as well as magnitude of immune response elicited by the host.(1)The immune system is extremely complex and some of the intricacies of its function are not completely understood.Essentially tuberculosis is a struggle between the macrophage and bacilli(2)
The epidemiology of TB in a community is the resultantof the interplay between the
environmental conditions,socioeconomic state of the population, the host factorsand the
agent characteristics. The course of the eventsfollowing infection as observed in
14
The above figure shows the natural history of tuberculosis.
EVENTS DURING TB INFECTION
. Broadly, TB infection is divided into four phases: First phase includes an initial
establishment of Mycobacterium tuberculosis infection in the resident macrophages
[alveolar]. This is followed by influx of PMNs, which prevents Mycobacterium
tuberculosis to escape from the innate immune factors. Subsequently, monocytes are
recruited to the site of infection/ pathological site [second phase]. Third phase includes
15
elongated epithelioid cells. These are surrounded by T-cells. This is aimed at restricting
the bacilli from spreading. The fourth and terminal phase includes dissemination of
bacilli. Defective granuloma formation promotes release of bacilli from control of
immune system. Organs/loci targeted by bacilli after dissemination are listed
The cytokine network and its interactions are complex in the setting of infection by mycobacterium tuberculosis. Conventional understanding supports a pivotal role for cytokines in the overall immune responses to TB. Although cytokines are produced by the wide variety of cells, primed lymphocytes are the major producers. Particularly two sub populations of CD4+ T lymphocytes - the T helper type 1 (TH) cells that produce IL-2 , IFN –gamma, lympho-toxin alpha,and other proinflammatory cytokines,and the T helper type 2 (TH-2 ), cells that produce IL-4,IL-5,IL-10,IL-13,and other anti-inflammatory cytokines.(3)
16
17
18
Orchestration of effector immune component in building up response against
Mycobacterium tuberculosis. Priming of T-cellsfor effector functions requires
recognition by activated macrophages with stimulation by a battery of potentiating
cytokines [IL-12, IL-6, IL-1β etc.,] released by the infected macrophages. The response
of effector T-cells will decide the extreme/polarity of upcoming disease pathogenesis.
Regulatory T-cells [CD4+CD25+FoxP3+ T-cells, natural killer T-cells etc.,] can also
modulate the protective effector T cell responses either in a contact
19
The inflammatory reaction is accompanied by a systemic response known as acute phase response (APR).This response is characterized by fever, production of different types of hormones, leukocytosis and protein synthesis in series, which is rapidly regulated mainly in hepatocytes under the control of cytokines arising from the site of the pathology. Thus this acute phase response bring about alteration in hematological indices like leukocytosis, neutrophilia, lymphopenia, thrombocytosis, red cell distribution width, platelet distribution width, haematocrit, plateletocrit, erythrocyte sedimentation rate, etc. and acute protein like c-reactive protein ,serum amyloid A etc. These serum markers of inflammation rise above the range of normal during active infection at par with the severity of infection and will fall when the infection severity comes down.
In pulmonary tuberculosis patients are dependent on sputum smear /culture based monitoring of treatment,but this will be challenging to use in extra pulmonary TB, and in patients with pauci -bacillary disease such as is seen in HIV-coinfected patients and in children. Both sputum volume and quality decreases in response to treatment and many patients cannot provide sputum samples for culture/smear after a few weeks of treatment. The development of non-sputum-based biomarkers of treatment response would represent an advance for individual monitoring of TB patients.
20
21
In a study done by Abakay o et al inflammation on 2015…..they aimed to investigate the correlation between red cell distribution width (RDW), neutrophil to lymphocyte ratio (NLR), platelet to lymphocyte ratio (PLR), and other inflammatory markers with PTB severity. 70 patients with active PTB were compared with 50 age and gender matched healthy control people without any illness. The mean age of PTB patients in their study were 50.4 ± 21.8 years. There were no significant differences in terms of age, gender, and smoking history between PTB patients and controls. Patients with advanced PTB had a significantly higher white blood cell count, neutrophil count, Red cell distribution width, Neutrophil lymphocyte ratio, and CRP. When compared to patients with mild to moderate PTB. RDW (17.7 versus 15.7 %, p=0.002) and NLR (4.7 versus 3.1, p=0.009) values were higher in patients with advanced PTB as opposed to patients with mild to moderate PTB. NLR and RDW levels may be used as markers of inflammation to help clinically manage patients with TB and to determine disease severity(9)
22
and SAA values on admission and radiological and microbiological findings and T-cell profiles were assessed. Th1/Th2 and Tc1/Tc2 were determined by analyzing intracellular cytokine staining for IFN-gamma and IL-4 in blood CD4+ and CD8+ T cells using flow cytometry after stimulation with PMA and ionomycin. There found a significant correlations between ESR, CRP, and SAA of which the correlation between CRP and Serum amyloid A was strong (r = 0.88). CRP values significantly correlated with the sputum smear scale and the extent of lesions, and were higher in bilateral lesions. SAA values correlated with the sputum smear scale, whereas all markers were higher in patients with pleural effusion. Both CRP and SAA levels negatively correlated with the ratio of Th1/Th2. In contrast, ESR negatively correlated with the ratio of Tc1/Tc2.C reactive protein reflected the disease severity before treatment. CRP and SAA values were associated with helper T-cell proportions whereas ESR was associated with cytotoxic T-cell proportions, both being type 2 predominant. (10)
23
baseline. The markers Levels decreased further at 2 months to 7.70±4.29 mg/dl and 2.41±1.5 mg/dl at end of 6 months (p < 0.001)
The mean Serum Interferon -¥ levels in cases at baseline were 41.47±43.25 pg/ml compared to the controls 1.81±1.6 pg/ml (p < 0.003). After treatment at 2 months the serum IFN-¥ levels after was 12.53±8.33 pg/ml and at end of 6 months it was 2.47±1.55 pg/ml (p < 0.001). Serum Interferon-¥ levels was comparable to controls at the end of 6 months. Mean sputum IFN-¥ levels at baseline was 24.92±16.53 pg/ml. It decreased after 2 months of treatment to 7.68±5.17 pg/ml and at end of 6 months to 3.86±3.12 pg/ml (p < 0.001).thus they concluded that the Patients with pulmonary TB have significantly elevated serum CRP and IFN-¥ levels compared to normal controls and levels of these makers decrease significantly with treatment. Hence they concluded serum CRP and IFN-¥ (both serum and sputum) may be useful in early detection of disease and in monitoring the response.(13)
24
evolutions were noted in the term of six months in the majority of patients with CRP <50 mg / l (11 cases vs 10 cases). In 4 patients with elevated CRP, there was a delay (more than1month) to bacilli become negative. Thus CRP can be used as marker of disease activity and to assess treatment response.(15)
In a study done at Ethiopia..bamalkku et al…..Their aim of the study was to determine
hematological profiles of TB patients before and after intensive phase treatment. The hematological profiles of TB patients studied. They showed statistically significant difference in
hematocrit (38.5 % versus 35.7 %), hemoglobin (12.7 g/lversus11.8 g/l) and platelet
(268 × 103/μlversus239 × 103/μl) values of patients before initiation of treatment and after
completion of the intensive phase of tuberculosis treatment, respectively. The red cell
distribution width (RDW) of treatment naïve TB patients was by far lower
(17)(17.6 ± 7.09 %) than the corresponding RDW (31.9 ± 5.19 %) of intensive phase
treatment completed patients. Among TB patients that had high platelet distribution width
(PDW) (n = 11) before initiation of TB treatment, 10 demonstrated lower PDW values
after completion of the intensive phase. There was no significant difference on total white
blood cell count among TB patients before and after completion of the 2 month
treatment.They concluded that the hematological abnormalities in TB patients to be
25
resulted from TB treatment should be assessed continuously throughout the course of tuberculosis therapy.16)
In a study done by marina oliveria et al…..in patients with active pulmonary tuberculosis they found low hemoglobin levels (mean, 10.86 ± 2.04 g/dL) in 89.2% of patients; low transferrin levels (mean, 177.28 ± 58.71 mg/dL) in 65.3%; and low MCV (mean, 82.00 ± 7.77 fL) in 39.7%. In addition, we found high ferritin levels (mean, 520.68 ± 284.26 ng/mL) in 52.7% of patients; high RDW (mean, 16.36 ± 3.47%) in 55.4%; high CRP levels (mean, 5.84 ± 4.22 mg/dL) in 98.2%; and high ESR (mean, 60.30 ± 39.84 mm/h) in 84.3%. they concluded that the prevalence of anemia gives rise to increased RDW.(17)
26
In a study done by pyrosila Miranda they studied 134 pulmonary TB patients …they measured ferritin and CRP levels …they found Circulating levels of both ferritin and CRP gradually decreased over time on ATT. At pre-treatment, concentrations of these parameters were unable to distinguish patients with positive from those with negative acid-fast bacilli (AFB) in sputum cultures. However, patients who remained with positive cultures at day 60 of ATT exhibited heightened levels of these inflammatory markers compared to those with negative cultures at that time point.CRP and Ferritin levels in serum may be useful to identify patients with positive cultures at day 60 of ATT (19)
27
of IL-2/IFN-γ ratios in the supernatant and the NLR might be useful biomarkers to evaluate the effectiveness of drug therapy in active TB patients.(20)
A study was done to explore the claim that anisocytosis as measured by the red blood cell volume distribution width (RDW) is raised in iron-deficiency anemia, but is normal in the anemia of chronic disorders. In a study done by banes et al Measurements were done for 283 normal patients, 22 iron-deficient patients, and 102 tuberculosis patients, using a model S plus Coulter Electronic Counter with standard calibration. Mean (+/- standard deviation values for RDW were as follows: normal patients, 7.36 (+/- 0.57); untreated patients iron deficiency, 10.39 (+/- 1.37); and 15 not treated anemic patients with tuberculosis, 10.44 (+/- 0.63). Mean values remained above 10.4 in 69 patients with tuberculosis during treatment, irrespective of whether or not the patients are anemic, but value ad fallen towards the normal mean (8.49 +/- 0.8) in the 18 subjects in whom it was measured at the end of therapy. By this time the mean corpuscular volume (MCV) and hemoglobin concentrations had risen to normal. It is concluded that Red cell distribution width values in the chronic inflammatory disorder tuberculosis are not significantly different from those occurring in iron-deficiency anemia.(21)
28
CRP with the maximum of 239 mg/l were found in 11.1% of patients. The values of CRP clearly correlated with the degree of intoxication, the presence and rate of bacterial discharge, the extent of the process, the absence or presence of decay. By the end of an intensive phase of chemotherapy (3 months) in case of its efficiency, the level of C reactive protein significantly decreased thus approaching to the upper clinical range (12.1 +/- 1.9 mg/l) whereas in ineffective treatment it was substantially unchanged (22)
In a study done by RAO et al they found that C-reactive protein levels were
significantly higher in smear-positive group as compared with the smear-negative group,
the values being 37.598 ± 23.195 and 5.40 ± 1.88 respectively (P < 0.0005). Among the
smear-positive patients, CRP levels were highest in Smear3+ group (60.00 ± 15.69) as
compared with the Smear2+ patients (35.83 ± 8.9) and Smear1+ (5 ± 7.86). Statistically,
the difference was found to be significant (P< 0.0005). Correlation of CRP levels with
extent of disease also revealed that these values were significantly higher in stage III
disease (52.44 ± 17.78) as compared with stage II (13.19 ± 13.03) and stage I disease (9.5
± 9.01). Serum CRP levels may have a role in identifying the advanced and extensive
disease patients thereby indirectly helping the health workers to pick up delayed
convertors/potential defaulters, so as to guide them to put in extra efforts on these groups,
in tuberculosis control programs.(23) In a study done by RAO et al they found
thatC-reactive protein levels were significantly higher in smear-positive group as compared
with the smear-negative group, the values being 37.598 ± 23.195 and 5.40 ± 1.88
29
Smear3+ group (60.00 ± 15.69) as compared with the Smear2+ patients (35.83 ± 8.9) and
Smear1+ (5 ± 7.86). Statistically, the difference was found to be significant (P< 0.0005).
Correlation of CRP levels with extent of disease also revealed that these values were
significantly higher in stage III disease (52.44 ± 17.78) as compared with stage II (13.19
± 13.03) and stage I disease (9.5 ± 9.01).Serum CRP levels may have a role in
identifying the advanced and extensive disease patients thereby indirectly helping the
health workers to pick up delayed convertors/potential defaulters, so as to guide them to
put in extra efforts on these groups, in tuberculosis control programs.(23)
30
In a study done by mohammed kalih sekh et al: The present study was conducted to evaluate the C-reactive protein (CRP) in patients with pulmonary tuberculosis at Liaquat University Hospital, Hyderabad, Pakistan. All patients with pulmonary tuberculosis > 12 years of age, of either gender were evaluated for their serum CRP level. During twelve months study period, 127 patients with pulmonary tuberculosis were evaluated for CRP level, of which 76 (60%) were males and 51 (40%) were females. The observed symptoms were cough and expectoration 115 (91%), weakness and constant fatigue 92(72%), weight loss 110 (86%), fever 90(71%), night sweats 85(67%), chest pain 95(75%), coughing up blood 98(77%), loss of appetite 88(69%), headache 102(80%) and combined / mixed symptoms 100(79%). The overall mean CRP in patients with TB was 9.87±4.83 where as it was 11.21±3.32 and 13.82±4.63 in male and female subjects respectively. The mean±SD of normal and raised serum CRP was 2.76±1.34 and 13.26±4.42 (p 0.01). The complications observed in patients with raised serum CRP were pneumothorax 04(4.7%), fibrosis 08(9.3%), miliary TB 06(7%), empyema 10(11.6%), fungal colonization within tuberculous cavity 09(10.5%), bronchiectasis 11(12.8%), more than 01 complication 11(12.8%) and Nil 19(22.1%). The present study detected elevation of CRP in pulmonary tuberculosis and a high CRP is clearly associated with more severe disease.(25)
31
32
In a study done by yoon et al …THEY identified nine unique studies enrolling 1793 adults from out-patient (five studies, 1121 patients) and in-patient settings (five studies, 672 patients), 72% of whom had confirmed HIV infection. Among out-patients, CRP had high sensitivity (93%, 95%CI 88-98) and moderate specificity (60%, 95%CI 40-75) for active PTB. Specificity was lowest among in-patients (21%, 95%CI 6-52) and highest among out-patients undergoing TB screening (range 58-81%). There was no difference in summary estimates by HIV status CRP, which is available as a simple, inexpensive and point-of-care test, can be used to screen PLHIV presenting for routine HIV/AIDS (acquired immune-deficiency syndrome) care for active TB.(27).
33
34
In a study done by Charles et al….They studied the extent and severity of hematological
and biochemical abnormalities which occurred in 265 patients with pulmonary tuberculosis, and records the hematological changes that occur with treatment. Anaemia was present in 60 per cent of patients, which more frequently in males than in females. Leucocytosis with neutrophilia occurred in 40 per cent, lymphopenia in 17 per cent and monocytopenia in 50 per cent. Platelet count and erythrocyte sedimentation rate were elevated in 52 and 80 per cent respectively. Bone marrow aspiration and trephine biopsy were of limited diagnostic value. Ferritin and vitamin B12 levels were increased in 94 and 57 per cent of subjects respectively whilst serum and red cell folic acid were within normal limits in 83 per cent. The frequency of the important biochemical changes were hyponatremia (43 per cent) and hypoalbuminemia (72 per cent); alkaline phosphatase, aspartic transaminase and lactic dehydrogenase levels were elevated in approximately a third of patients possibly due to unsuspected dissemination.
35
In a study done by singh kj et al…they felt that Hematological changes associated with tuberculosis have been incompletely investigated, so In the present study, they have compared peripheral blood and bone marrow findings in patients with disseminated/miliary tuberculosis (DTB/MTB) as well as pulmonary tuberculosis (PTB). They have also attempted to assess the effect of anti-tuberculosis therapy on the hematologic abnormalities. Thirty two patients with disseminated/miliary tuberculosis and 23 patients with pulmonary tuberculosis had been prospectively studied to determine the various hematological manifestations in tuberculosis and the effect of anti- tuberculosis therapy. All patients received standard antituberculosis treatment. They were subjected to a detailed hemogram including peripheral blood examination, which was repeated on completion of anti -tuberculous therapy. Bone marrow aspiration and biopsy was also done in all patients before starting ATT
36
granulomas in the bone marrow had certain significant differences as compared to patients without granulomas. These patients showed severe anemia, peripheral monocytopenia and bone marrow histiomonocytosis. The hemogram reverted to normal with antituberculosis therapy in these patients.
In view of the varied hematological abnormalities observed in patients with tuberculosis in this part of the world, they concluded that the differential diagnosis of tuberculosis should be entertained in patients with varied hematological disorders. (33)
37
38
39 PRIMARY OBJECTIVE:
To study the inflammatory markers in new sputum positive tuberculosis and its response to anti tubercular treatment.
SECONDARY OBJECTIVE:
To assess the correlation of mean levels of inflammatory markers with the disease severity.
AIM:
To prove that inflammatory marker levels reflects the disease severity and its decline reflects response to treatment, thus these inflammatory markers can be used as an adjunct in microbiologically confirmed TB cases and as a prime tool in clinically diagnosed cases .
SAMPLE SIZE:
The sample size was determined by using Open Epi software 2.1.3 Version with 95% confidence interval and considering 10% attrition rate sample size of 115 + 11.5 ≈ 127 samples will included in this study.
The estimated sample size was 127.
SUBJECT SELECTION:
40
Medical College (KMC), Government Royapettah Hospital (GRH), with newly detected sputum positive pulmonary tuberculosis.
Symptoms of pulmonary tuberculosis suspect are fever, weight loss, significant weight loss, hemoptysis any abnormalities in chest radiograph as per technical operational guidelines 2016.
Such patients suspected of pulmonary tuberculosis screened with sputum smear examination for acid fast bacilli and new sputum positive patients of pulmonary tuberculosis who are not taken anti tuberculous treatment before are selected for study.
INCLUSION CRITERIA :
Patients with new sputum positive pulmonary tuberculosis .
Age >18 < 70 years
EXCLUSION CRITERIA : patients with following co-morbidties
Previous anti tubercular treatment
COPD
Bronchial Asthma
Ischemic heart disease
Decompensated liver disease
41
Renal failure
Peripheral vascular disease
Patients with HIV
Patients with Collagen vascular disease&patients on chronic drugs
STUDY CENTRES:
The study was conducted at three tertiary care institutes
Government Thiruvoteeswarar hospital of thoracic medicine, chennai
Government Kilpauk Medical College, Chennai
Government Royapettah Hospital, Chennai.
STUDY DESIGN:
The study was a prospective cross sectional study.
No specific intervention was carried out.
No controls have been used in study.
SAMPLING:
Simple random sampling
DURATION OF STUDY: 6 months
42 HAZARDS OF STUDY: nil
DATA COLLECTION:
The data of each patient was collected on a proforma
Sl No: Date:
Name:
Age
Gender:
Address
Phone:
BMI: Underweight (< 18.5) Normal (18.5-24.9)
Overweight (25.0-29.9)Obese (>=30 )
Duration of symptoms:
Smoking history
Treatment CPR ESR NLR RDW Before Rx
At 2months
Treatment Sputum AFB
43
th
Presumptive pulmonary tuberculosis patients ( Cough, fever, hemoptysis ,abnormalities in chest xray, weight loss)
Sputum AFB examination
Positive
negative 1+ , 2+, 3+
Chest x ray excluded
ANTI TUBERCULOUS TEATMENT
2 months intensive phase
BEFORE TREATMENT INFLAMATORY MARKERS ESR, CRP, RDW, NLR.
DOTS 2 months
Adherence monitoring
AFTER 2 MONTHS SPUTUM AFB CHEST XRAY
INFLAMATORY MARKERS (ESR, CRP, RDW, NLR) MILD, MODERATE, SEVERE
METHODOLOGY
44
INFLAMMATORY MARKERS
C-REACTIVE PROTEIN
C reactive protein is annular (ring shaped) pentameric protein found in blood plasma, whose levels rise in response to inflammation. It is an acute –phase protein of hepatic origin that increases following interlukin-6 secretion by macrophages and T cells. Its physiological role is to bind lyso-phospatidyl choline expressed on surface of dead or dying cells ( some types of bacteria) in order to activate the compliment system via c1q(7)
45
Acute phase response occurs as a result of a rise in the concentration of IL-6,which is produced by macrophages as well as adipocytesin response to a wide range of chronic inflammatory conditions such a bacterial, viral or fungal infections. IL-6 stimulates the liver to produce CRP.
CRP is used as a marker of inflammation apart from liver failure, there are few known factors that interfere with CRP production. Interferon alpha inhibits CRP production from liver cells which may explain the relatively low levels of CRP found during viral infections compared to bacterial infections.(7)
Measuring and charting CRP values can prove useful in determining disease progress or the effectiveness of treatments. ELISA, immune turbidometry, nephelometry, rapid immunodiffusion and visual agglutination are all methods used to measure CRP.
46
removal of inflammatory stimuli. In contrast CRP (with a half life of 6-8hrs) rises rapidly and can quickly return to within the normal range if treatment is employed. In our study we did CRP for our patients as an inflammatory marker of active pulmonary tuberculosis. The method used is blood CRP by immune turbidometry. Laboratory reference range is less than 5.0 mg /L
ERYTHROCYTE SEDIMENTATION RATE
47
upright tube, known as westergren tube, and rate at which red blood cells fall was measured and reported in mm at the end of one hour.
There are 3 stages in erythrocyte sedimentation
1) Stage 1: Rouleaux formation
2) Stage 2: Sedimentation or settling stage
3) Stage 3: Packing stage - 10 minutes (sedimentation slows and cells start to pack at the
bottom of the tube)
In normal conditions, the red blood cells are negatively charged. Therefore,
negatively charged red blood cells repel each other and do not stack over each other.
Besides, if the viscosity of blood is high, red blood cells would be slow to fall to the base,
thus lowering the ESR. The rate of erythrocyte sedimentation is affected by both inflammatory and non-inflammatory conditions.
The ESR is governed by balance between pro sedimentation rates, mainly fibrinogen, and those factors resisting sedimentation, namely the negative charge of the erythrocytes (zeta potential). When an inflammatory process is present, the high proportion of fibrinogen in the blood causes red blood cells to stick to each other. The red cells form stacks called rouleaux, which settle faster, due to their increased density. ESR begins to rise at 24 to 48 hours of inflammation, decreases slowly as inflammation
resolves, and can take weeks to months to return to normal levels Creactive protein (CRP).
48
generally together correlate with the degree of inflammation, this is not always the case
and results may be discordantin 12.5% of the case.The normal range of ESR adults
westergrens method men <15 mm /hr, women <20 mm/hr. we did ESR by westergren’s
method in our study.
RED CELL DISTRIBUTION WIDTH
The width in RDW-CV is sometimes thought to be misleading, because it in fact is
a measure of deviation of the volume of RBCs, and not directly the diameter. However,
"width" refersto the width of the volume curve (distribution width, here presented as the
Coefficient of Variation, or CV), not the width of the cells. Thus, it is a reasonably
49
blood cell volume. RDW is elevated in accordance with variation in red cell size -
anisocytosis that is when elevated RDW is reported on complete blood count ,marked
anisocytosis ( increased variation in red cell size ) is expected on peripheral blood smear
review.
The reference range of RDW is as follows:
RDW-SD 39-46 Fl
RDW- CV 11.6-14.6 % in adults.
Reference ranges may vary depending on the individual laboratory and also patient’s age.
Mathematically, the RDW-CV is calculated with the following formula:
RDW-CV = (Standard deviation of MCV ÷ MCV) × 100.
Depending on the types of hematology analyzer instruments , RDW can be reported
statistically as coefficient of variation (CV) and or standard deviation (SD),RDW-CV and
or RDW –SD, respectively. RDW –SD (express in fl) is an actual measurement of width
of the RBC size distribution histogram as is measured by calculating the width (in fl )at
the 20% height level of the RBC size distribution histogram. This parameter is therefore
not influenzed by average RBC size.( mean corpuscular volume - MCV)
RDW-CV (express in %) is calculated from standard deviation and MCV as follows
RDW-CV% = 1 standard deviation of RBC volume/MCV * 100%.
Of note since RDW-CV is mathematically derived from MCV, it is there ore affected by
50
RDW is a recently described novel biomarker that has shown to be predictive of outcomes in pulmonary tuberculosis. although plausible patho-biological mechanisms explaining the relationship of RDW are yet to be elucidated, both inflammation and oxidative stress believed to play a role the molecular basis of the above mentioned association has been mainly attributed to the ability f the RDWs capability to reliably reflect an increase in the levels of circulatory cytokines, such as interlukin-6, tumor necrosis factor alpha and hepcidin. Thus the RDW which is available in the complete blood count serve as inflammatory marker in PTB. In last years the interest in this marker has considerably grown and now a lot of data are available indicating that this simple and inexpensive parameter is a strong and independent risk factor for severity and prognostic indicator in pulmonary tuberculosis. Moreover, several investigations have been performed to investigate the role of RDW in inflammatory and infectious disorders. Generalized, it seems plausible to affirm that RDW can be useful by adding prognostic information in patients with tuberculosis. In our study we collected patient’s whole blood by vene puncture in an EDTA tube containing EDTA potassium salt additive as an anticoagulant and analysed in auto analyzer. Thus RDW is analysed as a part of CBC.In our study we have taken red cell distribution width by CV that is RDW-CV as a marker of inflammation.
NEUTROPHIL LYMPHOCYTE RATIO:
51
marker of inflammatory or infectious pathologies. Recently many studies have suggested that neutrophil to lymphocyte ratio may be potential bio marker for PTB severity. Many studies have found a higher NLR in advanced PTB compared to mild to moderate PTB. Neutrophil lymphocyte ratio alert us to the fact that the immune system is dysregulated from inflammation and the patient at high risk of mortality.
Using results from a complete blood count with differential, it is easy to calculate the ratio of absolute neutrophil count to lymphocyte counts. If the neutrophil counts are 4 times greater than lymphocytes (>4:1) then the patient has poorer prognosis than if the ratio were less than 4:1. The normal NLR levels in a healthy adult range between 0.78 and 3.53.
In our study we analysed anticoagulated blood samples of patients in auto analyser. The absolute neutrophil count divided by lymphocyte ratio to calculate NLR.
SPUTUM AFB SMEAR:
In pulmonary tuberculosis, sputum is the specimen of choice. The sputum
specimen is collected in a sterile container. It is a common misassumption that
mycobacterial specimens are decontaminated before inoculation for culture. Thus the
cleanliness of the sputum container is not important. Unsterilized containers may be
contaminated with environmental mycobacteria. To facilitate the choice of container,
following specifications are recommended for a container: 1) wide mouthed so that the
patient can expectorate easily inside the container without contaminating it from outside;
52
observe specimen volume and quality without opening the container; 4) screw-capped to
obtain a water-tight seal, to reduce the risk of leakage during transport;
5)easily-labelledto allow permanent identification; and 6) rigid, to avoid breakage during transit.
An ideal container is the 28 ml universal container, which is a heavy glass,
screw-capped bottle. This container is reusable after thorough cleaning and sterilization. The
identification number can be permanently on the bottle cap. In TB diagnosis, care must
be taken to obtain adequate and satisfactory specimens. Correct collection and
transportation of specimens to the laboratory are important to ensure that the results are
accurate and reliable.
Grades according to the number of bacilli per high power field seen with fluorescent staining.
No. of bacilli per high power field Grade
Less than 6 per field 1+
6 to 100 bacilli per field 2+
More than 100 per field or large clumps 3+
Grades according to the number of bacilli seenWith Ziehl-Neelsen staining No. of AFB Fields Report
None per 100 oil immersion fields Negative
1-9 per 100 oil immersion fields Scanty [exact number reported]
10-99 per 100 oil immersion fields 1+
53
Use of microscopy in diagnosis of TB is of paramount importance, as culture
takes a long time before the results are ready. Microscopy is also helpful in the detection
of open or infectious cases. Stained smears are examined directly from the sputum and
after concentration.The tubercle bacilli are Gram positive though they do not take the
stain readily. Mycobacteria retain the primary stain even after decolourization with acid
alcohol;hence the term “acid-fast”. A counter-stain is employed to highlight the stained
organisms for easierrecognition. There are several methods of acid-fast nature of
mycobacteria. In the carbol-fuchsin [Ziehl-Neelsen] procedure, acid-fast organisms
appear red against a blue background. Acid fastness is based on the integrity of cell wall.
Beaded or barred forms are frequently seen in Mycobacterium tuberculosis while
Mycobacterium bovis stains more uniformly. In younger cultures, non -acid-fast rods and
granules have been reported. The mycobacterial cell wall is complex in nature. It has high
lipid content, which accounts for about 60 per cent of the cell wall weight. The cell wall
has several distinct layers. The inner layer, overlying the cell membrane is composed of
peptidoglycan [murein]. External to the murein is a layer of arabinogalactan which is
covalently linked to a group of long chain fatty acids termed mycolic acid. These form a
dense pallisade, arranged in rope-like structure, which gives the cell wall its thickness
and is largely responsible for acid fastness. Acids termed mycolic acid. These form a
dense pallisade, arranged in rope-like structure, which gives the cell wall its thickness
and is largely responsible for acid fastness. It has been shown that at least 10 000 bacilli
per ml of sputum are required for direct microscopy to be positive. The sensitivity can be
54
two specimens will, on an average, detect more than 90per cent of cases and the addition
of a third specimen increases the percentage to approximately 95 to 98 percent. A
negative smear, however, does not exclude the diagnosis of TB as some patients harbor
fewer numbers of bacilli which cannot be detected by direct microscopy. A poor quality
specimen or smear may also produce negative results. New glass slides should be used
for making smears as acid-fast bacilli [AFB] are not always removed from the old slides.
Only those reagents and diluents should be used which have been shown to be free of
environmental mycobacteria to avoid false positive smears. Direct examination is
performed by selecting a purulent looking portion of sputum and spreading it thinly on a
glass slide with a bacteriological loop or a wooden stick. The watery part of sputum is
less likely to contain bacilli. The AFB are seen as bright red rods against the blue, green
or yellow background [depending upon the counterstain used in staining]. A negative
result does not exclude TB. As recommended by World Health Organization [WHO],
before declaring a slide negative it is essential that at least 100 fields are examined taking
over at least 10 minutes. Smears can be graded according to the number of bacilli seen,
55
ROENTGENOGRAPHY IN PULMONARY TB:
PRIMARY PULMONARY TB:
Parenchymal consolidation
Tuberculoma
Miliary tuberculosis
Lymphadenopathy
Airway involvement
Pleural effusion
POST PRIMARY TB:
Local exudative / fibro productivelesion
Tuberculoma, Cavitation
Bronchogenic spread, Miliary tuberculosis
Broncho stenosis, Pleural effusion
Grading the disease severity by radiology plays paramount importance regarding
the disease extent and progress,but there is no validated system so far grading the severity
of chest x ray abnormalities in bacteriologically proven pulmonary tuberculosis.
Problems in chest x ray reporting arise from the heterogenous chest xray manifestations
of pulmonary tuberculosis and to inaccuracies inherent in chest xray performance and
interpretation, including inter observer variation.Despite these short comings, the utility
of CXR is well established in tuberculosis diagnosis and monitoring clinically. Many
chest x ray scores available for use in adults which predicts the outcome which correlates
56
of involvement of lung fields, percentage of lung involvement,Presence of cavities,
presence of pleural effusion etc.
We have taken one such simple scoring system for grading the radiological
severity. We divide the study patients into mild, moderate, severe disease according to it
we have taken dlugovitzky et al.,criteria for classifying.
MILD: single lobe involvement and no visible cavities or pleural involvement
MODERATE: Unilateral involvement of two or more lobes with a solitary cavity
or mild extent plus pleural involvement or effusion
SEVERE: bilateral involvement and multiple cavities OrModerate extent plus
pleural involvement or effusion.
STATISTICAL ANALYSIS
Statistical analysis was done using the Microsoft Excel and SPSS software with the help of a statistician. P value is used to assess the significance of correlation between variables. A statistically significant correlation is one in which
Pearson correlation is used to assess the strength of correlation between variables Pearson correlation:
> 0.5 - Strong correlation
0.3 to 0.5 - Moderate correlation 0.3 - Weak correlation
Chi-square Test:
57
The chi-square (χ2) test of independence is used to test for a statistically significant relationship between two categorical variables. The term "degrees of freedom" is used to refer to the size of the contingency table on which the value of the Chi Square statistic has been computed
P value is calculated using Excel CHITEST function: If P value ≤ 0.05 → statistically significant
58
59
DESCRIPTIVE STATISTICS
GENDER DISTRIBUTION
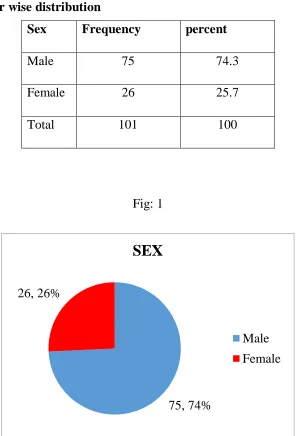
[image:59.612.158.454.236.672.2]In our study males accounted for 74% and females accounted for25 %.
[image:59.612.177.439.255.389.2]Table 1: Gender wise distribution
Fig: 1
75, 74% 26, 26%
SEX
Male Female
Sex Frequency percent
Male 75 74.3
Female 26 25.7
60 AGE DISTRIBUTION:
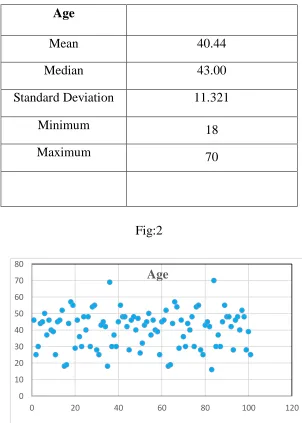
In our study the mean age distribution is 40 years with maximum 70 years and minimum age 18 years.
Table: 2 Age distribution among study subjects
Age
Mean 40.44
Median 43.00
Standard Deviation 11.321
Minimum 18
Maximum 70
Fig:2
0 10 20 30 40 50 60 70 80
0 20 40 60 80 100 120
[image:60.612.157.459.249.672.2]61 SPUTUM CATEGORY OF PARTICIPANTS
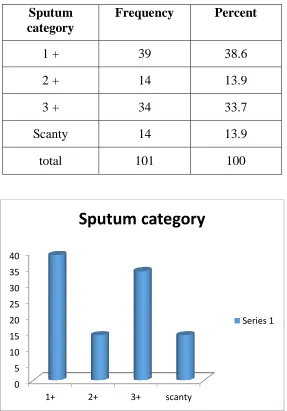
[image:61.612.164.451.219.630.2]In our study mild disease with 1+ sputum predominated 38.6%followed by sputum 3+ about 33% and scanty and 2+ and scanty accounted for 14% each.
Table 3: Sputum Category of study participants
0 5 10 15 20 25 30 35 40
1+ 2+ 3+ scanty
Sputum category
Series 1 Sputum
category
Frequency Percent
1 + 39 38.6
2 + 14 13.9
3 + 34 33.7
Scanty 14 13.9
62
DISTRIBUTION OF DISEASE SEVERITY BY SPUTUM ACCORDING TO GENDER
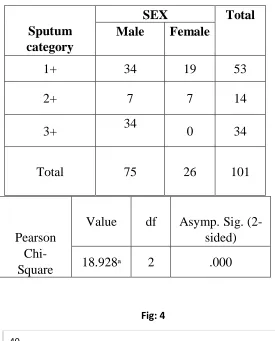
[image:62.612.171.446.149.490.2]Table 4: Distribution of disease severity by sputum according to gender
Fig: 4
The males were more in number in mild disease and severe disease.males and females are equal in number in moderate diseasein severe disease that is with 3+ sputum there were no females.
0 5 10 15 20 25 30 35 40
1+ & scanty 2+ 3+
Male
Female Sputum
category
SEX Total
Male Female
1+ 34 19 53
2+ 7 7 14
3+ 34 0 34
Total 75 26 101
Pearson Chi-Square
Value df Asymp. Sig. (2-sided)
63 Distribution of Severity According To Radiology
Table: 5 Distribution of Severity According To Radiology
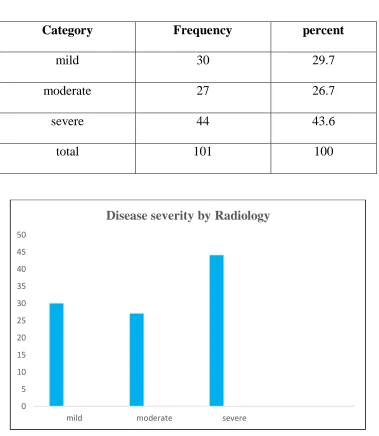
In our study the person with mild, moderate, severe disease according to radiological grading are 30%, 27%, and 44% respectively
0 5 10 15 20 25 30 35 40 45 50
mild moderate severe
Disease severity by Radiology
Category Frequency percent
mild 30 29.7
moderate 27 26.7
severe 44 43.6
64
[image:64.612.137.456.170.597.2]Distribution of disease Severity by Radiology according To Gender
Table: 6 Distribution of Severity by Radiology According To Gender
Fig:6
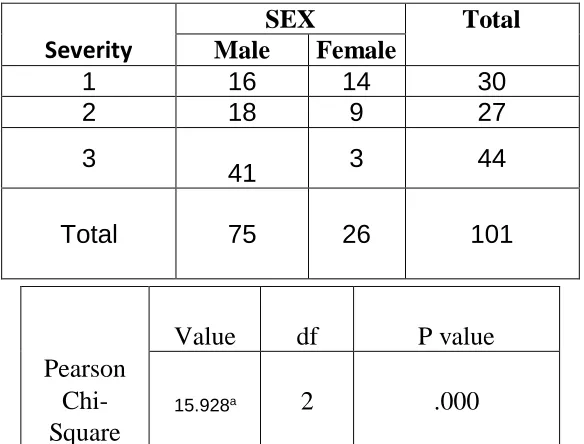
In our study in mild disease both male and females are almost equal n=16 and n=14
respectively. In moderate disease males predominated n=18 when compared to females
n=9.in severe disease males were dominant n=41,but only few females n=3 Severity
SEX Total
Male Female
1 16 14 30
2 18 9 27
3
41 3 44 Total 75 26 101
Pearson Chi-Square
Value df P value
15.928a 2 .000
16 18 41 14 9 3 0 5 10 15 20 25 30 35 40 45
Mild Moderate Severe
Male
[image:64.612.161.453.171.393.2]65
C-REACTIVE PROTEIN
Table: 7 C-REACTIVE PROTEIN
Fig:7
In this study the mean CRP in males before treatment was 58.4 and it decreased after treatment to 25.5 .whereas in females mean CRP was 28.6 before and 7.8 after treatment
.so the mean CRP is in Slightly higher range in men both before and after treatment.
0 20 40 60 80
male female
Mean crp according to gender
before rx after rx
Parameter Sex Before rx After rx
CRP Male 58.4+/-29.8 23.5+/- 15.3
[image:65.612.144.472.185.483.2]66
[image:66.612.149.467.200.318.2]ERYTHROCYTE SEDIMENTATION RATE
Table: 8 ERYTHROCYTE SEDIMENTATION RATE
Fig:8
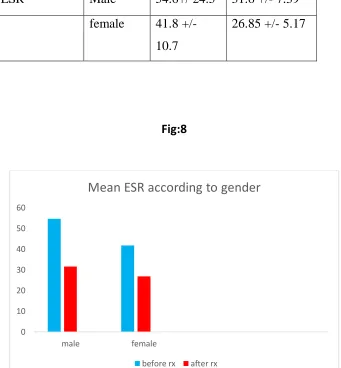
The mean ESR in men is 54.6 mm/hrbefore treatment and that of after treatment is 31.6mm/hr.in females it is 41.8mm/hr and 26.8mm/hr before and after treatment
respectively
0 10 20 30 40 50 60
male female
Mean ESR according to gender
before rx after rx
parameter sex Before
treatment
After treatment
ESR Male 54.6+/ 24.5 31.6 +/- 7.39
female 41.8 +/- 10.7
[image:66.612.150.491.254.622.2]67
[image:67.612.158.490.206.647.2]NEUTROPHIL LYMPHOCYTE RATIO
[image:67.612.173.479.217.354.2]Table: 9 NEUTROPHIL LYMPHOCYTE RATIO
Fig :9
The mean NLR IN male is 6.06 and 3.79 before and after treatment respectively,and that of female is 4.19 and 3.23 before and after treatment respectively
0 1 2 3 4 5 6 7
male female
Mean NLR according to gender
before rx after rx
Parameter Sex Before rx After rx
NLR Male 6.06+/- 2.3 3.79 +/- 1.2
Female 4.19 +/- 1.27
68
[image:68.612.135.476.199.315.2]RED CELL DISTRIBUTION WIDTH
Table: 10 RED CELL DISTRIBUTION WIDTH
Fig:10
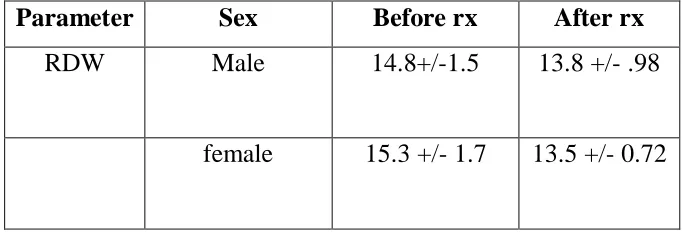
The mean RDW in men are 14.8 and 13.8 before and after treatment respectively, as that of women were 15.3 and 1.5 before and after treatment respectively.
0 2 4 6 8 10 12 14 16 18
male female
Mean RDW according to gender
before rx after rx
Parameter Sex Before rx After rx
RDW Male 14.8+/-1.5 13.8 +/- .98
[image:68.612.157.483.201.596.2]69
[image:69.612.142.506.170.386.2]INFLAMMATORY MARKERS ACCORDING TO SEVERITY (RADIOLOGICAL)
Fig:11Inflammatory markers according to severity (radiological) C-reactive protein
Fig:12 Erythrocyte sedimentation rate
When comparing the mean value of CRP and ESR,their levels are highest,higher and high in severe, moderate, mild disease respectively.Thus their mean levels closely reflects the severity. (radiology)
Mild Moderate Severe Before 21.4 43.3 75.6
After 4.7 18.1 30.6
21.4 43.3 75.6 4.7 18.1 30.6 0 10 20 30 40 50 60 70 80 m e a n C R P Before After
Mild Moderate Severe
Before 37.1 41.6 67
After 27.6 27 34.3
37.1 41.6
67
27.6 27 34.3
[image:69.612.141.511.433.608.2]70 Fig: 13Neutrophil lymphocyte ratio
Fig:14 Red cell distribution width
The mean values of the neutrophil lymphocyte ratio and red cell distribution width are highest, higher,high in mild, moderate, severe disease respectively thereby reflecting the severity
Mild Moderate Severe
Before 3.8 4.6 7.3
After 3.1 3.5 1.8
3.8 4.6 7.3 3.1 3.5 1.8 0 1 2 3 4 5 6 7 8 M E A N N L R Before After
Mild Moderate Severe Before 14.4 14.8 15.3
After 13.2 13.8 1.8
14.4 14.8 15.3
[image:70.612.142.508.351.569.2]71
RESPONSES OF INFLAMMATORY MARKERS DURINGTREATMENT Table: 11 RESPONSES OF INFLAMMATORY MARKERS DURING
[image:71.612.131.506.193.591.2]TREATMENT
Fig: 14
The mean values of CRP fall significantly after treatment for 2months in both males and females.
0 Months 2 Months
Male 58.7 28.6
Female 28.6 7.8
0 10 20 30 40 50 60 70 M E A N C R P Male Female
CRP Before
treatment
After treatment
P value
72
Table: 12 Erythrocyte sedimentation rate
[image:72.612.158.490.172.559.2]* Paired T test Fig: 15
The mean values of ESR fall significantly after treatment for 2months in both males and females.
O Months 2 Months Male 54.6 31.6 Female 41.8 26.8
0 10 20 30 40 50 60
M E A N E S R
Male
Female ESR Before treatment After treatment P value
MALE 54.6 +/- 24.5 31.6+/ 7.39 0.001
73
[image:73.612.120.497.133.228.2]Table: 13 Neutrophil lymphocyte ratio
Fig: 16
The mean values of NLR fall significantly after treatment for 2months in both males and females.
O Months 2 Months
Male 6.1 3.8
Female 4.19 3.23
0 1 2 3 4 5 6 7
M E A N N L R
Male
Female NLR Before treatment After treatment P value
MALE 6.06 +/- 2.3 3.79 +/- 1.2 0.004
74
[image:74.612.138.552.146.239.2]Table: 14 Red cell distribution width
Fig: 17
The mean values of RDW fall significantly after treatment for 2months in both males and females.
O Months 2 Months
Male 14.8 13.8
Female 15.3 4.4
0 2 4 6 8 10 12 14 16 18 M E A N R D W Male Female RDW Before treatment After treatment P value
MALE 14.8 +/- 1.5 13.8 +/- 0.98 0.004
75
[image:75.612.72.472.158.657.2]INFLAMMATORY MARKERS LEVELS ACCORDING TO SPUTUM CATEGORY
Fig: 18
Fig: 19
When comparing the mean value of CRP and ESR, their levels are highest,higher and high in severe, moderate, mild disease respectively.Thus their mean levels closely reflects the severity.(by sputum category)
0 10 20 30 40 50 60 70 80
sputum 1+ sputum2+ sputum 3+
CRP
before rx after rx
0 10 20 30 40 50 60 70
sputum 1+ sputum2+ sputum 3+
ESR
76 Fig: 20
Fig: 21
When comparing the mean value of CRP and ESR, their levels are highest,higher and high in severe, moderate, mild disease respectively.Thus their mean levels closely reflects the severity (by sputum category)
0 1 2 3 4 5 6 7 8
sputum 1+ sputum2+ sputum 3+
NLR
before rx after rx
12.5 13 13.5 14 14.5 15 15.5
sputum 1+ sputum2+ sputum 3+
RDW
77
Table: 15 Hematological parameters that demonstrated significant difference based on the sex and severity of TB patients before initiation of anti-TB drugs compared with after completion of the intensive phase of treatment
Parameter Sex Before Rx After Rx P Value
CRP Male (75) 58.4 ± 29.8 23.5 ± 15.3 0.001*
Female (26) 28.6 ± 23.4 7.8 ± 10.2 Severity
Mild (30) 21.04±12.8 4.7 ± 4.8 0.047* Moderate (27) 43.3±11.0 18.1 ± 10.7 0.013* Severe (44) 75.61±28 30.6 ± 14.5 0.001*
ESR
Sex
Male 54.6±24.5 31.6 ± 7.39
Female 41.8 ± 10.07 26.85 ± 5.17 0.756 Severity
Mild 37.1 ± 8.04 27.63 ± 5.96 0.66 Moderate 41.6 ± 8.2 27 ± 3.5 0.04* Severe 67.0± 25.2 34.3 ± 7.7 0.001* Sex
Male 6.06 ± 2.3 3.79 ± 1.2
78
NLR Mild 3.8 ± 0.59 3.16 ± 0.48 0.006*
Moderate 4.6 ± 1.2 3.5 ± 0.64 0.535 Severe 7.39 ± 2.2 4.07 ± 1.51 0.105
RDW
Sex
Male 14.8 ± 1.5 13.8 ± 0.98
Female 15.3 ± 1.7 13.5 ± 0.72 0.044* Severity
Mild 14.4 ± 1.3 13.2 ± 0.52 0.15
79
Parameter Before Rx After Rx P Value
CRP 1 + 33.32 20.8 11.06
11.91
0.001
2 + 57.9 30.4 21.2 15.3 0.001 3 + 75.0 27.7 32 12 0.001 ESR 1 + 42.6 17.4 28.4 5.42 0.001 2 + 52.2 14.3 30.3 6.04 0.032 3 + 64.5 25.8 33.4 8.8 0.001
NLR
1 + 4.5 1.4 3.3 0.69 0.001 2 + 6.09 2.4 3.7 0.70 0.001
3 + 6.9 2.66 4 1.66 0.186
RDW
80
81
Our study sample is 127 of which only 101 patients finally included in the study.Two of the people turned out to be a multi drug resistant tuberculosis,15 people did not come for follow up, 13 patients defaulted treatment, and 2 patients changed to alternative treatment.
GENDER DISTRIBUTION:
In our study population male patients accounted for about 75% and female patients accounted for about 25%.thus males predominated in the study.This probably shows men seek medical care more than women.
AGE DISTRIBUTION:
The mean age of the patients is 40 years, with standard deviation of 11. The maximum age of the patient was 70 years, minimum age was 18 years. This reflects that TB predominantly affects the productive age group which is a major socioeconomic burden for the country.
DISTRIBUTION OF DISEASE SEVERITY ACCORDING TO SPUTUM CATEGORY
82
disease it is in equal distribution.no female patients classified as severe disease which is may probably due to relatively less female study population.
DISTRIBUTION OF DISEASE SEVERITY ACCORDING TO RADIOLOGY According to radiology 30 % patients are classified into mild disease, 27% into moderate disease,44% into severe disease thus there is discrepancy in classifying the severity between sputum category and radiology. The radiological evaluation detected more number of Moderate disease as compared to sputum grading.
According to gender male and female distribution in mild disease it is almost equal, moderate and severe disease males predominated. Thus males suffer a relatively severe disease.
INFLAMMATORY MARKERS AND DISEASE SEVERITY
We have compared the inflammatory markers levels with disease severity by sputum category and radiological involvement.
83
The mean CRP levels in moderate disease as by radiology and sputum category are 43.3 mg% and 57.9 mg % and respectively. The mean ESR level in moderate PTB as byradiology and sputum category are 41.6mm/hr and 52.2 mm/hr respectively. The mean NLR in moderate disease by radiology and sputum are 4.6 and 6.09 respectively. The mean RDW in moderate disease by radiology and sputum are 14.8 and 15 respectively. Thus the inflammatory markers in moderate tuberculosis also are elevated more in sputum category than in radiological severity except for RDW which elevated more in moderate disease as determined by radiology.
The mean CRP levels in severe disease as by radiology and sputum category are 75.6mg% and 75.0mg % and respectively. The mean ESR level in severe PTB as by radiology and sputum category are 67.0mm/hr and 64.5 mm/hr respectively. The mean NLR in severe disease by radiology and sputum are 7.39 and 6.9 respectively. The mean RDW in severe disease by radiology and sputum are 15.3 and 14.8 respectively. Thus the inflammatory markers in severe tuberculosis also are elevated more in sputum category than in radiological severity except for RDW which elevated more in severe disease as determined by radiology
INFLAMMATORY MARKERS RESPONSE TO ATT
84
The ESR which is elevated in active disease fall significantly in moderate and severe disease (p value < .001) whereas its fall in mild disease is not statistically significant.( p value 0.66).this is in accordance with studies done by furuhashi et al, mahalakhmamma et al. but in all the reviewed studies all the patients they found statistically significant fall in ESR
The NLR ratio elevated in active disease and fall significantly in mild disease ( p < 0.006 ) whereas in moderate and severe disease fall in its level not significant .( p=0.5).This is in accordance with various literatures examples…studies done by abakay et al, yin y et al,intheir studied they concluded high NLR in severe disease and retreatment cases.
The red cell distribution width(RDW )levels which are elevated in active disease fall in response to active treatment but it is not statistically significant.This is in accordance with studies done by various authors bamalkku et al..,marina oliveria et al, their studies also did not show statistically significant decrease in RDW after treatment.
85
86
Inflammatory markers levels are comparable to degree of severity both by
radiological and microbiological criteria. P value < 0.001
The level of CRP correlates with disease activity.
Elevated ESR correlates significantly with disease activity only in moderate and
severe disease.
NLR ratio correlates significantly only with mild disease
These findings can be extrapolated and may be useful in assessing the disease
severity and follow up in pediatric TB and extra pulmonary TB where sampling
from primary site are not always possible or correlation with other modalities of
investigation are questionable.
Thus the development of non-sputum-based biomarkers of treatment response
87