Strand-Specific Dual RNA Sequencing of Bronchial Epithelial
Cells Infected with Influenza A/H3N2 Viruses Reveals Splicing
of Gene Segment 6 and Novel Host-Virus Interactions
Giulia Fabozzi,
a,b*
Andrew J. Oler,
cPoching Liu,
dYong Chen,
eSamuel Mindaye,
aMichael A. Dolan,
cHeather Kenney,
fMarjan Gucek,
eJun Zhu,
dRonald L. Rabin,
aKanta Subbarao
f*
aLaboratory of Immunobiochemistry, Division of Bacterial, Parasitic and Allergenic Products, Office of Vaccines
Research and Review, Center for Biologics Evaluation and Research, U.S. Food and Drug Administration, Silver Spring, Maryland, USA
bVaccine Research Center, National Institute of Allergy and Infectious Diseases, National Institutes of Health,
Bethesda, Maryland, USA
cBioinformatics and Computational Biosciences Branch, Office of Cyber Infrastructure and Computational
Biology, National Institute of Allergy and Infectious Diseases, National Institutes of Health, Bethesda, Maryland, USA
dSystems Biology Center, National Heart Lung and Blood Institute, National Institutes of Health, Bethesda,
Maryland, USA
eProteomics Core, National Heart Lung and Blood Institute, National Institutes of Health, Bethesda, Maryland,
USA
fEmerging Respiratory Viruses Section, Laboratory of Infectious Diseases, National Institute of Allergy and
Infectious Diseases, National Institutes of Health, Bethesda, Maryland, USA
ABSTRACT
Host-influenza virus interplay at the transcript level has been
exten-sively characterized in epithelial cells. Yet, there are no studies that simultaneously
characterize human host and influenza A virus (IAV) genomes. We infected human
bronchial epithelial BEAS-2B cells with two seasonal IAV/H3N2 strains, Brisbane/
10/07 and Perth/16/09 (reference strains for past vaccine seasons) and the
well-characterized laboratory strain Udorn/307/72. Strand-specific RNA sequencing
(RNA-seq) of the infected BEAS-2B cells allowed for simultaneous analysis of host and viral
transcriptomes, in addition to pathogen genomes, to reveal changes in mRNA
ex-pression and alternative splicing (AS). In general, patterns of global and immune
gene expression induced by the three IAVs were mostly shared. However, AS of host
transcripts and small nuclear RNAs differed between the seasonal and laboratory
strains. Analysis of viral transcriptomes showed deletions of the polymerase
compo-nents (defective interfering-like RNAs) within the genome. Surprisingly, we found
that the neuraminidase gene undergoes AS and that the splicing event differs
be-tween seasonal and laboratory strains. Our findings reveal novel elements of the
host-virus interaction and highlight the importance of RNA-seq in identifying
molec-ular changes at the genome level that may contribute to shaping RNA-based innate
immunity.
IMPORTANCE
The use of massively parallel RNA sequencing (RNA-seq) has revealed
insights into human and pathogen genomes and their evolution. Dual RNA-seq
al-lows simultaneous dissection of host and pathogen genomes and strand-specific
RNA-seq provides information about the polarity of the RNA. This is important in the
case of negative-strand RNA viruses like influenza virus, which generate positive
(complementary and mRNA) and negative-strand RNAs (genome) that differ in their
potential to trigger innate immunity. Here, we characterize interactions between human
bronchial epithelial cells and three influenza A/H3N2 strains using strand-specific dual
RNA-seq. We focused on this subtype because of its epidemiological importance in
caus-ing significant morbidity and mortality durcaus-ing influenza epidemics. We report novel
ele-Received27 March 2018Accepted24 May 2018
Accepted manuscript posted online5 July 2018
CitationFabozzi G, Oler AJ, Liu P, Chen Y, Mindaye S, Dolan MA, Kenney H, Gucek M, Zhu J, Rabin RL, Subbarao K. 2018. Strand-specific dual RNA sequencing of bronchial epithelial cells infected with influenza A/H3N2 viruses reveals splicing of gene segment 6 and novel host-virus interactions. J Virol 92:e00518-18.
https://doi.org/10.1128/JVI.00518-18.
EditorAdolfo García-Sastre, Icahn School of Medicine at Mount Sinai
This is a work of the U.S. Government and is not subject to copyright protection in the United States. Foreign copyrights may apply.
Address correspondence to Ronald L. Rabin, ronald.rabin@fda.hhs.gov, or Kanta Subbarao, KSUBBARAO@niaid.nih.gov.
*Present address: Giulia Fabozzi, Vaccine
Research Center, National Institute of Allergy and Infectious Diseases, National Institutes of Health, Bethesda, Maryland, USA; Kanta Subbarao, WHO Collaborating Centre for Reference and Research on Influenza and the Department of Microbiology and Immunology, The Peter Doherty Institute for Infection and Immunity, Melbourne, Victoria, Australia.
G.F. and A.J.O. contributed equally to this article.
crossm
on November 6, 2019 by guest
http://jvi.asm.org/
ments that differ between seasonal and laboratory strains highlighting the complexity of
the host-virus interplay at the RNA level.
KEYWORDS
alternative splicing, influenza A virus H3N2, neuraminidase, Udorn/72
strain, bronchial epithelial cells, dual RNA-seq, host-virus interaction, seasonal H3N2
strains, strand-specific RNA seq, viral transcriptome
I
nfluenza A virus (IAV) (family
Orthomyxoviridae
) contains a negative-sense,
single-stranded RNA genome divided into eight segments. The eight gene segments are:
polymerase basic 2 (PB2), polymerase basic 1 (PB1), polymerase acidic (PA),
hemagglu-tinin (HA), nucleoprotein (NP), neuraminidase (NA), matrix (M), and nonstructural
protein (NS) (1). Gene segments M and NS are known to undergo splicing to generate
additional proteins (2, 3). Recently, a novel PB2 splicing product has been reported (4).
Gene segments HA and NA encode surface glycoproteins whose antigenic properties
are used to classify IAV subtypes.
When two influenza viruses coinfect a host, their gene segments can be exchanged
in a phenomenon referred to as genetic reassortment, and this can result in the
generation of novel influenza viruses. If the novel reassortant virus is able to infect
humans, cause disease, and spread from person to person, it may have the potential to
cause a pandemic. In 1968, a human IAV H2N2 virus reassorted with an avian H3N2
virus (5), giving rise to the H3N2 pandemic strain (6). Since 1968, H3N2 viruses have
caused epidemics associated with higher levels of morbidity and mortality than H1N1
viruses (7).
During the influenza life cycle, genomic viral RNA (vRNA) is transcribed into
mes-senger RNA (mRNA), and complementary RNA (cRNA); the latter serves as the template
for generation of progeny vRNA. In addition, other RNAs can be synthesized, such as
small viral RNAs that have been proposed to regulate the switch between transcription
and replication (8) and defective interfering (DI) RNA that can act as
pathogen-associated molecular patterns (PAMPs) (9). Host pattern recognition receptors (PRRs)
can discriminate between PAMPs produced during active replication (vita-PAMPs; e.g.,
viral genome) from those generated as intermediates during viral replication (e.g.,
double-stranded RNA [dsRNA]) (10, 11). Stimulation of PRRs triggers several cellular
responses, including interferon regulatory factor 3 and 7 (IRF3/IRF7)-activated
expres-sion of type I and III interferons (IFNs) (12, 13).
Influenza infection of epithelial cells (14–16) induces expression of types I and III
IFNs, which activate the STAT1/STAT2/IRF9 (ISGF3) complex, which in turn triggers
expression of more than 300 IFN-stimulated genes (ISGs) (17). Gene expression changes
in epithelial cells infected with IAV H1N1 and H5N1 subtypes and with laboratory
strains Puerto Rico/8/34 and Udorn/307/72 (UD/72) have been described (18, 19).
Deep-sequencing analysis of 284 IAV/H3N2 strains that circulated from 1968 to 2011
(20) provide insights about virus evolution and antigenicity. To date, the only example
of dual RNA sequencing (RNA-seq) study with influenza viruses is from murine lungs
infected with two avian viruses, H5N1 and H5N8 (21). However, there are no dual
RNA-seq studies that have simultaneously characterized the transcriptome of human
epithelial cells and the genome and transcriptome of clinically relevant IAV strains.
While the role of alternative splicing (AS) in human diseases has been studied
intensively (22, 23), the importance of AS and noncoding RNAs and other
posttran-scriptional regulatory mechanisms in the control of inflammatory response(s) has only
been recently reported (24). For example, murine transcriptome studies revealed novel
transcripts and AS of host genes expressed in response to mouse-adapted respiratory
viruses (25), and a well-characterized example of AS of host genes during viral infection
is the herpes simplex virus 1-induced AS of
MX1
, whose gene product favors virus
replication (26). However, whether IAV modulates AS of human host genes encoding
immune response and/or key biological functions is not known.
Here, we report host-virus interactions at the genomic level using the human
bronchial epithelial cell line BEAS-2B infected with two seasonal H3N2 viruses and the
on November 6, 2019 by guest
http://jvi.asm.org/
well-characterized H3N2 laboratory strain UD/72. We selected BEAS-2B cells because it
is a nonmalignant cell line isolated from the normal human bronchial epithelium of a
cancer-free individual (27, 28), thus representing cells that are the primary target of
influenza virus infection. By using strand-specific dual RNA-seq, the transcriptome of
BEAS-2B cells infected with seasonal or laboratory strains revealed immune response
patterns centered on a subset of IRFs, the expression of DI-like RNAs, and AS of host
transcripts. Analysis of the H3N2 transcriptome revealed that the NA gene undergoes
AS and that active splice sites differ between seasonal and laboratory strains.
RESULTS
RNA-seq of H3N2 viruses.
We infected BEAS-2B cells with seasonal A/Brisbane/10/
2007 (BR10/07) and A/Perth/16/2009 (PER16/09), reference strains for IAV/H3N2
vac-cines in the 2008 –2010, and 2010 –2011 seasons, respectively, and with the laboratory
strain UD/72. Total RNA was extracted from mock- and virus-infected cells at 1, 6, or 24
h postinfection (hpi) and subjected to a dual strand-specific RNA-seq strategy using
Illumina HiSeq. This strategy helps to differentiate the negative-strand RNA (vRNAs)
from positive-strand RNAs (cRNAs and mRNAs), which are synthesized during viral
transcription/replication. A schematic of the experiment is shown in Fig. 1A.
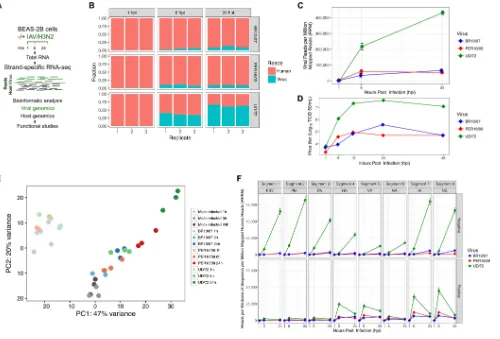
Figure 1B shows the distribution of host and viral read counts for each sample. By
normalizing viral and host read coverage, an RNA-based growth curve of IAV/H3N2 was
FIG 1Strand-specific dual RNA-seq and IAV/H3N2 genomics. (A) Schematic of the RNA-seq approach. RNA samples extracted from mock- and
IAV/H3N2-infected cells at time points 1, 6, and 24 h were subjected to a strand-specific RNA-seq assay which maintains the polarity of host and virus RNA. (B) Total
RNA-seq read counts were mapped by sample (xaxis) and read fraction distribution (yaxis). IAV/H3N2 viral growth curves obtained by the following means:
normalized viral reads, expressed as reads per million mapped reads (RPM) for IAV/H3N2-BR10/07 (blue), PER16/09 (red), and laboratory strain UD/72 (green) (C) and viral titer in BEAS-2B cells (D). (E) Principal component analysis demonstrating similarity between samples and biological replicates for each sample. (F) Temporal expression of influenza viral RNAs. Negative (top)- and positive (bottom)-stranded RNAs of each viral segment (gray boxes) expressed as reads per kilobase of sequence per million mapped reads (RPKM) normalized to total host reads. Viral segments are ordered according to size.
on November 6, 2019 by guest
http://jvi.asm.org/
[image:3.585.45.545.70.409.2]generated (Fig. 1C). Growth curves of the three viruses were confirmed by virus titration
in BEAS-2B cells (Fig. 1D). Principal component analysis (Fig. 1E) shows that all the 1-hpi
time points clustered with the 1-h controls and that the seasonal IAVs at 6 hpi clustered
with the 6-h controls. However, UD/72 6-hpi samples cluster with BR10/07 and
PER16/09 24-hpi samples, consistent with the rapid growth kinetics of UD/72 compared
to the seasonal strains (Fig. 1D).
Viral genomics of seasonal and laboratory H3N2 strains.
The relative temporal
expression of vRNA versus cRNA/mRNA from each gene segment was tracked by
normalization of read coverage by viral gene segment to total host reads (Fig. 1F).
vRNAs of the two seasonal strains were relatively constant between 6 and 24 hpi, i.e.,
after transcription initiation (29), whereas vRNAs PB2, PB1, PA, and M of UD/72 were
upregulated from 6 to 24 hpi; at the latter point primary transcription is expected to be
complete.
In accordance with published literature (30, 31), positive-strand RNAs for the
poly-merase segments (PB2, PB1, and PA) of all three viruses were expressed at lower
abundance than other segments at each time point. Although we are not able to
discriminate between cRNA and mRNA, our results indicate higher relative levels of
mRNAs or cRNAs of gene segments HA, NP, M, and NS in the laboratory strain UD/72
at 6 hpi compared to seasonal strains, confirming the growth kinetics of UD/72 shown
in Fig. 1D.
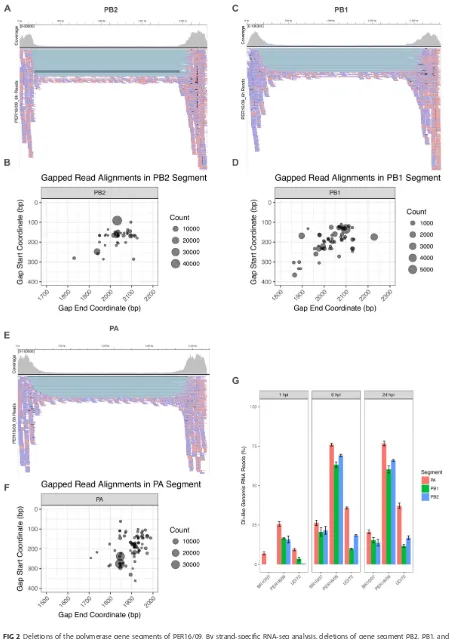
DI-like RNA expression during H3N2 infection.
Viral coverage plots at the base
pair resolution revealed prominent edges for the PB2, PB1, and PA segments for all
viruses (see Fig. S1 in the supplemental material), but most noticeably for PER16/09
(Fig. 2). The valley between these “edges” corresponds to genomic deletions consistent
with reads mapping to vRNAs that are commonly associated with DI RNAs (32). DI RNAs
were reported mostly during
in vitro
infection at a high multiplicity of infection (MOI)
(33). However, DI-like RNAs were also described in clinical specimens following
infec-tion with the pandemic strain A/California07/2009 (H1N1pdm09) (34). We use the term
DI RNA to refer to reports that particles have a defective interfering effect in a
functional assay, and the term DI-like RNA when referring to our data and/or previous
reports in which the RNA appear to be similar to those previously reported as DI RNA
but interference has not been confirmed in a functional assay. As the fraction of DI-like
RNA to vRNA seems to be important for the outcome of an infection (33), we measured
this fraction and found it to be noticeably higher for all three viral polymerase
segments of PER16/09 than either BR10/07 or UD/72 (Fig. 2G). To determine whether
the high ratio in PER16/09 was due to presence of DI particles in viral stocks, we
calculated the particle/infectivity ratio of the viral stocks used to infect BEAS-2B cells by
HA and plaque titers. Each IAV/H3N2 viral stock had a similar HA titer, but infectivity
varied modestly (30-fold), with PER16/09 virus having the lowest infectivity titer and
UD/72 having the highest. Based on analysis of the start and end coordinates of
genomic deletions found in PER16/09, it appears that DI-like RNAs originate from
preferred locations (“hot spots”) (Fig. 2B, D, and F).
Alternative splicing of gene segment 6 (NA) of IAV/H3N2 viruses.
Influenza
mRNA of segments 1 (PB2), 7 (M), and 8 (NS) are known to undergo AS to generate
additional products (2–4, 35, 36). We found that segment 6 (NA) of all three IAV/H3N2
viruses underwent splicing (Fig. 3) based on two criteria: (i) the splicing event was
observed exclusively in the positive-strand RNA, thereby excluding a genomic deletion
in the vRNA, and (ii) conserved canonical or noncanonical splice site signals were
present (37), including donor and acceptor splice sites (referred to as 5=ss and 3=ss) and
the branch point sequence. The known spliced isoform of the NS mRNA segment was
confirmed as a positive control (see Fig. S2 in the supplemental material).
To quantitatively compare expression of spliced transcripts between samples, we
filtered the reads to keep all non-split positive-strand reads and all split reads with
junctions that were exclusive to the positive strand (Fig. 3A). In addition to the
unspliced NA transcript (termed NA1), we predicted seven AS transcripts (NA2-8;
on November 6, 2019 by guest
http://jvi.asm.org/
PER16/09_6h Reads
Coverage
[0-100000]
p b 0 0 0 , 2 p
b 0 0 5 , 1 p
b 0 0 0 , 1 p
b 0 0 5 p
b 0
FIG 2Deletions of the polymerase gene segments of PER16/09. By strand-specific RNA-seq analysis, deletions of gene segment PB2, PB1, and
PA are mapped on the negative-strand RNA. (The 6-hpi time point is displayed as representative.) RNA polarity is color-coded (pink,
(Continued on next page)
on November 6, 2019 by guest
http://jvi.asm.org/
[image:5.585.38.490.68.707.2]Fig. 3B). Predicted NA spliced transcripts were validated by reverse transcription-PCR
(Fig. 3C) using the primer pairs shown in Fig. 3B, followed by cloning and Sanger
sequencing to validate the splice junctions. By using the primer pair NAFw26 and
NARv1272 designed to detect NA2-7, amplicons generated from the cDNA of UD/72
NAdel NA6 NA5 NA4 NA3 NA8 NA7 NA1 NA2
[image:6.585.45.545.71.528.2]72 509 947 1385
[0 - 14000]
264
59 122
[0 - 14000] UD/72_6h
3162 172
121 57 10730
[0 - 28000] PER16/09_24h
4405 407
[0 - 28000] PER16/09_6h
2376 198
[0 - 28000] BR10/07_6h
127
[0 - 28000] BR10/07_24h
323 4015 39 148 UD/72_24h
B
110 160 39 5 8 6 0 95 972 11311254
149 5 9 F 6 2 F NA Rv1272 NA Rv1326
NA
N 3
N 5
NA
N 7
NA
N 8
V rus
R A s q
Po itive clones
(% o t t l)
Size
(bp
415
401
461
6 3
8 9
901
1153
UD 72
+
+
+
+
+
+
-PER16 0
BR10/07
-+
PER16 0
BR10 0
-38
80
UD 7
3
38
3
2
1
n.d.
-Kb 1 6 1 6 1 6 1 6 24
87.9/99.3 0.5/- 9.8/- 0.5/- 0.3/- -/0.7 0.3/-% of total UD/PER
0.4
FIG 3Splicing of segment 6 (NA) in BEAS-2B cells. (A) Sashimi plots (99, 100) of RNA-seq reads from 6- and 24-hpi samples (positive-strand reads randomly
subsampled to the same number) aligned to the NA segment of BR10/07 (blue), PER16/09 (red), or UD/72 (green). (Bottom left) An annotation track shows all predicted spliced transcripts of NA (blue lines/bars), and one positive-strand deletion (NAdel). (Bottom right) The percentages of predicted spliced transcripts showing UD/72 (left side) and one of the seasonal strains, PER16/09 (right side), are shown. (B) Architecture of NA splicing. A schematic representation of the
full-length NA transcript is presented, omitting the cap and poly(A) tail (top, line) containing the alternative 5=ss (dark blue) and 3=ss (orange). Primers NAFw1
and NARv1272 were used to detect all predicted RNA isoforms; primers NAFw950 and NARv1326 were used to confirm the NA8 isoform. The expected size of the RNA species and the percentages of positive clones obtained from cloning are reported (right; n.d., not determined). (C) Electrophoretic analysis of cDNA fragments corresponding to the NA species expressed by each virus. The contrast was adjusted for NA8 in panel C, the third image.
FIG 2Legend (Continued)
negative-strand RNA; blue, positive-strand RNA). Integrative Genomics Viewer (IGV) screen shots of PB2, PB1, and PA vRNA reads (A, C, and E)
are shown. For each deletion, the start/stop coordinates are indicated by theyandxaxes and the abundance of the deletion are expressed by
the sizes of the circle (B, D, and F). (G) Percentage of DI-like genomic (negative-strand) reads as a fraction of total genomic (negative-strand) reads
of PA (red), PB1 (green), and PB2 (blue) during infection of each IAV/H3N2 (xaxis) virus. The time points are indicated at the top.
on November 6, 2019 by guest
http://jvi.asm.org/
showed a different pattern compared to those amplified from cDNAs of BR10/07 and
PER16/09. All predicted NA spliced transcripts were confirmed, except NA7. Five clones
(2.5%) represent NA2, 76 (38%) represent NA3, and the numbers of clones representing
NA4, NA5, and NA6 were 6 (3%), 4 (2%), and 2 (1%), respectively. By the use of the
primer pair NAFw950 and NARv1326, designed to detect NA1 and NA8, we amplified
the fragment containing the predicted spliced form, NA8. By sequencing the cloned
fragments, we confirmed the presence and structure of NA8. Eight clones (80%) from
PER16/09 and 5 clones (38.5%) from BR10/07 represent NA8. While NA2 to NA7 (NA2-7)
occurred during infection with UD/72, NA8 occurred only during infection with the two
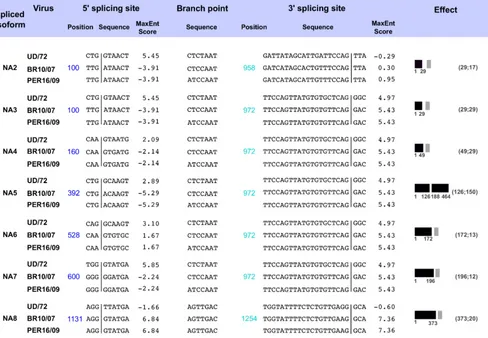
seasonal strains (Fig. 3B). Similar to the AS of segment M (38), NA2-7 use five alternative
5=ss, as well as two 3=ss. The different 5=
and 3=ss between UD/72 and the two seasonal
viruses may explain strain-specific AS events (Fig. 4). For example, NA2 splice donor and
acceptor sites follow the canonical GT-AG rule in UD/72, however, the same splice
donor site in BR10/07 and PER16/09 is AT instead of GT, consistent with the lack of NA2
transcript in BR10/07 and PER16/09. Indeed, splicing prediction scores of all 5=ss
observed in different strains are consistent with our observed strain-specific transcript
variants, i.e., strains in which a spliced transcript is observed have higher scores than
strains in which that transcript variant is not observed (Fig. 4). A similar pattern is seen
with the NA8 3=ss (i.e., higher score in PER16/09 and BR10/07 than in UD/72); however,
for the 3=ss of NA2-7, the scores are similar between strains. This pattern can also
explain the differential usage of the two alternative 3=ss: the more commonly used 3=ss
at position 972 has a higher score than the 3=ss at position 958. We also identified a
Virus Effect
FIG 4Molecular features of NA splicing of IAV/H3N2. Molecular features of the predicted spliced isoforms of NA of IAV/H3N2 are shown at the nucleotide level.
The positions and sequences of the 5=ss and 3=ss and the branch point sequence are shown. Maximum entropy scores for each 5=ss and 3=ss (MaxEnt score)
are shown (frameshift, gray box; in-frame, black box). The numbering in the “Effect” column is related to the amino acid length of the predicted gene product. Other numbering refers to nucleotides within the consensus of three assembled virus NA segments.
on November 6, 2019 by guest
http://jvi.asm.org/
[image:7.585.50.538.78.416.2]prominent positive-strand deletion near the N terminus in PER16/09 (NAdel; Fig. 3A).
Because no consensus donor, acceptor, or branch sequence was identified, we
con-clude this is not likely a result of alternative splicing.
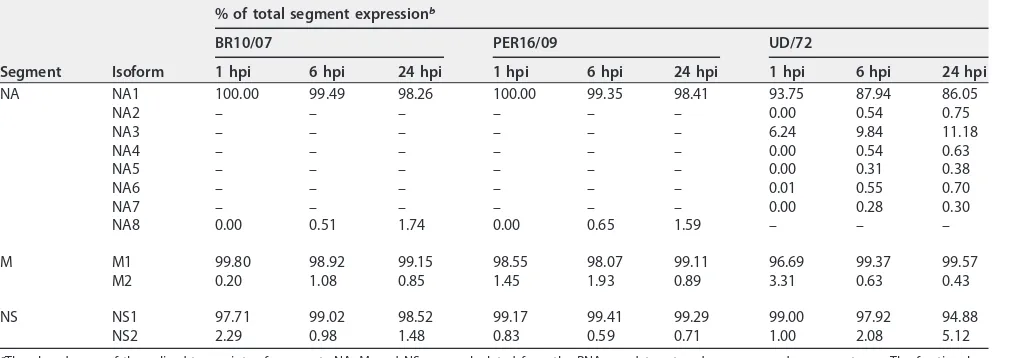
Next, we used computational methods to determine the relative expression of each
spliced isoform as a fraction of all isoforms (including the unspliced or native isoform),
for NA, M, and NS. Isoforms NA2 and NA4-7 are each estimated to be expressed at levels
ranging from 0.3 to 0.7% at 6 and 24 hpi in UD/72 infected cells (Table 1). These levels
are comparable to the expression level of M2 (0.4 to 0.6%) and slightly lower than NS2
(2.1 to 5.1%) in UD/72 at the same time points. NA3 expression is higher than NA2 and
NA4-7, comprising 9.8 and 11.2% at 6 and 24 hpi, respectively. NA8 is expressed at 0.5
to 1.7%, which is also comparable to the expression of M2 (0.8 to 1.1%) and NS2 (0.7
to 1.5%) in seasonal BR10/07 and PER16/09 at 6 and 24 hpi. Because cRNA cannot be
separated from mRNA in our RNA-seq data, these fractional values for spliced isoforms
may be lower than the actual values.
To determine whether any of these splice variants are expressed in other viral
strains, we performed a BLAST search against all IAV/H3N2 RNA-seq data sets in the
Sequence Read Archive (SRA;
http://www.ncbi.nlm.nih.gov/Traces/sra
) using 30-bp
exon-exon junction sequences for NA2-8 as a query. We identified a single hit for NA8
in influenza A/Myanmar/13M035/2013 (H3N2) (read id DRR051408.279490) (39), and
this strain has a 5=ss and 3=ss identical to PER16/09 and BR10/07. No other matches for
other NA isoforms were identified. The low number of hits in SRA data sets is likely due
to library preparation optimized for amplification of genomic RNA rather than mRNA
(39). Interestingly, of 7,446 unique N2 subtype NA sequences, 4,463 (60%) have an
intact consensus splice donor/acceptor sequence combination (maximum entropy
score
⬎
5 for both 5=ss and 3=ss), suggesting that the NA8 spliced isoform might be
produced in other N2 strains as well. This isoform is likely specific to the N2 subtype
since neither the 5=ss nor the 3=ss is conserved in 7825 unique NA sequences from
non-N2 strains (all 5=ss have a maximum entropy score
⬍
0.4, and most 3=ss have a low
score; only 7 of the 7,825 sequences have a maximum entropy
⬎
5).
[image:8.585.41.552.82.261.2]Detection of NA isoforms using mass spectroscopy.
To confirm expression of NA
isoforms at the protein level, we excluded classic protein detection methods (e.g.,
Western blot assay) because there are no reagents that distinguish spliced NAs from
native NA. Supernatants of BEAS-2B cells infected with strains of IAV/H3N2 collected at
24 to 48 hpi were subjected to mass spectrometry [MS], searching in particular for
peptides specific to particular spliced isoforms. For example, NA5 lacks residues
be-tween 127 and 319 of native NA therefore tryptic cleavage of the bond C-terminal to
TABLE 1Fractional expression of AS transcripts from IAV/H3N2 segments NA, M, and NSa
Segment Isoform
% of total segment expressionb
BR10/07 PER16/09 UD/72
1 hpi 6 hpi 24 hpi 1 hpi 6 hpi 24 hpi 1 hpi 6 hpi 24 hpi
NA NA1 100.00 99.49 98.26 100.00 99.35 98.41 93.75 87.94 86.05
NA2 – – – – – – 0.00 0.54 0.75
NA3 – – – – – – 6.24 9.84 11.18
NA4 – – – – – – 0.00 0.54 0.63
NA5 – – – – – – 0.00 0.31 0.38
NA6 – – – – – – 0.01 0.55 0.70
NA7 – – – – – – 0.00 0.28 0.30
NA8 0.00 0.51 1.74 0.00 0.65 1.59 – – –
M M1 99.80 98.92 99.15 98.55 98.07 99.11 96.69 99.37 99.57
M2 0.20 1.08 0.85 1.45 1.93 0.89 3.31 0.63 0.43
NS NS1 97.71 99.02 98.52 99.17 99.41 99.29 99.00 97.92 94.88
NS2 2.29 0.98 1.48 0.83 0.59 0.71 1.00 2.08 5.12
aThe abundances of the spliced transcripts of segments NA, M, and NS were calculated from the RNA-seq data set and are expressed as percentages. The fractional
expression of alternatively spliced transcripts from IAV/H3N2 segments NA, M, and NS was determined by Cufflinks analysis (see Materials and Methods).
b–, Expression was not quantified because the isoform was not identified in this virus.
on November 6, 2019 by guest
http://jvi.asm.org/
R118 and N-terminal to K128 produces the peptide EPYVSCDPDK in native NA and the
unique peptide EPYVSCDPGLVGDTPR in NA5. As shown in Fig. 5A and Table S1 in the
supplemental material, liquid chromatography/high-resolution MS (LC-MS/MS) analysis
revealed the presence of two peptides unique to the NA5 variant (EPYVSCDPGLVGDTPR
and LSAGGDIWVTREPYVSCDPGLVGDTPR), confirming its expression in UD/72-infected
BEAS-2B cells.
The NA8 isoform was not detected in supernatants of BR10/07 and PER16/09
infected-BEAS-2B cells by LC-MS/MS (Waters), possibly because it was below the
detection limit (10 fmol). Thus, we employed an Orbitrap Lumos targeted MS/MS (tMS2)
acquisition method, followed by dual search for the NA8 variant predicted in seasonal
strains. The predicted NA8-specific peptide LHQSVLLCGVDK was detected at
m/z
456.92
(
z
⫽
3) where cysteine is carbamidomethylated (
⫹
57 Da) (Fig. 5B). As shown in Fig. 5C,
the predicted NA8-specific peptide LHQSVLLCGVDK has the same fragmentation
pat-tern (Fig. 5B) and chromatographic elution profile as those of its heavy synthetic analog
(see Fig. S3 in the supplemental material), confirming the existence of AS product of
NA8 in both PER/16/09 and BR10/07 strains (Fig. 5C and D). The amount of NA8 in 1
g
of supernatant is estimated at 170 and 20 amol, respectively, for PER16/09 and BR10/07
comprising about 1 to 2% of NA proteins (data not shown). Based on the intensities of
common NA peptides, the NA proteins are about nine times more abundant in
PER/16/09 strain than in BR10/07 (data not shown).
We were unable to confirm peptides unique to NA2-4 and NA6-7 in the UD/72
digests we analyzed, possibly due to their low abundance. Deeper sequencing or
antibody-based methods could potentially confirm protein expression or a lack of
expression of these remaining isoforms.
Homology modeling of AS NA isoforms.
Next, we performed homology
mod-eling to determine whether AS affects the tertiary structure of the protein, e.g.,
alters regions of the protein core (binding site) or occurs in disordered regions.
Native NA of UD/72 and PER16/09 as well as NA5 (UD/72) and NA8 (PER16/09)
sequences were submitted to the I-TASSER homology modeling program. Models
were compared to native NA tetramers to determine whether or not they are likely
to be incorporated into native multimers or form multimers with themselves. NA of
UD/72 or PER16/09 is likely to form a tetramer with itself since both interfaces (the
interface formed by the 100, 160, and 460 regions and the interface formed by the
-37 37 R P T D G V L G P D C S V Y P E E P Y V S C D P G L V G D T P R b2-H2O b2 y3 y5-H2O y7-H2O b12-H2O b11-H2O b11 y15-H2O EPYVSCDPGLVGDTPR E rro r (p p m )
A
LHQSVLLCGVDKB
D
C
27.4 27.6 27.8 28.0 28.2 28.4 Retention Time 0.0e0 5.0e3 1.0e4 1.5e4 2.0e4 Intensity
y6 - 691.3443+ y5 - 578.2603+ y4 - 418.2296+ y2 - 262.1397+
28.2 0 ppm 28.0 -2.3 ppm
27.4 27.6 27.8 28.0 28.2 28.4 Retention Time 0.0e0 1.0e6 2.0e6 3.0e6 4.0e6 5.0e6 6.0e6 Intensity
y6 - 699.3585+ (heavy) y5 - 586.2745+ (heavy) y4 - 426.2438+ (heavy) y2 - 270.1539+ (heavy)
28.6 -1.2 ppm 28.4 -1.2 ppm 27.5 -1.3 ppm 27.9 0 ppm (dotp 0.74)
27.4 27.6 27.8 28.0 28.2 28.4 Retention Time 0.0e0 1.0e3 2.0e3 3.0e3 4.0e3 5.0e3 Intensity
y6 - 691.3443+ y5 - 578.2603+ y4 - 418.2296+ y2 - 262.1397+
27.9 -1.2 ppm
27.4 27.6 27.8 28.0 28.2 28.4 Retention Time 0.0e0 1.0e6 2.0e6 3.0e6 4.0e6 5.0e6 6.0e6 7.0e6 Intensity
y6 - 699.3585+ (heavy) y5 - 586.2745+ (heavy) y4 - 426.2438+ (heavy) y2 - 270.1539+ (heavy)
28.4 -1.5 ppm 28.3 -1.2 ppm 27.4 -1.1 ppm 27.9 -0.3 ppm (dotp 0.74)
FIG 5Mass spectrometry detection of NA5 and NA8 isoforms. (A) Representative LC-MS/MS fragment spectra of NA5-specific peptide identified in
trypsin-digested supernatants from UD/72-infected BEAS-2B cells. Annotation was carried out using PLGS software (Waters). (B) Representative fragment spectra of NA8-specific peptide from PER16/09-infected BEAS-2B cells using MS2 acquisition method. (C and D) Fragment ion chromatograms of the native NA8-specific peptide (top) and its heavy synthetic analog (bottom) from PER16/09 (C) and BR10/07 (D) supernatants.
on November 6, 2019 by guest
http://jvi.asm.org/
[image:9.585.50.540.72.277.2]140/150, 170, 200, and 210 regions) are fully formed and identical to other N2
structures (Fig. 6A and B). Notably, the enzyme active site in each is unchanged
relative to other N2 structures. NA5 is predicted to be unable to bind to any other
monomer because of the large portions of missing sequence and structure, and the
active site is likely only partially formed if at all (Fig. 6C). NA8 is not likely to form
a tetramer as one interface is incomplete (the 160 and 460 regions are absent) and,
although components of the second interface are present, the absence of part of
the protein likely alters the configuration of this region (Fig. 6D). A portion of the
active site is missing (the 430 loop and the 405 region) which would likely
compromise active-site binding.
Host transcriptome of BEAS-2B cells infected with seasonal H3N2 viruses.
To
date, immune responses of epithelial cells to UD/72 infection have been reported (18).
We sought to further characterize differences in induction of innate immunity-related
pathways by each of the three H3N2 viruses and between the two seasonal viruses and
UD/72 at the mRNA level. We first identified differentially expressed genes (DEGs) in
BEAS-2B cells infected with seasonal or laboratory strains compared to time-matched,
mock-infected cells. We detected a total of 81, 372, and 1,614 DEGs at 1, 6, and 24 hpi,
respectively (Data Set S1 in the supplemental material and Fig. 7A). The laboratory
strain UD/72 induced the highest number of DEGs at each time point, such that
UD/72-specific DEGs accounted for 42, 58, and 72% of all DEGs identified at 1, 6, and
24 hpi, respectively. Next, we curated a list of 804 innate immunity genes from several
publications (18, 40–45), negative and positive regulators of IFN-

(46), and from HUGO
gene families that include IFN-related genes or “IFN” as a term (see Data Set S1 in the
supplemental material). Of the 804 innate immunity genes, 119 were either up- or
downregulated during infection, while 685 were not differentially expressed (Fig. 7B
and see Table S2 in the supplemental material). Figure 7C shows a heat map of the
expression of the 119 DEGs ordered by unsupervised hierarchical clustering analysis
and Table S2 reports DEGs with
⬎
2-fold change in virus-matched gene expression.
Twenty-two DEGs were upregulated by all three viruses, including ISGs that are
antiviral (e.g.,
MX1
,
OAS
,
RSAD2
[viperin], and
IFIT1-3
), induce IFN expression (
DDX58
[
RIG-I
] and
DDX60
), repress IFN expression through posttranslational modification (e.g.,
A
B
C
D
FIG 6Homology modeling of AS NA isoforms. (A to D) Superimposition of native NA monomer
homology models from UD/72 (A), PER16/09 (B), and AS isoform NA5 (C) and AS isoform NA8 (D), each
indicated in magenta, onto a tetramer of a crystal structure of 1957 pandemic N2 NA (PDB 3TIA)
(multicolored). NA of UD/72 and PER16/09 are likely to form multimers with themselves or be incorpo-rated into native multimers. NA8 and NA5 are unlikely to form multimeric structures since they are missing large portions of sequence that form all or part of the binding interfaces.
on November 6, 2019 by guest
http://jvi.asm.org/
[image:10.585.80.323.73.276.2]the ubiquitin-like
ISG15
[47] and the E3 ligase
TRIM69
), or attenuate IFN signaling (e.g.,
USP18
[48] and guanylate binding protein 4 [
GBP4
], which inhibits IRF7 [49]). The
expression of
IFNAR1
, which encodes the low-affinity subunit of the type I IFN receptor,
decreased after infection with UD/72 and PER16/09, but not BR10/07 at 6 hpi. As
previously reported (18), in addition to the classic antiviral ISGs, UD/72 predominantly
induced expression of a large set of proinflammatory genes that were either not
induced (
CXCL9
,
CXCL10
,
IL-6
,
CCL2
,
CXCL1
, and
CXCL2
) or were only minimally induced
by seasonal strains compared to UD/72 (
CCL5
and
CXCL8
).
Overall, seasonal and laboratory strains showed similar patterns of DEGs and a
similar induction of key transcription factors (TF) that either form an ISGF3 complex
(
STAT1
and
IRF9
) or are induced by ISGF3 (
IRF7
). However, the patterns of DEGs differed
in time and magnitude for the two seasonal viruses; a common set of genes was
induced earlier and to higher levels in response to PER16/09 than to BR10/07 infection.
Only BR10/07 did not significantly induce expression of
IRF1
. In addition, only UD/72
A
B
C
D
1 hpi BR10/07 PER16/09 UD/72 34 4 3 21 6 0 13 6 hpi BR10/07 PER16/09 UD/72 215 45 41 6 7 8 50 24 hpi BR10/07 PER16/09 UD/72 1163 53 294 4 6 5 89 685B R 10/07
Immune Genes
P E R 16/09 U D /72
CXCL11 CXCL10 IFIT1B IFNB1 IFNL1 CCL5 TRIM69 IFIH1 GBP4 CXCL1 TNFAIP3 NFKBIA IL8 IFITM3 IRF9 BST2 TNFSF10 IFITM1 MX2 RSAD2 ISG15 IFI6 IFI44L IFI27 MX1 OAS2 DDX58 IFI44 OASL IFIT2 IFIT1 OAS1 IFIT3 JUNB ATF3 SERPINE1 TLR4 IL18 AGPAT9 C1QBP EPHA2 DUSP5 MAFF MAP1LC3B ANKFY1 IFNAR1 IRF6 PLK1 IFITM2 LY6E AHNAK2 CD9 EPAS1 MT1X NFKBIZ CXCL2 CEBPD ADM SLFN5 TXNIP DDX60 XAF1 HERC6 IFI16 SAMHD1 IFI35 EPSTI1 IL17F GBP5 DHX58 TYMP OAS3 HELZ2 IRF7 PLSCR1 USP18 TRIM22 EIF2AK2 ADAR NMI APOL6 BATF2 PARP12 RTP4 FAM46A STAT1 LAP3 DTX3L TDRD7 IL6 TNFAIP6 CCL2 IFNL2 CXCL3 IRF1 CFB B2M CHMP5 TRIM21 IFIT5 PNPT1 MB21D1 NFKBID PLEKHA4 IL34 HSH2D RPL22 VMP1 NT5C3A GCA MAFB SOCS1 NCF1 IL32 G6PC IL10 CXCL9 IL17RE IFNL3
−2 −1 0 1 2 Value Color Key
FIG 7BEAS-2B transcriptome during infection with IAV/H3N2: changes at the mRNA level. (A) Venn diagrams of the global host gene responses (either
enhanced or reduced) to IAV/H3N2 strains at each time point. (B) Venn diagram of “immune-related genes” differentially expressed in response to each of the three IAV/H3N2 at 1, 6, or 24 h. (C) Hierarchical clustering of the 119 DEGs from the “immune-related genes” group. Heat map analysis of host transcriptome showing differentially up- and downregulated genes (yellow and blue, respectively) in IAV/H3N2 infected cells compared to mock-infected cells. (D) Enrichment of DNA binding motifs for selected IRFs located in the promoters of upregulated DEGs at 6 and 24 hpi. IRF and IFN-stimulated response element (ISRE) consensus motifs (109) are shown as controls.
on November 6, 2019 by guest
http://jvi.asm.org/
[image:11.585.47.538.71.495.2]induced a high expression of IFNB1/proinflammatory genes and showed early
expres-sion of TF components of the
IFNB1
enhanceosome (
JUNB
and
ATF3
) or a gene whose
product induces
IL-6
(
NFKBIZ
) (Fig. 7C and see Data Set S1 in the supplemental
material).
To further characterize pathways enriched with DEGs, we performed Ingenuity
Pathway Analysis (IPA), which revealed six canonical pathways shared by the three
H3N2 viruses at 6 and 24 hpi that included IFN signaling, the activation of IRF by
cytosolic PRR, and the role of PRR in recognition of bacteria and viruses (see Data Set
S2 in the supplemental material). The IPA upstream regulators feature predicted IRF7 as
a master upstream activator based on DEGs identified in each sample (see Fig. S4 and
Data Set S3 in the supplemental material). As shown in Fig. S4 in the supplemental
material, the network of IRF7-activated genes at 24 hpi revealed similar but distinct
patterns between seasonal and UD/72 strains.
Motif enrichment in promoters of upregulated DEGs during H3N2 infection.
TFs need to act at a certain distance from the transcription start site or other regulatory
sites, and thus TF binding sites cluster within promoter regions. Because the presence
of TF binding sites contributes to the transcriptional regulation of virally induced genes,
we used an
in silico
approach to predict motifs present in the promoters of DEGs that
were upregulated after H3N2 infection. We first evaluated the enrichment of
nonre-dundant TRANSFAC motifs, each representing a family of one or more related TF
binding motifs (50). TF motifs were evaluated based on the following criteria: (i) the
motif is enriched within promoters of upregulated DEGs compared to promoters of
unchanged genes, (ii) the TF is expressed (FPKM [fragments per kilobase per million]
⬎
5), (iii) the TF is predicted to be active based on IPA upstream regulator analysis, and
(iv) known target genes contain the binding motif.
IRF was the most highly enriched motif, demonstrating up to 115-fold enrichment
above unchanged promoters (see Data Set S4 in the supplemental material). Promoter
regions of ISGs are known to contain multiple ISREs and/or a combination of motifs that
recognize ISGF3 alone, ISGF3 with IRF7, or ISGF3 with both IRF7 and IRF3 (51). Thus, we
also evaluated enrichment of each IRF motif separately. A graphical representation of
the consensus sequence TGAA, shared among IRFs and ISRE is shown in Fig. S5A in the
supplemental material. In addition to IRF3 and IRF7, we found an enrichment of binding
motifs for IRF1 and IRF2 (Fig. 7D; see also Table S2 in the supplemental material).
Several IRF genes were expressed in H3N2-infected BEAS-2B cells, either constitutively
(IRF3) or differentially upregulated (IRF1 and IRF9) or downregulated (see Data Set S1
in the supplemental material). Though further experiments are required to confirm IRF
binding in enriched promoters, both enrichment and expression data suggest the
importance of these IRFs for H3N2-induced genes.
At 6 hpi in BR10/07 samples, no significant IRF motifs were predicted in the
promoters of upregulated DEGs (Fig. 7D). At 24 hpi, however, IRF promoter enrichment
in response to BR10/07 was similar to that of PER16/09 at 6 hpi, confirming that the
difference in response to these two seasonal viruses was mostly quantitative and
kinetic. In contrast, because the response to UD/72 was not limited to ISGs, the
enrichment of IRF binding motifs after UD/72 infection was relatively modest at 6 hpi
and fell at 24 hpi.
Other nonredundant motifs that met the TF motif search criteria include two
non-IRF TFs: RelA (52, 53) and the serum response transcription factor (SRF) (54) (see
Data Set S4 and Fig. S5B and C in the supplemental material). At 24 hpi, enrichment of
binding motifs for RelA and SRF was found in promoters of upregulated DEGs after
infection with PER16/09 and UD/72.
IFNB1
, which is upregulated during infection with
all three viruses, also has a binding motif for RelA in its promoter.
Novel RNA-based innate immune DEGs during H3N2 infection.
Next, we queried
whether dsRNA and RNA interference (RNAi) pathways (referred to here as RNA-based
innate immunity pathways) were affected during H3N2 infection. Because some small
RNAs were included in the query, we first assessed our RNA-seq library insert size (see
Fig. S6A in the supplemental material) and found that the most common insert size
on November 6, 2019 by guest
http://jvi.asm.org/
across samples is approximately 110 bp and many library fragments below 100 bp are
retained. Figure 8 shows heatmaps of RNA-based innate immune DEGs ordered by
unsupervised hierarchical clustering analysis. Among these, we found several small
nucleolar RNAs (snoRNAs), a class of noncoding RNAs involved in canonical functions
such as ribosome biogenesis, modification of ribonucleotides, and cleavage of pre-rRNA
(55, 56). We also verified the size distribution of differentially expressed snoRNAs during
H3N2 infection (see Fig. S6B in the supplemental material). To reduce the technical
bias due to library size selection, we removed snoRNAs that were shorter than 100
bp in size or showed high variance between replicates in any treatment condition.
snoRNAs are classified into three groups: SNORDs, possessing the C/D box and
directing the 2=-O-ribose methylation of rRNAs; SNORAs, containing the H/ACA box
SNHG8 GAS5 SNHG15 SNORA38B SCARNA23 SNHG6 SNORA64 SNORA27 SNORD94 SNORA25 SNHG12 SNORD22 SNORD89 AGO3 SNIP1 DLEU2 SNORA51 SNORD15A SNORA33 SNHG4 SNORA40 SNORA5C SNORA5A SCARNA7 SCARNA21 SNORA8 SNORA7B SNORA10 SNHG10 SNORA32 SNHG7 SNORA21 SNORA67 SNORA16A SNORA44 SNORA71C SNORA76 SNORA81 SNORA20 SNORA74B SNORA24 SNORA2A SNORA9 SNORA17 SNORA78 SNORA18 SNORA50 SNORA14B SNORA26 SNORA3 SNORA62 SNORA4
MIR100HG HCFC1 SNORA84 EIF2AK2
FIG 8BEAS-2B transcriptome during infection with IAV/H3N2: changes in RNA-based immunity. Hierarchical clustering of the DEGs
from RNA-based immunity list. Results for up- and downregulated DEGs (yellow and blue, respectively) in UD/72-infected cells (A) or in UD/72- and PER16/09-infected cells (B) compared to mock-infected cells are shown.
on November 6, 2019 by guest
http://jvi.asm.org/
[image:13.585.46.462.76.549.2]and guiding synthesis of ribosomal pseudouridines; and SCARNAs, forming a
complex with small nuclear proteins (SNURPs) and guiding modification of snRNA
(e.g., U1, U2, U4, U5, and U12) (57).
Compared to mock-infected, time-matched samples, UD/72 infection shows the
greatest ability to modulate snoRNA expression (Fig. 8A). In UD/72-infected cells, five of
the six H/ACA box snoRNAs (SNORA8, -18, -25, -32, and -40) that share the same host
gene TAF(I) are upregulated. TAF(I) functions in RNA polymerase I transcription, resides
at the rRNA gene promoter in the nucleolus, and copurifies with the complex SL1 (58).
In addition, snoRNAs with reported noncanonical functions (56), such as regulation of
chromatin structure (SNORD15A and SNORA3, -81, -64, -44, and -40), and miRNA-like
overlapping functions (SNORA81-miR1248) were upregulated by UD/72.
A small subset of RNA-based innate immunity genes show similar patterns of
expression in PER16/09 as in UD/72 (Fig. 8B). At 24 hpi, PER16/09 or UD/72 infection
were associated with a 2-fold increase of
EIF2AK2
, coding for PKR, a dsRNA-binding
protein component of the dsRNA/IFN and RNAi pathways, which share two additional
partners, PACT and TRBP, with Dicer (59–61). PER16/09 and UD/72 also upregulate
PIWIL2
, a member of the RNAi pathway. One target, HCFC1, is downregulated in
PER16/09 or UD/72 infection with respect to mock-infected samples.
H3N2 viruses differentially modulate AS of host genes.
We then used an
exon-centric approach (62) to determine whether H3N2 infection induced differential
expression of AS variants of host genes. Figure 9A shows the number of variants for
each type of AS event at 1, 6, and 24 hpi. We detected 775 genes showing AS in at least
one infected sample (see Data Set S1 in the supplemental material). Pathways and gene
ontologies enriched in each data set include RNA binding, nonsense-mediated decay,
cell cycle process, influenza life cycle, and influenza viral RNA transcription (see Fig. S7
in the supplemental material). Many of the genes involved in these pathways/functions
are ribosomal protein genes. For example, the genes found in the influenza life cycle
pathway, enriched in cells infected with BR10/07 or PER16/09, are
RPLP1
,
RPL4
,
RPL31
,
RPS2
,
NUP155
,
RPL13A
,
GRSF1
, and
RP24
(see Data Set S1 in the supplemental material).
Among the AS events differentially induced by seasonal and laboratory strains, we
report one example of each of exon inclusion, intron retention, and alternative donor
splice site.
TANK
-binding kinase 1 (
TBK1
) is critical to antiviral defense and regulates IKK
, which
in turn phosphorylates IRF3 and IRF7 (63).
TBK1
is also known to have an AS variant in
which exons 3 to 6 of the 21 exons are skipped (64). However, we discovered a novel
AS event of inclusion of a previously unannotated
TBK1
exon between exons 15 and 16
of the reference isoform (
NM_013254
) associated with UD/72 infection (Fig. 9B). This
novel exon gives rise to a frameshift splice variant that consists of 22 exons and is
terminated by an early stop codon deleting the last 155 amino acids of TBK1,
corre-sponding to the binding domain for TBKBP1, AZI2, and TANK (65). The predicted TBK1
variant induced by UD/72 infection at 24 hpi was confirmed by quantitative PCR (qPCR)
(Fig. 9C).
At 1 hpi, BR10/07 induced an intron retention event of
DDIT3
, with inclusion of an
additional 23 amino acids at the N terminus (Fig. 9D).
DDIT3
encodes a proapoptotic TF,
which participates in the endoplasmic reticulum stress response to induce expression
of inflammatory genes such as
IL-6
and
CXCL8
(66). Intron retention of DDIT3 by
BR10/07 at 1 hpi was evaluated by qPCR (Fig. 9E).
Finally, we report an example of an alternative donor splice site (5=ss). At 24 hpi, the
two seasonal viruses BR10/07 and PER16/09 induced AS of
IFI35
(Fig. 9F), a negative
regulator of RIG-I, that associates with NMI protein after treatment with IFN-
␣
(67). This
AS 5=ss event generates an in-frame deletion of six bases that encode amino acids 126
to 127 (Val-Met) in the NMI domain that mediates interaction with IFI35. The alternative
5=ss was confirmed by qPCR (Fig. 9G). To our knowledge, this is the first report of
modulation of AS of host transcripts during IAV/H3N2 infection that may impair innate
immune responses.
on November 6, 2019 by guest
http://jvi.asm.org/
A
BR10/07 PER16/09 UD/72Alternative donor Mutually exclusive exons Retained intron Alternative acceptor Alternative last exon Skipped exon Alternative first exon
0 50 100 150 0 50 100 150 0 50 100 150
Time 1h 6h 24h
C
Number of Genes
F
IFI35 24hpi 23.3 46.7 70 RP K M 11 29 BR10/07_24h 23.3 46.7 70 RP K M 32 45 PER16/09_24h41165287 41165323 41165363 41165425 41165524 41165560 41165600 41165640 41165676
23.3 46.7 70 RP K M 16 UD/72_24h 23.3 46.7 70 RP K M 26 Mock_24h
Genomic coordinate (chr17), "+" strand
0 2 4 7 Ψ 0 3 6 10 Ψ
00.2 0.4 0.6 0.81
[image:15.585.42.431.69.706.2]0 4 8 13 Ψ 0 5 11 16 Ψ = 0.67 [0.50, 0.81] = 0.55 [0.43, 0.66] = 0.91 [0.71, 0.99] = 0.94 [0.82, 0.99] MISO Ψ
D
DDIT3 1hpi 23.3 46.7 70 RP K M 23 23.3 46.7 70 RP KM 42 BR10/07_1h
23.3 46.7 70 RP K M 7 PER16/09_1h
57911055 57911115 57911175 57911235 57911295 57911355 57911415 57911475 57911535 23.3
46.7 70
RPKM
22 UD/72_1h
Genomic coordinate (chr12), "-" strand
0 3 7
11 Ψ= 0.49
[0.40, 0.59]
0 4 8
13 Ψ= 0.89
[0.78, 0.98]
00.2 0.4 0.6 0.8 1
0 3 7 11 Ψ= 0.77 [0.66, 0.87] 0 4 9 13 Ψ [0.73, 0.90] = 0.82 MISO Ψ Mock_1h
B
TBK1 24hpi 3 10 20 30 RP K M 108 Mock_24h 10 20 30 RP K M 80 4 11 BR10/07_24h 10 20 30 RP K M 5 54 4 PER16/09_24h64889482 64889514 64889550 64889766 6488 9802 64889838 64889879 64890147 64890183
10 20 30 RP K M 15 5 10 UD/72_24h
Genomic coordinate (chr12), "+" strand
0 4 8 12 0 3 6 10 0 2 5 8
00.2 0.4 0.6 0.8 1
0 1 2 3 Ψ= 0.11 [0.01, 0.30] Ψ= 0.17 [0.08, 0.34] Ψ= 0.16 [0.04, 0.37] Ψ= 0.54 [0.25, 0.88] MISO Ψ 3
E
G
MOCK BR10/07 PER16/09 UD/72 0 1 2 3 4 5 DDIT3Relative ratio of intron retained/spliced
MOCK BR10/07 PER16/09 UD/72 0.0 0.2 0.4 0.6 0.8 1.0 TBK1
Relative ratio of exon inclusion/exon skipping
MOCK BR 10/07 PER16/09 UD/72 0.3 0.6 IFI35
Relative ratio of proximal 5’
ss/distal 5’
ss
FIG 9AS events of BEAS-2B transcriptome during infection with IAV/H3N2: changes at the level of the mRNA structure. (A)
Schematic of the host AS events (left) and the frequency of each event type during IAV/H3N2 infection (right panels). (B to
(Continued on next page)
on November 6, 2019 by guest
http://jvi.asm.org/
DISCUSSION
For many years, studies of cellular host responses to virus infection focused on
global changes at the mRNA level. More recently, RNA-seq has been used to dissect key
regulatory events at the RNA level such as splicing and noncoding RNAi. Here, we used
a strand-specific dual RNA-seq strategy to characterize novel elements of interactions
between the BEAS-2B human bronchial epithelial cell line and three strains of IAV/
H3N2: two seasonal strains and the laboratory strain, UD/72.
Transcriptome analysis of BEAS-2B cells infected with seasonal IAVs BR10/07 and
PER16/09 and the laboratory strain UD/72 showed the induction of a similar pattern of
ISG expression and IRF7-centered immune responses. This pattern was representative
of the response of other epithelial cell lines to infection with respiratory viruses (18, 19),
including the highly passaged IAV laboratory strain UD/72 (18, 19). However, we only
identified a small number of immune DEGs induced by IAV/H3N2. and this might be in
line with low enhancement of ISGs in BEAS-2B cells, as reported by Seng et al. (68).
Compared to seasonal strains, UD/72 induced delayed expression of many classic ISGs
and pronounced expression of proinflammatory chemoattractants
CXCL9
and
CXCL10
,
both of which are ISGs, and the neutrophil chemoattractants
CXCL1
and
CXCL8
. Immune
DEGs were, however, more similar between UD/72 and PER16/09 than between the two
seasonal strains. One possible mechanism is the potential recruitment of TFs, including
IRFs. Based on our
in silico
analysis of TF motifs, IRF binding site enrichment in promoters
of upregulated DEGs suggests magnitude and kinetic differences between the two
sea-sonal strains (Fig. 7D). Enrichment of non-IRF TF motifs (see Fig. S4B and C and Data Set S4
in the supplemental material) such as RelA could explain the pronounced enhancement of
proinflammatory chemokines by UD/72 (Fig. 7C). Though the presence of a TF binding site
does not necessarily imply a direct effect on expression of the gene, it is striking that at 24
hpi an enrichment for the RelA motif occurs in the promoter regions of many DEGs
upregulated uniquely by UD/72 infection. Such DEGs include gene functions involved in
inflammatory response signaling,
TNFAIP3
and members of NFK-B inhibitory family (e.g.,
NFKBIA
,
NFKBID
, and
RELB
), proinflammatory molecules
IL-6
and
IL-32
, or
EGR1
, which
acts as TF to regulate
CXCL2
expression. Interestingly, the
EGR1
promoter also had the
highest number of SRF motifs (i.e., five) among genes upregulated by UD/72. Another
potential mechanism to explain the immune DEGs shared between UD/72 and
PER16/09 might be the expression of dsRNA effectors (e.g., PKR) or of other RNAs that
may participate in RNA-based innate immunity.
The BEAS-2B transcriptome revealed changes in the expression of RNA-based innate
immune genes, including effectors, such as
EIF2AK2
(PKR),
AGO3
, and
PIWI/L2
, as well as
expression of snoRNAs (Fig. 8). To date, the role of snoRNAs during RNA virus infection
has not been fully elucidated. snoRNAs guide the chemical modification of snRNA and
mRNA nucleotides and influence AS of pre-mRNAs, in addition to other noncanonical
functions (69). Murine lung cells infected with severe acute respiratory syndrome
coronavirus or IAV/Puerto Rico/8/34 strains show differential expression of 30 small
RNAs overlapping with annotated snoRNAs (70). Human HEK293T cells infected with
chikungunya virus upregulate a group of snoRNAs—SNORD3, -44, -76, and -78 —all
clustering within the host long noncoding RNA
GAS5
(small nucleolar RNA host gene 2
[
SNHG2
]) with the exception of SNORD3 (71). UD/72 upregulates
GAS5
, a member of the
5-terminal oligopyrimidine gene (5=
TOP) family (72) that regulates transcription and
translation under conditions of growth arrest. Our data show that UD/72 upregulates
other
SNHG
s associated with cellular processes that may work together with the
FIG 9Legend (Continued)
G) Examples of AS differentially regulated by IAV/H3N2. For panels B, D, and F, the left side shows the RNA-seq read density along exons, the number of reads mapped to each splice junction, and the structural difference between alternative isoforms (below genomic coordinates), and the right side shows the distribution of percent spliced-in (PSI) expression estimates, with the 95% confidence interval indicated. Panels C, E, and G show validation by qPCR. (B and C) UD/72 differentially regulates
inclusion of a newly discovered exon ofTBK1. (D and E) BR10/07 differentially regulates intron retention ofDDIT3. (F and G)
BR10/07 and PER16/09 differentially regulate 5=AS ofIFI35.
on November 6, 2019 by guest
http://jvi.asm.org/
translational repression process. Further work is required to determine whether each
SNHG
has a unique role in influenza infection.
Subcellular localization of viral components plays an important role in host innate
responses. The nucleolus is the subnuclear compartment for ribosome biogenesis and
cellular location of
SNORA
s and
SNORD
s. It is also involved in the regulation of cellular
processes such as cell cycle, apoptosis, and RNA processing (73). Thus, it is likely that
the nucleolus acts as a platform for the virus to manipulate processes such as cell
growth and stress response, whose inhibition would encourage viral pathogenesis (73).
The nucleolus is engaged by viruses that replicate in the nucleus or cytoplasm (e.g.,
chikungunya) and two non-mutually exclusive mechanisms may occur: one by which
viral products target the nucleolus to modify its function(s), and the other by which
viruses employ nucleolar components to facilitate steps of their life cycle (73, 74). The
NS1 protein of IAV/H3N2 strains isolated from 1950 to 1987, including the laboratory
strain UD/72, carries a string of residues at the C terminus (K219, R220, R224, and K229)
that targets the nucleolus by binding to nucleolar proteins such as fibrillarin and
nucleolin (75, 76). All H3N2 strains used in our study contain these residues.
Interest-ingly, Melen et al. were the first to present a working hypothesis on viral replication not
being affected by depletion of the reported residues (75), suggesting that the primary
role for nucleolar localization of H3N2 and H2N2 NS1 proteins is modulation of the host
response. Additional evidences stem from the nucleolar proteome of HEK293 cells
infected with UD/72 (77), in which NP, PB2, NS2, and M1, in addition to NS1, were found
associated with nucleoli. The NP of UD/72 interacts with several components of
nucleolar pathways, including proteins involved in RNA maturation, such as RNA
polymerase I, which is responsible for transcription of ribosomal RNAs, and RNase P,
which plays a role in tRNA maturation (77).
Ribosome biogenesis is one of the processes that is modulated during viral
infec-tion. For example, herpes simplex virus 1, induces posttranscriptional cleavage of
precursor rRNA (78). Here, we report that infection with UD/72 induces host cell
upregulation of snoRNAs (Fig. 8), which play an important role in rRNA maturation.
While the mechanism of snoRNA upregulation is unclear, it is tempting to speculate
that it may represent a novel means by which the virus can affect nucleolar function to
promote viral pathogenesis.
Strand-specific RNA-seq retains the polarity of host and virus RNAs and enabled us
to identify three novel elements of host-virus interactions that differ during infection of
BEAS-2B cells with seasonal IAV and UD/72: (i) production of DI-like RNAs, (ii) host AS
modulated during viral infection, and (iii) novel AS of gene segment 6 (NA).
DI RNAs (33) serve as PAMPs to drive RIG-I- and MDA5-mediated expression of IFN
(79). DI RNAs may serve as an immunostimulator to protect from subsequent influenza
infection (9, 34, 79). DI-like RNAs have been identified in the nasopharynx of patients
infected with A/California/07/09 (H1N1pdm09) and may be transmitted from infected
patients along with infectious virus (34). Based on reported sequences of H1N1pdm09
and our own analysis, it appears that DI-like RNAs are strain specific (Fig. 2). In addition,
the calculated ratio of DI-like RNA to vRNA showed a modestly higher DI-like RNA
fraction in PER16/09 (Fig. 2G) than BR10/07. This may offer an explanation for why
PER16/09 induces higher early expression (6 hpi) of antiviral genes than BR10/07.
More than 90% of multiexon human genes undergo AS, suggesting that pre-mRNA
processing contributes to the cellular complexity of higher eukaryotes (80). However, it
is not fully understood how virus infection affects host AS. Viruses may differentially
modulate AS of host genes in order to counter host program(s) to generate more
protein isoforms of immune mediators (22, 23). One such example is modulation of AS
transcript of
MX1
(26) by herpes simplex virus 1. Alternatively, AS may control levels of
the gene product by maintaining levels of mRNA that produce functional proteins in
equilibrium with mRNA that generate nonfunctional products (81). How virus infection
may influence one or the other hypothesized AS functions is not yet known. Here, we
report three examples of host AS modulated by each H3N2 IAV (Fig. 9B to G), including
novel AS (exon inclusion) of
TBK1
induced by UD/72, which if expressed would generate
on November 6, 2019 by guest
http://jvi.asm.org/
a truncated protein lacking the C-terminal adaptor binding motif (82). TBK1 participates
in the activation of multiple signal transduction pathways, including IFN (with
sub-strates IRF3 and -7) and NF-
B (with substrates including IKK, I
B
␣
, and p65/RelA). The
specificity of substrates for TBK1 is determined by its choice of adaptors (82, 83). For
example, association with the adaptor IFN-induced protein with tetratricopeptide
repeats 3 enhances IFN expression, while ubiquitination and binding to NEMO
en-hances activation of NF-
B (82). Since each adaptor localizes to distinct cellular
com-partments (83), limiting TBK1 expression through the generation of a nonfunctional splice
variant may disable multiple or selected innate responses. If the protein generated by the
AS is stable, deletion of the adaptor binding motif of TBK1 might mimic an active state of
TBK1 that can bypass the regulation based on the adaptor choice or localization (83).
Whether the TBK1 AS variant found in UD/72-infected cells enhances NF-
B activation or
IFN production requires further investigation.
Finally, there were six novel splice events in gene segment 6 that encodes NA of the
laboratory strain UD/72 (Fig. 3) and one in NA of the seasonal strains. The UD/72 AS
events predict the generation of several frameshift products and one novel in-frame
product (Fig. 4). These events suggest two models for generation of the AS variants,
that are not mutually exclusive. The first model (proximity rule [84, 85]) proposes that
two or more 5=ss that share the same 3=ss cause stuttering of the viral polymerase, in
which the spliceosome redirects the splicing event from the distal to the proximal 5=ss.
The common 3=ss suggests its importance in the splicing event. This is consistent with
multiple predicted AS isoforms of UD/72 (Fig. 3), including the isoform NA5 that gives
rise to an in-frame product. Interestingly, one-third of AS events in mammals generate
in-frame premature termination codons, which play a role in regulation of gene
expression by controlling the abundance of splicing factors or RNA binding proteins
(80). The second model proposes that splicing efficiency is strain specific and thus may
be indicative of the ability of the virus to replicate (86, 87) or adapt to different hosts
(88). In line with this model, the highly passaged UD/72 virus acquired multiple weak
5=ss that are absent in the seasonal IAV/H3N2 strains (Fig. 4). One possible
interpreta-tion is that splicing of UD/72 NA is a result of host adaptainterpreta-tion, and it may result in
reduced viral virulence (88). The second model is consistent with the splicing of gene
segment 7 observed in the laboratory strains IAV/WSN33 (89), IAV/PR8 and in other
nonlaboratory strains (38) or splicing of the NS gene segment to produce a novel
product, NS3 in a mouse-adapted human IAV/H3N2 (88). Whether these AS events are
unique to laboratory and mouse-adapted strains of IAV and whether they depend on
specific cofactors of the splicing machinery of a specific cell line is not known.
Mass spectrometry confirmed the presence of NA5 in UD/72 supernatants and NA8
in supernatant from both seasonal strains (Fig. 5). It is also possible that the NA8
isoform is expressed in other IAV/N2 strains based on the observed conservation of the
5=ss and 3=ss. Our homology modeling indicates that NA5 and NA8 are not predicted
to assemble as the native NA does, though functional studies are needed to confirm
these predictions. In addition, these results do not preclude the possibility that the
translation product of a newly identified splicing variant could have a function
inde-pendent of the native tetrameric NA. Low abundance or protein degradation could
account for our inability to detect the other NA isoforms by mass spectrometry.
Alternatively, if NAs were expressed in the cells but not incorporated into new particles
along with HA and M, they would not be detectable in supernatants. Further
investi-gation in other cells, in additional IAV/H3N2 viruses, and
in vivo
will be of interest.
In conclusion, our data highlight the importance of RNA-seq in studying
host-pathogen interactions and identifying novel elements that may contribute to influenza
biology and to RNA-based innate immune responses.
MATERIALS AND METHODS
Cell culture, viruses, and infection.The BEAS-2B cell line (ATCC CRL-9609) was obtained from the
American Type Culture Collection (Manassas, VA) and cultured in serum-free base media (BEMB; Lonza, Walkersville, MD) supplemented with growth factors (BEGM; bullet kit catalog no. CC-3170). Cells were cryopreserved in BEGM supplemented with 1% polyvinylpyrrolidone and 7.5% dimethyl sulfoxide and
on November 6, 2019 by guest
http://jvi.asm.org/
stocks were used within five passages. Cells were grown in tissue culture plates coated at 37°C for 2 to 3 h in BEMB media containing 0.01 mg/ml fibronectin, 0.03 mg/ml bovine collagen type I, and 0.01 mg/ml bovine serum albumin (all from Sigma Chemicals, St. Louis, MO). Madin-Darby canine kidney (MDCK) cells (ATCC CCL-34) were grown in complete Dulbecco modified Eagle medium (Invitrogen, San
Diego, CA) supplemented with 7.5% fetal bovine serum (Invitrogen), 100 U/ml penicillin G, 100g/ml
streptomycin, and 2 mM glutamine (Invitrogen).
Two seasonal IAV/H3N2 viruses, A/Perth/16/2009 (PER16/09) and A/Brisbane/10/2007 (BR10/07), were kindly provided by Zhiping Ye and Alexander Klimov, respectively. UD/72 was a laboratory stock. Virus stocks were amplified in the allantoic cavity of 9- to 11-day-old embryonated chicken eggs for 48 h at 37°C. Viruses were titrated by plaque assay in MDCK cells. Titers were calculated using the Reed-Muench
method (90) and are expressed as log1050% tissue culture infective doses per ml.
BEAS-2B and MDCK cells were each plated (0.5⫻106/12-well plate), incubated at 37°C and 5% CO
2,
and maintained until they achieved 90% confluence. Infection of BEAS-2B and MDCK cells was performed at an MOI of 1 at 37°C. After 1 h of incubation at room temperature, the inoculum was removed and replaced with fresh media containing TPCK (tolylsulfonyl phenylalanyl chloromethyl ketone)-treated and
irradiated trypsin (1g/ml; Worthington Biochemical Corporation, Lakewood, NJ).
Strand-specific total RNA library preparation and sequencing.Total RNA was extracted using an
RNeasy minikit (Qiagen, Valencia, CA), followed by DNase treatment. All samples had a RNA integrity
score of⬎8 (Agilent Technologies, Santa Clara, CA). Starting from 1g of DNA-free total RNA extracted
from mock- and H3N2-infected BEAS-2B cells, rRNA was first removed by two rounds of selection using a Ribo-Zero rRNA removal kit (Epicentre, Madison WI). The resulting RNA was then used to construct an RNA-seq library using the Illumina Truseq strand-specific library preparation kit (Illumina, Inc., San Diego, CA). To obtain the final sequencing library, 14 cycles of PCR were performed using Phusion Hot Start high-fidelity DNA polymerase (Finnzymes, Espoo, Finland). RNA-seq libraries were size selected for the retention of insert fragments between 100 and 300 bp; mature small RNAs (including svRNAs) were not
considered in our analysis. For each sample replicate, we obtained⬃30 million paired 50-mer reads (with
three biological replicates per sample) using the Illumina Hiseq-2000 platform.
Host RNA-seq differential expression and splicing analysis. Raw reads were mapped to the
reference human genome (hg19, including chrUn_gl000220 for rRNA reads) by Tophat (v2.0.8b) (https:// ccb.jhu.edu/software/tophat/index.shtml) with the settings “– bowtie-n –no-discordant –no-mixed -r 120 –mate-std-dev 75” and using refFlat file for the -G option. Reads mapping to chrUn_gl000220 were removed as rRNA. We measured differential gene expression using DefinedRegionDifferentialSeq (USeq
8.7.6) (91;http://useq.sourceforge.net/), with the settings “-g H_sapiens_Feb_2009 -e 5 -j -t” and using a
flattened refFlat table for annotation (merged transcripts using MergeUCSCGeneTable [USeq]).
Define-dRegionDifferentialSeq calculates a negative binomialPvalue using DESeq2 (92), followed by a Benjamin
and Hochberg false discovery rate (FDR). Differentially expressed genes were those with an FDRⱕ10%
and an absolute log2ratio above 1. Differentially expressed snoRNA genes were those with an FDRⱕ1%,
an absolute log2ratio above 1, size⬎100 bp, and variance⬍0.8 between replicates of each sample.
Alternative splicing analysis was performed using MISO (v0.5.2;http://genes.mit.edu/burgelab/miso/)
with the settings “–paired-end 125 50 –read-len 50” and using “–num-inc 2 –num-exc 20 –num-sum-inc-exc 30 – delta-psi 0.30 – bayes-factor 20” for filtering events. Events were plotted with sashimi_plot. Events annotated to more than three genes were removed, and pathway and gene ontology enrichment
was performed using ToppGene (93) with an FDR of⬍0.05. Related pathways/ontologies (Gene
Ontol-ogy: Molecular Function, Gene OntolOntol-ogy: Biological Process, and REACTOME [94] pathways) were grouped and displayed as an Enrichment Map v.3.0.0 (95) network in Cytoscape v.3.5.1 (96) with an overlap frac