The importance of declining mammalian fungal specialists for ectomycorrhizal fungal dispersal
189
0
0
Full text
(2) The importance of declining mammalian fungal specialists for ectomycorrhizal fungal dispersal. Thesis submitted by Susan Joy Nuske BSc Hons University of Queensland in October 2017. For the degree of Doctor of Philosophy in the College of Science and Engineering James Cook University.
(3)
(4) Declaration I declare that this thesis is my own work and has not been submitted in any form for another degree or diploma at any university or other institution of tertiary education.. Information derived from the published or unpublished work of others has been acknowledged in the text and a list of references is given.. Every reasonable effort has been made to gain permission and acknowledge the owners of copyright material. I would be pleased to hear from any copyright owner who has been omitted or incorrectly acknowledged.. Signed, Susan Nuske.. i.
(5) Acknowledgements This thesis is part of a larger project, working on the population status and conservation of northern bettongs (Bettongia tropica) in collaboration with James Cook University, Queensland Government (Queensland Parks and Wildlife Service, Department of National Parks, Sport and Racing; Threatened Species Unit, Department of Environment and Heritage Protection), and WWF-Australia. The project was funded through the Australian Government’s Caring for Our Country grants program which was administered by WWF. There are also many other people and organisations that have contributed either monetarily or in-kind to this thesis. Without the combined, wonderful work of all these partners this thesis would not have been possible. As such, there are many people worthy of a very sincere thank-you. Firstly, thank-you to my supervisors, Sandra Abell, Brad Congdon and Andrew Krockenberger for their countless hours of discussions, emails, laughs and occasionally, tears. Thank-you also to Jessica Koleck, WWF-Australia Bettong Project Coordinator, for your tireless work and keeping me sane in tough working conditions. Massive thank-you to the other students and techs who were fellow mid-night bettong trappers: Stephanie Todd, Naomi Bowie, Elise Chatterton, Jess Koleck (again) and Tegan Whitehead. Also, thank-you to the National Park rangers, Rob Miller, Lana Little, Jack Cosgrove, Karl Goetze, Chris White, Julie Bunny and Miki Bradley. Thank-you also to Jane McDonald from EHP for your insightful discussions and support. Thank-you to Darren Crayn from the Australian Tropical Herbarium for your support and use of facilities. Thank-you to Melissa Harrison, ATH lab manager, for always allowing time for the simple questions and your valuable advice. A huge thank-you to our collaborators from The University of Tartu, Estonia, Leho Tedersoo and Sten Anslan. Leho, thank-you for your invitation to work in your lab. Your advice and patience with my many questions was invaluable. Sten, thanks for tireless work in the field and invaluable bioinformatics expertise! Your offer of help with the bioinformatics saved me a massive learning-curve and a lot of time! Thank-you also to others from the lab at U of Tartu that made the experience productive, fun and unforgettable; Rebeca Casique, He Jin Jong, Elia Ambrosio, Heidi Tamm, Rasmus Puusepp, Sergei Polme, Ingrid Liiv, among others. Thank-you to my co-authors for providing valuable advice and insights into this fascinating topic (Karl Vernes, Andrew Claridge and Tom May). Thanks again to Karl and Tom and to Chris Johnson for providing unpublished mycophagy data. Many thanks to Melissa Danks and Austin O’Malley for providing further details from their mycophagy studies to aid data collection for Chapter Two. Thank-you Jim Trappe for patiently answering many questions and being very welcoming into this mycological world. Thank-you also to the wonderful people at the Wet Tropics Management Authority, the Australasian Mycological Society, the North Queensland Wildlife Trust and Skyrail Rainforest Fountain for providing minor monetary support throughout this project. Many thanks to the tireless volunteers from all the field trips (in no particular order): Anton Moiseev, Megan Comerford, Sinead Bryant, Gabrielle Davidson, Sarah Hart, Di O'Rorke, Elliot Budd, Leanne Hales, Ori Albert-Mitchell, Marco Cucinelli, Maree ii.
(6) Baade, Mike Griggs, Paul Hales, Russell Best, Terry Purkiss, Elly Hetlam, Hiromu Nakamura, Umi Purnamasari, Raoul Alba, Rachel Barr, David Thomas, Hannah Thomas, Kath Kinneally, Andrew Krumins, Derek Preston, Vanessa Walker, Genevieve Buckton, Luke Windle, Elizabeth Lovett, Avril Underwood, Kaylene Bransgrove, Mark Bonner, Stu Biggs, Kelly Lambert, Annaliese Johnson, Melinda Greenfield, Claudia Paz. Special thanks to Rhona Macdonald for sticking with me for the hot, humid and downright ick conditions for almost two months! Thank-you also to the inspiring photographers Jurgen Freund and Stella Chiu-Freund who weren’t afraid to dig in the dirt with me, was excited alongside me in finding truffles and saved us many hours of driving by allowing me to store soil samples in their freezer! I also thank Amberlee Hatcher and Harriet Allen for literally helping with the dirty work in the lab (yes, including the poo!). Many people I would also like to thank for contributing to my ever-increasing knowledge of these beautiful ecosystems. Thank-you to David Tng, plant kingdom King, who taught me how to identify the trees and shrubs in my plots and elsewhere. A massive thank-you to Nigel Fechner, who contributed much to my understanding of fungi and their mysterious, elusive names (while never keeping a straight face). Thankyou to all the members of the Queensland Mycological Society (particularly, Pat Leonard, Fran Guard, Megan Prance and Susie Webster) who make fungi-finding fun, and welcomed a fellow myco-nerd in their mix. At the beginning of my adventure into fungi-world QMS provided valuable lessons at their workshops and forays. A massive thank-you also to the council members of the Australasian Mycological Society (John Dearnaley, Julianne Djordjevic, Celeste Linde, Leona Campbell, Bevan Weir, Jeff Powell and Dee Carter). It was a fantastic experience to be the first Student Representative for the society. Thank-you especially to Past President, Diana Leemon who was instrumental in creating the role. Humungous thanks to my friends (you know who you are), who provided me with much needed laughs and support throughout. Last, but by no means least, massive and heart-felt thank-you to my partner, Mark Bonner and my family. You were there and continue to be so throughout this tumultuous journey. Thank-you for believing in me.. iii.
(7) Northern bettong, Bettongia tropica, eating a truffle. Photo credit: Stephanie Todd.. iv.
(8) Statement of the Contribution of Others Item. Contribution. Intellectual Proposal writing support. Name (affiliation) Dr. Sandra Abell (primary advisor) Dr. Brad Congdon (secondary advisor) Dr. Andrew Krockenberger (third advisor). Statistical support. Dr. Sandra Abell Dr. Brad Congdon. Editorial assistance. Dr. Sandra Abell Dr. Brad Congdon Dr. Andrew Krockenberger. Co-authored accepted papers. Dr. Karl Vernes, Ecosystem Management, University of New England, Armidale NSW 2351 Australia Dr. Tom May, Royal Botanic Gardens Victoria, Melbourne, VIC 3004 Australia Dr. Andrew Claridge, Office of Environment and Heritage, NSW National Parks and Wildlife Service, Nature Conservation Section, P.O. Box 733, Queanbeyan, NSW 2620, Australia; School of Physical, Environmental and Mathematical Sciences, The University of New South Wales at Canberra, Northcott Drive, Canberra, ACT 2600, Australia Dr. Brad Congdon Dr. Andrew Krockengerber Dr. Sandra Abell. Data Collection. Provided unpublished data. Dr. Tom May, Royal Botanic Gardens Victoria, Melbourne, VIC 3004 Australia Dr. Chris Johnson, School of Biological Sciences, Zoology, University of Tasmania, Hobart, Tasmania 7001, Australia v.
(9) Dr. Karl Vernes, Ecosystem Management, University of New England, Armidale NSW 2351 Australia Field work – cage trapping and collection of scat samples and associated mammal identification data. Jessica Koleck, WWF-Australia Tegan Whitehead, JCU PhD Candidate Stephanie Todd, JCU PhD Candidate Naomi Bowie, JCU Research Assistant Elise Chatterton, JCU Research Assistant. Data Analysis. Bioinformatics (outlined in the 1st paragraph of Chapter Three, 3.3.3 Bioinformatics). Sten Anslan, Institute of Ecology and Earth Sciences, University of Tartu; 14A Ravila; 50411 Tartu; Estonia. Facility Use. Laboratory. Dr. Leho Tedersoo, Natural History Museum and Institute of Ecology and Earth Sciences, University of Tartu, 14A Ravila, Tartu EE50411 Estonia. vi.
(10) Contribution of Co-authors on Publications Chapter no.: Two Details of publications on which the chapter is based: Nuske*, S. J., K. Vernes, T. W. May, A. W. Claridge, B. C. Congdon, A. Krockenberger, and S. E. Abell. 2017. Redundancy among mammalian fungal dispersers and the importance of declining specialists. Fungal Ecology. 27: 1-13. Nuske*, S. J., K. Vernes, T. W. May, A. W. Claridge, B. C. Congdon, A. Krockenberger, and S. E. Abell. 2017. Data on the fungal species consumed by mammal species in Australia. Data in Brief. 12: 251-260. Nature and extent of the intellectual input of each author, including the candidate*: Nuske, S. J.*: Formation of concept, collection of data, data analysis, writing of manuscript Abell, S. E.: contribute to the formation of concept, support with data collection and analysis, editing early and final drafts of manuscript Congdon, B. C.: contribute to the formation of concept, support with data collection and analysis, editing early and final drafts of manuscript Krockenberger, A.: contribute to some of the formation of concept, editing final drafts of manuscript May, T. W.: contribute unpublished data, lend expertise to process some data (fungal names), editing final drafts of manuscript Vernes, K.: contribute unpublished data, support with data collection, editing final drafts of manuscript Claridge, A. W.: editing final drafts of manuscript. vii.
(11) Financial Support Item. Fund. Principal Investigator. Field and laboratory research. Australian Government Caring for our Country 2 Target Area Grant 2013/14 (Project ID: TAG14-00542) Bettongia tropica population status, viability and impact of fire with project partners James Cook University, Queensland Parks and Wildlife Service, Department of Environment and Heritage Protection and WWF-Australia.. Primary Advisor: Sandra Abell. North Queensland Wildlife Trust. Susan Nuske. Wet Tropics Management Authority. Susan Nuske. Australasian Mycological Society. Susan Nuske. Skyrail Rainforest Foundation. Susan Nuske. Australian Postgraduate Award. Susan Nuske. Stipend. viii.
(12) Abstract Conservation is more than just preserving biodiversity but also preserving ecosystem processes. Understanding how loss of diversity can affect the functioning of ecosystems requires understanding of the system’s functional redundancy. That is, how many species in the system perform similar roles and can compensate for the loss of similar species? In this thesis, I investigate the functional redundancy among mammal species involved in an important, yet poorly understood, interaction between three very different organisms; fungi, plants and mammals. Mycorrhizal fungi associate mutualistically with the roots of many plant species. In exchange for nutrients accessed by the fungi, the plants provide the fungus with sugars (carbohydrates) from their photosynthesis. Many mycorrhizal species form belowground fruit-bodies (truffles) that rely on mammals for spore dispersal. This interaction led to the hypothesis that mammals are important for fungal species diversity, plantfungal interactions and ecosystem functioning. However, little is known about how truffles contribute to the structure of mycorrhizal communities. For instance, are truffle taxa that mammals disperse important components of the mycorrhizal community as a whole and thus, can mammals influence mycorrhizal community structure? Globally, many different mammals are known to consume and disperse truffles, some to a much greater degree than others. For example, the term ‘fungal specialists’ is used for mammals that consume fungi for the majority of their diet (>50%, relative to other food types). Often as a consequence, fungal specialists can also consume (and disperse) a diversity of truffle species. Many mammals with generalist diets, on the other hand, frequently consume truffle fungi opportunistically. Hence, individual mammals with generalist diets often consume a lower diversity of truffle fungal species than mammals ix.
(13) with fungal specialist diets. However, currently it is unknown whether the combined fungal dispersal role of mammals with generalist diets equates to that of a specialist (i.e.: is there functional redundancy in the system?). In other words, if a fungal specialist were to become extinct in an ecosystem, is there enough functional redundancy that the dispersal roles for truffle fungi will be fulfilled by the remaining mammals with generalist diets? Understanding this interaction is particularly relevant to Australian ecosystems. Unfortunately, Australia has the highest rate of mammal extinction and decline, including fungal specialists within the family Potoroidae. Additionally, the majority of Australia’s native forests are dominated by woodland trees that host truffle-producing ectomycorrhizal (ECM) fungi (for instance, Eucalyptus, Corymbia, Allocasuarina, Melaleuca). In this thesis, I addressed a number of research questions aimed at better understanding how the loss of mammalian diversity could potentially impact on truffle populations and mycorrhizal communities. These research results pave the way to understanding how loss of mammal diversity could influence fungus-plant interactions and ecosystem functioning. In Chapter Two, a meta-analysis brings together discordant data on fungal diets of mammals across Australia. These data were used to ask whether there is functional redundancy in fungal dispersal roles among mammalian fungal specialists and mammals with generalist diets. Despite detecting a sampling bias in the literature, on average, fungal specialists consumed fungi at a higher diversity and abundance, and more consistently across seasons than mycophagous mammals with generalist diets, indicating little functional redundancy in general. However, some generalist mammals ate a fungal species diversity on par with specialists (Rattus fuscipes, Perameles nasuta x.
(14) and Wallabia bicolor) indicating that there may be functional redundancy in some systems. Studies presented in this meta-analysis utilised differences in morphological characters of spores to identify fungal species, however, this technique has limited resolution with some groups (e.g. Russulaceae). Additionally, much of the data could not be compared between studies because many taxa were undescribed (e.g. Unknown species 1). Results from Chapter Two are built on in Chapter Three, by directly comparing fungal diets of a specialist and nine co-occurring generalist fungal diets using modern DNA sequencing techniques. This direct comparison eliminated the biases associated with using data collected from different studies and allowed a higher resolution of fungal species diversity to be measured. I found that the fungal specialist, Bettongia tropica (northern bettong), consumed a significantly higher diversity and more unique mycorrhizal and truffle fungal taxa than the combined diets of the generalists. Bettongia tropica also had a significantly different fungal community in their diets. These trends were consistent across sites and seasons. These data suggest that there is little functional redundancy in this ecosystem and indicates that truffle fungi populations may be detrimentally impacted by the loss of the endangered B. tropica. To further understand whether potential loss of truffle taxa, via loss of specialists, would have detrimental impacts on fungal-plant interactions, a good understanding of the structure of the mycorrhizal community must first be obtained. Yet, particularly in Australia, little is known about the structure of mycorrhizal communities and how truffle diversity contributes to it. In Chapter Four, this knowledge gap was addressed by measuring the mycorrhizal community at different scales using molecular methods. I found that the dominant mycorrhizal fungal taxa associating with plant roots were xi.
(15) truffle taxa found in mycophagous mammalian diets. Over 80% of truffle taxa associating with roots were within the diet of the fungal specialist, and this percentage was just over half (52%) for generalist mammals. These data indicate that mammals, particularly those with specialist fungal diets, are important in shaping ECM fungal communities. This adds credence to the hypothesis that the loss of mammals could have detrimental effects on ECM communities and fungal-plant relationships. Overall, my thesis addressed key knowledge gaps in the interactions between mycophagous mammals, ECM fungi and their host plants. This work also highlights previously overlooked ramifications of native mammal loss in Australia, drawing particular attention to specialist mycophagists whose role in maintaining the diversity of ECM truffle fungal taxa may be irreplaceable.. xii.
(16) Table of Contents Declaration ....................................................................................................................... i Acknowledgements .........................................................................................................ii Statement of the Contribution of Others ...................................................................... v Contribution of Co-authors on Publications ..............................................................vii Financial Support ....................................................................................................... viii Abstract........................................................................................................................... ix List of Tables ................................................................................................................ xvi List of Figures................................................................................................................ xx List of Publications .................................................................................................... xxiv Chapter One: Introduction ............................................................................................ 1 1.1 Functional redundancy ............................................................................................ 1 1.2 The interactions ....................................................................................................... 2 1.3 What we don’t know ............................................................................................... 5 1.4 Data chapters ........................................................................................................... 6 Chapter Two: Redundancy among mammalian fungal dispersers and the importance of declining specialists. ............................................................................... 9 2.1 Abstract ................................................................................................................. 10 2.2 Introduction ........................................................................................................... 10 2.3 Materials and methods .......................................................................................... 14 2.3.1 Literature search ............................................................................................. 14 2.3.2 Developing inclusion criteria ......................................................................... 15 2.3.3 Compiling datasets ......................................................................................... 17 2.3.4 Data analysis ................................................................................................... 18 2.4 Results ................................................................................................................... 20 2.4.1 Fungal abundance in mammalian diets relative to other foodstuffs ............... 26 2.4.2 Frequency of fungi in mammalian diets across samples ................................ 29 2.4.3 Seasonality of fungi in mammalian diets ....................................................... 29 2.4.4 Fungal diversity within mammalian diets ...................................................... 30 2.5 Discussion ............................................................................................................. 35 Chapter Three: The consequences of losing the northern bettong, a fungal specialist, for the dispersal of ectomycorrhizal fungi ................................................ 40 3.1 Abstract ................................................................................................................. 40 xiii.
(17) 3.2 Introduction ........................................................................................................... 40 3.3 Methods ................................................................................................................. 42 3.3.1 Field sampling ................................................................................................. 42 3.3.2 Laboratory Analysis ........................................................................................ 43 3.3.3 Bioinformatics................................................................................................. 45 3.3.4 Statistical Analysis .......................................................................................... 46 3.4 Results ................................................................................................................... 48 3.4.1 Total richness .................................................................................................. 48 3.4.2 Relative abundance of taxa ............................................................................. 50 3.4.3 OTU richness per sample ................................................................................ 55 3.4.4 Unique OTUs .................................................................................................. 59 3.4.5 Fungal community structure ........................................................................... 59 3.5 Discussion .............................................................................................................. 64 Chapter Four: Dominant ectomycorrhizal fungi on roots are mammal dispersed 68 4. 1 Abstract ................................................................................................................. 68 4.2 Introduction ........................................................................................................... 68 4.3 Methods ................................................................................................................. 71 4.3.1 Field sampling ................................................................................................. 71 4.3.2 Laboratory Analysis ........................................................................................ 72 4.3.3 Statistical Analysis .......................................................................................... 73 4.4 Results ................................................................................................................... 74 4.4.1 Richness .......................................................................................................... 74 4.4.2 Relative abundance ......................................................................................... 77 4.4.3 Shared taxa between samples.......................................................................... 86 4.5 Discussion .............................................................................................................. 88 Chapter Five: Discussion and Synthesis..................................................................... 92 5.2 Future research ...................................................................................................... 95 5.2.1 Truffle population dynamics ........................................................................... 95 5.2.2 Generalist foraging behaviour......................................................................... 96 5.2.3 Climate change, mammals and fungi .............................................................. 97 5.2.4 Fungal conservation ........................................................................................ 98 References ..................................................................................................................... 99 Appendix A: Fungal species consumed by mammal species in Australia ............. 131 Appendix B: Mammal species per site and season .................................................. 136 xiv.
(18) Appendix C: Sequencing of local truffle database ................................................... 140 Appendix D: Ectomycorrhizal studies that sampled both epigeous and hypogeous taxa ............................................................................................................................... 144 Appendix E: Ectomycorrhizal taxa sequenced from this study compared to previous studies at the same site ................................................................................ 147. xv.
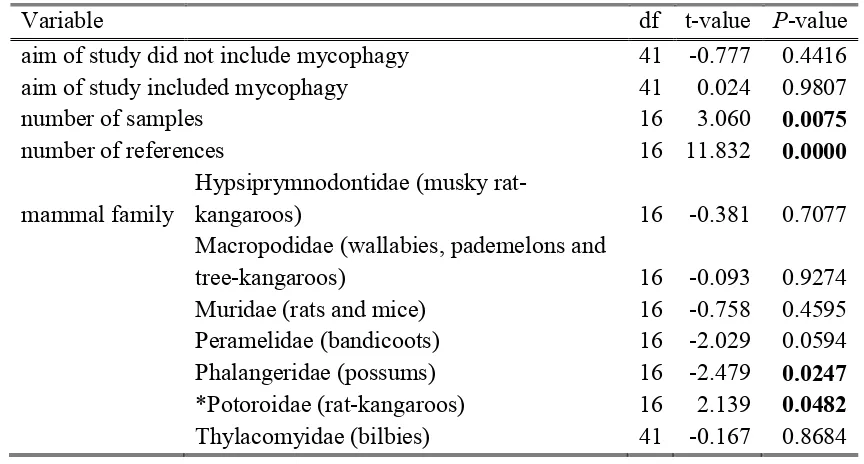
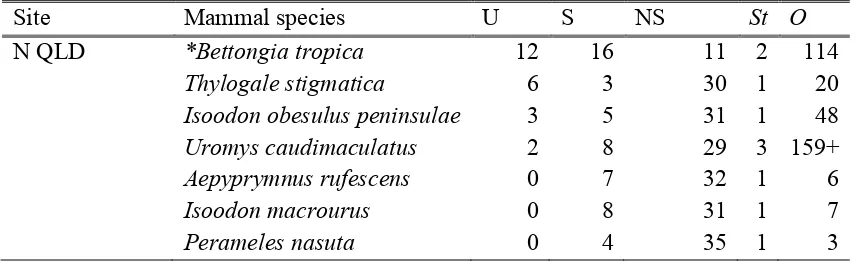
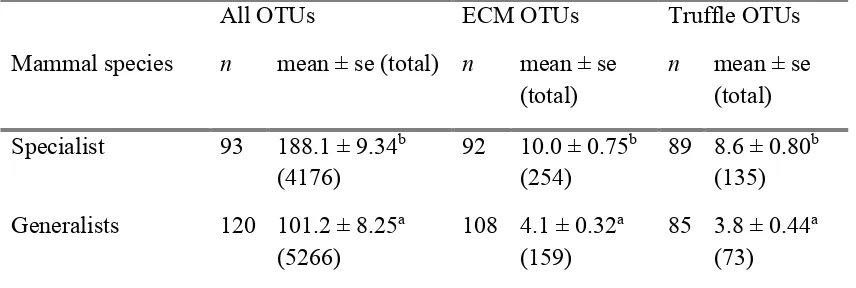
(19) List of Tables Table 2.1: Number of fungal species (sp) and genera (g) recorded in the diets of mammal species, mean ± SE. percentage of fungi in diet relative to other food stuffs (A), mean ± SE. percentage frequency of fungi eaten across samples (F), mean ± SE. percentage (frequency or presence) of fungi in diet in summer, autumn, winter and spring, respectively (S) and cumulative number of observations (O) across references in the abundanceA, frequencyF, diversityD and seasonalityS data, respectively. Species marked with asterisk* are fungal specialists. ................................................................. 21 Table 2.2: Linear Mixed Effects Model with the number of fungal species in a mammal species diet as the response variable. Fixed effects are aim of the study, cumulative number of samples number of references and mammal family and reference and location are random effects. The model explained 95.7% of the variation. Significant values are in bold (P <0.05). *Potoroidae include fungal specialists. ........................... 33 Table 2.3: Number of fungal species recorded within mammal species diets within 100 km of the three given locations. N QLD: North Queensland on Atherton Tablelands (17° 16' 15.99' S, 145° 38' 2.00'' E); N NSW: Northern New South Wales on Gibraltar Range (29° 32' 59.17'' S, 152° 16' 0.50'' E); SE NSW/E Vic: South Eastern NSW near Victorian border (37° 23' 30.00'' S, 149° 49' 19.99'' E). U: number of fungal species recorded within that mammal species’ diet compared only to the mammal species’ diets at the same location. S and NS are the fungi species recorded in that mammal species’ diet and the others at the same location, or not recorded in that mammal species’ diet but recorded in the others. St is the number of studies, O is the number of samples. Species marked with asterisk* are fungal specialists. .................................................... 34 Table 3.1: Truffle taxa from scats and number of OTUs per taxon (OTU). Taxa in boldface are truffles and underlined are secotioid or taxa that have uncertain taxonomic assignments and contain truffle and/or secotioid species and epigeous mushroom/cup species. Taxa in grey font are not native to Australia (see footnotes). .......................... 51 Table 3.2: Sample numbers (n) and mean ± SE OTU richness per sample (total OTU richness per mammal species) for the fungal specialist (Bettongia tropica) within Potoroidae and all non-bettong samples combined (generalists) across different subsets of the data (all OTUs, ectomycorrhizal OTUs and truffle OTUs). ................................ 55. xvi.
(20) Table 3.3: Results from type III ANOVA examining OTU richness per sample for different sections of the data and variation across OTU sequence count (depth) per sample, between sites (Davies Creek, Tinaroo Dam and Emu Creek), seasons (late dry, early wet and late wet) and mammal family (Potoroidae, Bettongia tropica, n = 93; Muridae, Melomys sp., n = 15, Rattus sp., n = 1, Uromys caudimaculatus, n = 30, Zyzomys argurus, n = 6; Peramelidae, Isoodon macrourus, n = 38, I. obesulus, n = 8, Perameles nasuta, n = 4). Significant P-values per variable are in bold. Richness and depth are transformed by natural log. ............................................................................. 56 Table 3.4: Results from Permutation Tests of a Redundancy Analysis examining the structure of the fungal community and interaction between sites (Davies Creek, Emu Creek and Tinaroo Dam), seasons (late dry, early wet and late dry) and ‘bettong’ (Bettongia tropica vs all generalist mammal species combined) for all OTU data (18.1% of the variation was examined by the axes). ................................................................... 62 Table 4.1: OTUs that make up the dominant proportion (cumulatively 90% of sequence abundance) of samples per site (DC = Davies Creek, TD = Tinaroo Dam), sample type and season, with number of replicates (n), total OTUs per sample (Total), percent relative abundance (RA), accession number, e-value, percentage similarity with database sequence (ID), percentage overlap with reference sequence (Cov) and OTU sequence length (SL). Taxa in boldface are truffles and underlined are secotioid or higher taxa that include truffle or secotioid taxa. When fruiting habit is listed at genus level it applies to the whole genus. Mycorrhizal status (Myc) is either ectomycorrhizal (ECM), ericoid mycorrhizal (ErM) or arbuscular mycorrhizal (AM). The mammalian specialist scats are from Bettongia tropica. The mammalian generalist scats are from Isoodon macrourus, I. obesulus, Melomys sp., Trichosurus vulpecula, Uromys caudimaculatus and Zyzomys argurus. ........................................................................... 80 Table A.1: Fungal species consumed by mammal species in North Queensland on the Atherton Tablelands. Taxa in boldface are truffles and underlined are secotioid or higher taxa that include truffle or secotioid taxa and normal text are non-truffles. Mycorrhizal status (Myc) is either ectomycorrhizal (ECM), putatively ectomycorrhizal (ECM?), other functional modes (N), unknown functional modes (?) or arbuscular mycorrhizal (AM; Tedersoo et al. 2010, Tedersoo and Smith 2013). These values are applied to the genera as a whole and/or species listed under a genus, unless otherwise xvii.
(21) specified. Fungal taxon names indicated by an asterisk* are only in the fungal specialist’s, Northern Bettong’s (Bettongia tropica) diet. Mammal species names are as follows; Bt is Bettongia tropica, Ar is Aepyprymnus rufescens, Im is Isoodon macrourus, Iop is Isoodon obesulus peninsulae, Pn is Perameles nasuta, Ts is Thylogale stigmatica and Uc is Uromys caudimaculatus. ............................................................ 131 Table A.2: Fungal species consumed by mammal species in Northern New South Wales on the Gibraltar Range. Refer to Table A.1 for annotation. Mammal names are as follows; Pt is Potorous tridactylus, As is Antechinus stuartii, Mp is Macropus parma, Mc is Melomys cervinipes, Pn is Perameles nasuta, Pno is Pseudomys novaehollandiae, Rf is Rattus fuscipes, Tt is Thylogale thetis, Tc is Trichosurus caninus and Wb is Wallabia bicolor. .......................................................................................................... 132 Table A.3: Fungal species consumed by mammal species in South Eastern NSW near the Victorian border. Refer to Table A.1 for annotation. Fungal species indicated by an asterisk* are only in the fungal specialist’s, Potorous spp., diets. Mammal names are as follows; Pl is Potorous longipes, Pt is Potorous tridactylus, Io is Isoodon obesulus, Pn is Perameles nasuta, Pf is Pseudomys fumeus, Rf is Rattus fuscipes, Tc is Trichosurus caninus and Wb is Wallabia bicolor. ........................................................................... 133 Table B.1: Mean ± SE OTU richness per sample (total OTU number in parentheses), mean ± SE depth (sequence read copy) per sample (total in parentheses) and number of samples (n) per mammal species for each site and season (Late dry = Nov-Dec, Early wet = Feb-Mar, Late wet = May-Jun) for all OTUs. Generalists are all non-bettong samples combined. ....................................................................................................... 136 Table C.1: Truffle taxa from Abell-Davis (2008) that formed part of the local database of ITS2 sequences. ....................................................................................................... 141 Table D.1: Studies of Australian ectomycorrhizal fungi (ECM) that sampled both truffle and non-truffle taxa. Method of identification (S = Sanger sequencing, HTS = high throughput sequencing, M = morphological, RFLP = restriction fragment length polymorphism), number of replicates or sampling effort (n), dominant taxa by abundancea or diversityd, total ectomycorrhizal diversity (ECM, Sp = sporocarps only), diversity of ectomycorrhizal truffles (T) and percent of truffle diversity (%). Taxa in boldface are truffles and underlined are secotioid or higher taxa that include truffle or secotioid taxa. ............................................................................................................... 144 xviii.
(22) Table E.1: Relative abundance (as percentage) of ectomycorrhizal taxa from sequencing (Chapter Three and Chapter Four) within Bettongia tropica scat samples (Sp), generalist mammalian scat samples (G), root samples (R) and soil samples (S). Acc: Accession number for OTU; E: e-value, ID: percentage similarity with sequence from database, Cov: percentage coverage with sequence from database, SL: sequence length. Taxa in boldface are truffles and underlined are secotioid or higher taxa that include truffle or secotioid taxa. ................................................................................... 147. xix.
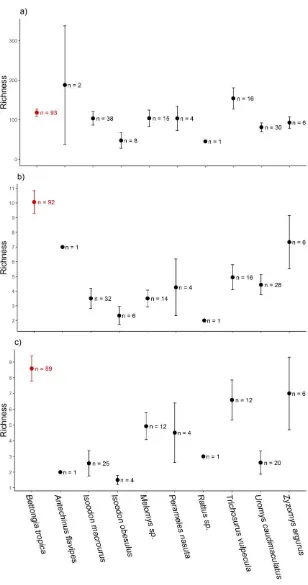
(23) List of Figures Figure 2.1: Abundance, frequency, diversity and abundance across seasons for fungal diets of different mammal families. a) Mean (± SE) percentage abundance of fungi relative to other food stuffs within diets of three mammal families, b) mean ± SE percentage abundance of fungi within diets of three mammal families across seasons, c) mean ± SE percentage frequency of fungi across samples within mammal family diets, d) mean ± SE number of fungal species within the diets of four mammal families. Different letters represent significant differences across mammal families or across mammal families within season (P <0.05). Number in parentheses are the number of mammal species represented. Families are as follows: pygmy possums are Burramyidae, carnivorous marsupials are Dasyuridae, wallabies and pademelons are Macropodidae, rats and mice are Muridae, bandicoots are Peramelidae, possums are Phalangeridae and rat-kangaroos are Potoridae. Rat-kangaroos include fungal specialists (*). .................................................................................................................................. 29 Figure 2.2: Number of references versus the number of fungal species recorded in each mammal species diet. Different colours represent different mammal families as per the associated legend. Lines represent linear models per mammal family ± SE. Generalist mammal species with diverse fungal diets (on par with specialists) are labelled: Rattus fuscipes (bush rats), Wallabia bicolor (swamp wallabies) and Perameles nasuta (longnosed bandicoots). .......................................................................................................... 32 Figure 2.3: Number of cumulative observations versus number of fungal species recorded in each mammal species diet. Different colours represent different mammal families as per the associated legend. Lines represent linear models per mammal family ± SE. Generalist mammal species with diverse fungal diets (on par with specialists) are labelled: Rattus fuscipes (bush rats), Wallabia bicolor (swamp wallabies) and Perameles nasuta (long-nosed bandicoots).................................................................... 32 Figure 3.1: Rarefied accumulation curve for a) all OTUs and b) ectomycorrhizal (ECM) OTUs. Black lines are all scat samples (a: n = 213, b: n = 200), blue lines are Bettongia tropica samples (a: n = 93, b: n = 92), red lines are samples from nine generalist mammal species combined (a: n = 120, b: n = 108), green lines are Isoodon macrourus samples (a: n = 38, b: n = 32) and pink lines are Uromys caudimaculatus samples (a: n = 30, b: n = 28). Thin lines are 95% confidence intervals. ...................... 49 xx.
(24) Figure 3.2: Mean ± SE OTU richness per sample for a) all OTUs, b) ectomycorrhizal OTUs and c) truffle OTUs for each mammal species. Bettongia tropica is the fungal specialist (points in red); all other species have generalist diets. ................................... 53 Figure 3.3: Relative abundance of ectomycorrhizal OTUs, for fruiting habits other than truffle (orange), uncertain fruiting habit (green) or truffles (blue), within a mammal species’ scats. Numbers below mammal species names are total OTU richness for fruiting habits other than truffle (orange), uncertain fruiting habit (green) or truffles (blue) (n = number of replicates), respectively. Black are OTUs that have an abundance too low to display. Bettongia tropica (northern bettong) is a fungal specialist within the family Potoroidae. ........................................................................................................... 54 Figure 3.4: OTU richness per sample versus sequence depth per sample in natural loglog-scale for a) all OTUs, b) ectomycorrhizal OTUs, and c) truffle OTUs across mammal families (colours), seasons (shapes) and sites (linear lines). See Table 3.3 for ANCOVA outputs. Mammal families for all OTU data are represented by Bettongia tropica, n = 93 for Potoroidae; Melomys sp., n = 15, Rattus sp., n = 1, Uromys caudimaculatus, n = 30, Zyzomys argurus, n = 6 for Muridae; and Isoodon macrourus, n = 38, I. obesulus, n = 8, Perameles nasuta, n = 4 for Peramelidae. ............................... 59 Figure 3.5: Venn diagrams comparing numbers of unique and shared OTUs from a fungal specialist (Bettongia tropica) and all fungal generalist mammal species’ samples for a) all OTUs, b) ectomycorrhizal OTUs, and c) truffle OTUs. .................................. 60 Figure 3.6: Ordination plots for the whole OTU dataset with Hellinger-transformed data on a) Multidimensional scaling with no data constraints; b) Redundancy analyses with interactions between mammal species (specialist vs generalists), site and season (RDA; fungal community ~ site*season*mammal species, 18.1% variation explained); c) Partial-RDA where variation of site and season are partitioned out (2.4% variation) and only mammal species examined (2.6% variation) (fungal community ~ mammal species + condition (site, season)). Fungal communities are significantly different between specialist and generalist scats (F1, 209 = 5.611, P = 0.001, c: partial-RDA). Red: specialist samples (Bettongia tropica), blue: samples from all generalists combined, diamonds: early wet season samples, triangles: late dry season samples, squares: late wet season samples. ........................................................................................................ 62. xxi.
(25) Figure 3.7: Ordination plot grouped by mammal family for the whole OTU dataset with Hellinger-transformed data for a partial-RDA where variation of site and season are partitioned out (2.45% variation) and only mammal species examined (6.36% variation) (fungal community ~ mammal species + condition (site, season)). Mammal families are represented by Bettongia tropica, n = 93 for Potoroidae; Melomys sp., n = 15, Uromys caudimaculatus, n = 30, Zyzomys argurus, n = 6 for Muridae; Isoodon macrourus, n = 38, I. obesulus, n = 8 for Peramelidae; and Trichosurus vulpecula, n = 16 for Phalangeridae. Mammal species had significantly different fungal communities in their scats (F6, 197 = 2.298, P = 0.001). .................................................................................... 63 Figure 4.1: Rarefied accumulation curve for a) all OTUs and b) ectomycorrhizal (ECM) OTUs. Blue lines are soil samples (n = 36), red lines are root samples (n = 36), black lines are soil and root data combined (n = 72) and green lines are scat samples (n = 61). Thin lines represent 95% confidence intervals. ................................................... 75 Figure 4.2: Relative diversity of mycorrhizal families in different samples (soil, roots and scats). Only taxa representing greater than 1% of the total OTU-richness are shown for clarity. ....................................................................................................................... 76 Figure 4.3: Relative abundance of mycorrhizal families in different samples (soil, roots and scats) split by mycorrhizal type (AM = arbuscular mycorrhizal) and fruiting habit (n = fruiting habit other than truffle, n/y = unknown fruiting habit, y = truffle). Black are OTUs with a relative abundance to show....................................................................... 79 Figure 4.4: Venn diagrams where the size of a circle represents the relative OTU diversity of each sample type (soil, roots or scats) within each subsample of data (ectomycorrhizal = ECM, arbuscular mycorrhizal = AM, truffles and all OTUs). Overlapping areas represent the proportion of OTUs shared between sample types, whereas the non-overlapping areas represent OTUs unique to specified substrate. The total number of OTUs is 9358, 428 for AM fungi, 344 for ECM fungi and 116 for truffle fungi. Specialist scats are from fungal specialist Bettongia tropica, and generalist scats are from Isoodon macrourus, I. obesulus, Melomys sp., Trichosurus vulpecula (ECM only) and Zyzomys argurus. Note: For AM fungi, scats and roots shared 1.8% of taxa and scats and soil shared 0.8% of taxa and this is not shown because there were no taxa shared by all samples. ............................................................................................. 87. xxii.
(26) Figure 4.5: Venn diagrams where the size of a circle represents the relative OTU diversity of each sample type (soil, roots or scats) within each family of fungi (Hysterangiaceae [26 OTUs], Mesophelliaceae [59 OTUs] and Tuberaceae [15 OTUs] contain only truffle species; Cortinariaceae [128 OTUs], Russulaceae [159 OTUs] and Inocybaceae [132 OTUs] contain truffle and/or secotioid species as well as mushroom species). Overlapping areas represent the proportion of OTUs shared between sample types, whereas the non-overlapping areas represent OTUs unique specific substrate. .. 88. xxiii.
(27) List of Publications Accepted manuscripts Thesis Chapter Two Nuske, S. J., K. Vernes, T. W. May, A. W. Claridge, B. C. Congdon, A. Krockenberger, and S. E. Abell. 2017. Redundancy among mammalian fungal dispersers and the importance of declining specialists. Fungal Ecology. 27: 1-13. Nuske, S. J., K. Vernes, T. W. May, A. W. Claridge, B. C. Congdon, A. Krockenberger, and S. E. Abell. 2017. Data on the fungal species consumed by mammal species in Australia. Data in Brief. 12: 251-260. Manuscripts from thesis in preparation Thesis Chapter Three Nuske, S. J., S. Anslan, L. Tedersoo, B. C. Congdon, and S. E. Abell. The consequences of losing the northern bettong, a fungal specialist, for the dispersal of ectomycorrhizal fungi. Submitted to Molecular Ecology. Thesis Chapter Four Nuske, S. J., S. Anslan, L. Tedersoo, B. C. Congdon, and S. E. Abell. Dominant rootassociating ectomycorrhizal fungi are mammal dispersed. In preparation. Other publications in preparation Nuske, S. J., S. Anslan, L. Tedersoo, B. C. Congdon, and S. E. Abell. Seasonal diet of a fungal specialist; a molecular perspective. In preparation. Nuske, S. J., S. Anslan, L. Tedersoo, B. C. Congdon, J. Kanowski, and S. E. Abell. Thinning and fire effects on soil fungal communities. In preparation.. xxiv.
(28) Chapter One: Introduction 1.1 Functional redundancy Ecosystems exist due to a myriad of interacting organisms. The type, quality and quantity of interactions between organisms influence the biology and ecology of their populations. How reliant a given population of an organism is on these interactions depends on the functional redundancy of the system (Brodie et al. 2014). For example, some plant species require the aid of animals to disperse their seeds. If the seed of a certain plant species is dispersed by many animal species, then the system is said to have more functional redundancy; i.e. the extinction of one animal species in the ecosystem would not affect the dispersal of its seeds. However, if a plant species is only dispersed by one or two animal species, then this system is less functionally redundant because the extinction of one or both animal species would disrupt the dispersal of the plant. Understanding redundancy within an ecosystem for a given function can help elucidate when and why species are at risk due to the extinction of other organisms ('secondary extinction'; Brodie et al. 2014). Specialist organisms often perform unique roles in ecosystems, as their special requirements allow them to interact with other organisms in unique ways. Losing specialist organisms may or may not result in other species extinctions, depending on the redundancy of the system (Aizen et al. 2012, Colwell et al. 2012). Therefore, understanding the functional redundancy in ecosystems is a high priority when allocating resources for conservation. In this thesis, I examine the functional redundancy among the dispersal roles of mammals for important plantsymbiotic mycorrhizal fungi, including threatened mammals with specialist fungal diets.. 1.
(29) 1.2 The interactions Mycorrhizal fungi are a diverse range of soil fungi that interact with a diverse range of plant species (Brundrett 2009). These fungi grow in and around plant roots, where they supply nutrients to the plants in exchange for carbon. This interaction is demonstrably beneficial for both partners (Hoeksema et al. 2010); plants exhibit increased growth and survival and mycorrhizal fungi receive carbon (e.g. carbohydrates) from the plant. Mycorrhizal fungi are therefore critical for ecosystem nutrient cycling (Hawkins et al. 2015, van der Heijden et al. 2015), plant health (Scott et al. 2012), and are an important component of many forest systems globally (Tedersoo et al. 2010, 2014). Many species of mycorrhizal fungi form hypogeous sequestrate fruit-bodies (truffles) (Bougher and Lebel 2001, Trappe et al. 2009), most of which are ectomycorrhizal (ECM), although some are arbuscular mycorrhizal (AM) or saprotrophic (Tedersoo et al. 2010, Tedersoo and Smith 2013). Truffles do not have an active spore-dispersal mechanism (cf. winddispersed mushroom species) and rely on animals for dispersal via consumption and deposition of spores in scats or from spores carried on body surfaces. Among the animals recorded to consume and disperse truffle mycorrhizal fungi, mammals are the most prevalent and widely studied (e.g. Maser et al. 1978, Claridge and May 1994, Schickmann et al. 2012), although many other animals consume mycorrhizal fungi. There are a few records of reptiles and birds consuming soil fungi (Simpson 1996, 2000, Medway 2000, Jones et al. 2007, Cooper and Vernes 2011). However, truffle sporocarps of mycorrhizal taxa have rarely been observed as directly consumed by these animals. An exception is the ectomycorrhizal desert truffle Picoa lefebvfei (=Phaeangium lefebvrei) eaten by migratory birds (Alsheikh and Trappe 1983).. 2.
(30) Invertebrates are also known to consume spores of mycorrhizal fungi (e.g. springtails: Collembola, beetles: Coleoptera and earthworms: Annelida) (Fogel and Peck 1975, Reddell and Spain 1991, Houston and Bougher 2010, Anslan et al. 2016), although whether this also contributes to dispersal depends on spore survival and animal movement. For some invertebrate species, few spores remain intact after gut passage (therefore, most are not viable for germination). For example, after passage through Collembola guts, the proportion of intact spores can be very low (<1-10%) (Nakamori and Suzuki 2005, 2010) and only 4% of truffle spores observed from beetle faeces appeared intact (Houston and Bougher 2010). Experimental evidence for mycophagous invertebrates to influence mycorrhizal colonisation shows either positive (Reddell and Spain 1991, Klironomos and Moutoglis 1999), negative (Pattinson et al. 1997) or neutral (Gormsen et al. 2004) directions, and this does not always seem to be associated with dispersal of propagules. Nevertheless, invertebrates have been shown to be dispersal vectors for other fungal taxa, for instance plant pathogens or saprotrophic fungi (Renker et al. 2005, Chen et al. 2014, Drenkhan et al. 2017). Springtails and earthworms often only move short distances during foraging (centimetres to a few metres) and their short gut-retention times (<2 h) also mean that spores have less potential to move far from their origin (Nakamori and Suzuki 2010, Chauvat et al. 2014, Cameron and Bayne 2015). Mycophagous mammals, on the other hand, have much longer gut retention times (>20 h) (Danks 2012) and mammals can move from tens to hundreds of metres (Vernes and Haydon 2001, Pizzuto et al. 2007, Marchesan and Carthew 2008, Bentley 2008) or several kilometres (Morrant and Petit 2012, O’Malley 2012) during that time. Additionally, many studies have shown that mycorrhizal spores remain viable through the passage of mammalian guts (e.g. Lamont et al. 1985, Claridge et al. 1992, Reddell et al. 1997, Colgan and Claridge 2002, 3.
(31) Caldwell et al. 2005, Ashkannejhad and Horton 2006, Livne-Luzon et al. 2016). Mammals, therefore have a high probability to disperse intact, viable spores far from their origin. Consequently, current data shows that mammals are the main animals that influence the dispersal dynamics of mycorrhizal truffle taxa. Many mammal species perform this dispersal role for truffle fungi (Maser et al. 1978, Claridge and May 1994). These interactions lead to the hypothesis that the productivity and diversity of plants is linked to mammals, via their mycorrhizal associations (Maser et al. 1978, Malajczuk et al. 1987, Johnson 1996, Vernes 2007). As a corollary, I hypothesise that for mammals to have an influence on both the mycorrhizal and plant communities, truffle taxa will need to form important components of mycorrhizal communities. For example, the higher the proportion of truffle taxa within the overall mycorrhizal community, either in terms of relative abundance or diversity, the higher the potential influence that mammalian spore dispersal has on the structuring of mycorrhizal and plant communities. There are important differences in AM versus ECM fungi in ecology, distribution and diversity of truffle fungi. These differences are likely to impact the potential for mammals to influence mycorrhizal communities and, in turn, for their host plants. Even though AM fungi have a lower global diversity than other fungi, they associate with much of the global plant diversity and occur in almost every ecosystem where there are plants. At least two genera contain truffle-like sporocarps (Goto and Maia 2005); Glomus and Acaulospora. ECM associate with a smaller proportion of plant diversity (Brundrett 2009). However, ECM host plants can dominate forests in terms of biomass (for example, they associate with the majority of trees and shrubs in sclerophyll forest; Reddell et al. 1999) and ECM truffle diversity constitutes thousands of species (Bougher and Lebel 2001, Trappe et al. 2009). Therefore, truffles form a larger 4.
(32) contribution, in terms of species diversity, to ECM communities than to AM communities. Currently, we lack data on the influence of mammal mediated truffle dispersal for structuring of mycorrhizal communities and mycorrhizal/plant interactions. Differences in the rates of mycophagy by mammals can influence their contribution to the dispersal of fungi. Fungal specialists, mammals that rely on fungi as a food source, consume and disperse a high quantity of fungi and often a higher diversity compared to mycophagous mammals with generalist diets. For example, squirrel species (Glaucomys sabrinus, Spermophilus lateralis and Tamiasciurus douglasii) in California, USA, consume and disperse truffle species more frequently and at a higher diversity than other small mammals in the same community (Pyare and Longland 2001). Similarly, the bank vole (Myodes glareolus) consumes a higher quantity and diversity of ectomycorrhizal fungal spores compared to other small mammals in central Europe (Schickmann et al. 2012). This suggests that the functional redundancy of these ecosystems may be low for fungal dispersal roles. 1.3 What we don’t know In many other ecosystems where mycorrhizal truffle fungi are important, we don’t have enough data to make assessments about the functional redundancy of fungal dispersal roles. For instance, in Australia, there is much data on the fungal diets of fungal specialists within the mammalian family Potoroidae (Bennett and Baxter 1989, Taylor 1992, Johnson 1994a, Green et al. 1999, Vernes et al. 2001, Nguyen et al. 2005). However, within the same ecosystems, there is little comparable data on the fungal dispersal roles of mammals with generalist diets. There are only a few studies within Australia comparing fungal dispersal roles and they present conflicting results. Tory et al. (1997) found that the fungal diets of a fungal specialist, Potorous tridactylus (long5.
(33) nosed potoroo) and the generalist Rattus fuscipes (bush rat) had a similar composition and diversity in autumn and winter, indicating this system has some functional redundancy, at least seasonally. Whereas, the fungal specialist, Bettongia tropica (northern bettong) consumed a higher fungal abundance and diversity of fungal spores compared to other co-occurring mammal species (Reddell et al. 1997), indicating little functional redundancy. Studying the functional role of mammals in dispersing these important mycorrhizal fungi is particularly pertinent for Australia, as this continent has the highest rate of mammal extinction and decline globally (Short and Smith 1994). This includes declines in fungal specialists (Bettongia and Potorous spp.) within the family Potoroidae (Seebeck and Rose 1989, Laurance 1997, Short 1998, Wayne et al. 2016). Historically, Bettongia and Potorous spp. had a wide distribution over much of the Australian continent and now reside only in fragmented populations (Claridge et al. 2007, Woinarski et al. 2014). We do not know how functionally redundant these systems are to the loss of mammal diversity, or fungal specialists. Can mycophagous mammals with generalist diets compensate for some, or all, of the role performed by a fungal specialist? Additionally, there is little known about the structure of mycorrhizal communities, particularly in Australian ecosystems. This data is essential to testing the hypothesis that mammalian spore dispersal influences the structuring of mycorrhizal and plant communities. The overall aim of this thesis is to determine the functional redundancy among mammalian fungal dispersers and examine the potential for mammals to influence the structure of mycorrhizal communities. 1.4 Data chapters In Chapter Two of this thesis I address the question of functional redundancy in fungal dispersal by mammals by bringing together previously disjunct evidence from the 6.
(34) literature. Data on the fungal diets of mammals across Australia for variables including abundance, frequency, diversity and seasonality of fungi eaten was gathered. Using this data, I infer the relative importance of mammal groups to fungi dispersal and test the hypothesis that fungal specialists perform a disproportionate dispersal role compared to mammals with generalist diets. Chapter Three builds on Chapter Two; in a field study, the functional redundancy among fungal dispersal roles of an endangered fungal specialist is compared to the cooccurring generalist mammal community. This direct spatial and temporal comparison removes any bias associated with using previously published literature to assess levels of redundancy. In this chapter, modern DNA sequencing technology to quantify mammalian fungal diets was used; a novel feat for mycophagy studies that allows a comparison at a higher resolution of diversity in these communities. In Chapter Four I examine the mycorrhizal community structure from multiple sample types to assess the level of influence of mycophagous mammals. The mycorrhizal community and measured and compared from whole soil, plant-roots and mycophagous mammalian scats, using modern DNA sequencing technology. From these data, I infer the influence of mammals on mycorrhizal communities by quantifying the fruiting habits of the taxa and examining the overlap in mycorrhizal taxa between sample types. Overall, the data and results from my thesis provide a new insight into this essential interaction in woodland forests. I demonstrate that these three diverse groups of organisms (mammals, fungi and plants) are tightly inter-connected and that disruption to these networks via loss of specialist mammalian fungal dispersers may have already caused detrimental, yet undocumented, declines of truffle fungi. My results also suggest that continuing declines are likely to have further significant implications for. 7.
(35) ectomycorrhizal fungal communities, fungi-plant interactions and ecosystem functioning.. 8.
(36) Chapter Two: Redundancy among mammalian fungal dispersers and the importance of declining specialists.. The content of this chapter adapted from published papers in Fungal Ecology (27: 1-13) and Data in Brief (12: 251-260) co-authored by K. Vernes, T. W. May, A. W. Claridge, B. C. Congdon, A. Krockenberger and S. E. Abell.. The entire chapter was written by Susan Nuske, with co-authors providing intellectual guidance in the design and implementation of the research and editorial contributions. Data collection, data analyses and production of tables and figures were conducted by Susan Nuske.. 9.
(37) 2.1 Abstract Knowing the relative importance of different mammal species as dispersers helps us to understand how loss in mammal diversity could affect plant-fungi interactions and fungal species diversity. In this chapter, a meta-analysis of available data on the fungal diets of Australian mammal species was performed to infer the functional redundancy between fungal specialists and mammals with generalist diets. Despite detecting a sampling bias in the literature, the meta-analysis confirms that mammals with fungal specialist diets contribute disproportionally more to the potential dispersal of fungi than other mammals within Australia. Three mammal species with generalist diets also consumed fungi at comparable rates to fungal specialist species and, importantly, persist in many areas where fungal specialists are now absent. These results highlight the significance of mammals, particularly fungal specialists, for maintaining diverse ectomycorrhizal fungal communities.. 2.2 Introduction It is expected that mammals, as dispersers of spores of ectomycorrhizal fungi (ECM), are essential to the maintenance of fungal species diversity and ectomycorrhizal-host plant mutualisms and thus contribute to ecosystem functioning. For mammal species to positively affect fungal population diversity and gene flow via spore dispersal the spores need to both survive the mammalian gut and be deposited away from their point of origin. There are no published studies showing a reduction in ECM fungal spore viability associated with passage through mammalian guts. In contrast, several studies have successfully used scats from mycophagous mammals as ECM inoculum for bioassay seedlings (e.g. Lamont et al. 1985, Claridge et al. 1992, Reddell et al. 1997, Colgan and Claridge 2002, Caldwell et al. 2005, Ashkannejhad and Horton 2006, 10.
(38) Livne-Luzon et al. 2016). Consequently, current data suggest that ECM spores remain viable after passage through mammalian gut’s and that, in general, consumption leads to dispersal opportunities. The likelihood of spores dispersing away from their point of origin is an interaction between gut-retention time and movement of the animal. The average gut-retention time for mycophagous mammals is 26.9 h (95% confidence limits: 20-33.7 h), with maximum times up to 69 h (Danks 2012). Mammals can move from tens to hundreds of metres (Vernes and Haydon 2001, Pizzuto et al. 2007, Marchesan and Carthew 2008, Bentley 2008) or several kilometres (Morrant and Petit 2012, O’Malley 2012) during that time. Home range size in mammals is correlated with body size, with larger mammals generally having larger home range sizes (Tucker et al. 2014). However, there are exceptions. Highly mycophagous Bettongia gaimardi and B. tropica (Tasmanian bettong and northern bettong) in Australia have much larger home ranges than their body size would indicate (ca 60 ha for a 1-2 kg animal) (Taylor 1993, Vernes and Pope 2001). In contrast, Wallabia bicolor (swamp wallaby), a 10-20 kg animal has a smaller home range size (16-37 ha) (Troy and Coulson 1993, Di Stefano et al. 2011). It has been suggested that the large home range size of fungal specialists with the family Potoridae is related to their reliance on a fungal diet, as fungi are sparsely distributed but high quality food (Vernes and Pope 2001). Longer gut-retention times and larger home ranges increase the chance of long-distance dispersal of spores (Danks 2011, O’Malley 2012). Additionally, mammal species that consume higher amounts of fungi (in terms of quantity, frequency and diversity) are more likely to influence fungal communities via inoculum dispersal. Globally, a diverse range of mammals consume fungi and thus potentially contribute to their dispersal. However, not all contribute equally. Often a few mammal species within 11.
(39) a community are more reliant on fungi (fungal specialists) and many other mammals only consume fungi seasonally, or as a supplementary food source (hereafter, fungal generalists) (Maser et al. 1978, Vernes and Dunn 2009, Schickmann et al. 2012). Mammals that consume a higher quantity of fungi typically also consume a higher diversity of fungal species (Maser et al. 1978, Claridge and May 1994) and are likely to contribute disproportionally more to fungal dispersal and ecosystem health. The resilience of both fungal and plant communities to the loss of these fungal specialists and their fungal dispersal roles is unknown. In the wake of ecosystem disturbance and species extinctions, it is unclear if a diverse group of mammalian fungal generalists can compensate for the loss of a single fungal specialist with respect to the community of fungi they disperse, and to what degree mammal diversity is important to fungal species diversity (Vernes 2007). To answer these questions, knowledge of functional redundancy is required. Put simply, do fungal generalists collectively disperse the same fungal community as fungal specialists? Are all fungal generalists functionally redundant, or do some generalists disperse more fungi (in abundance or diversity) than the average mycophagous mammal? The answers to these questions may have consequences for forest management and ecosystem health (Wayne et al. 2016). Currently there are few studies that specifically address functional redundancy between specialist and generalist mammalian fungal dispersers. These studies suggest that systems have little functional redundancy. For instance, squirrel and vole species in North America and Central Europe consume higher abundance and diversity of mycorrhizal fungi than other mammals in the same communities (Pyare and Longland 2001, Schickmann et al. 2012). Other data on mycophagy is scattered throughout the literature and dietary studies on mammals often overlook fungi as an important dietary component (Vernes 2007), or use inappropriate methods to measure fungal abundance 12.
(40) in diets. Some authors even ignore and discard finer particles (Smith and Broome 1992, Evans and Jarman 1999) that potentially contain fungal spores and hyphae, resulting in an underestimation of fungal contribution to diets. In this meta-analysis, data on fungal diets of mammals are brought together to infer their potential functional role as fungal dispersers. To be able to undertake valid comparative analyses between published studies a selection criteria on dietary sampling methods was developed that reduced bias and the under-detection of dietary fungi. Data on Australian mammals was used because Australia has a high diversity of trufflelike fungi (Lebel and Castellano 1999, Bougher and Lebel 2001), and mycophagy has been studied over a wide range of Australian mammal species (Claridge & May 1994; Vernes 2010; O’Malley 2012; Vernes, Cooper & Green 2015). For example, in a previous review Claridge and May (1994) recorded 37 native Australian mammal species across eight families having fungi in their diet, and more species have been added to the list since then (e.g. Antechinus stuartii, mouse-sized insectivorous antechinus, and Isoodon macrourus, medium-sized, omnivorous northern brown bandicoots) (Reddell et al. 1997, McIlwee and Johnson 1998, Vernes and Dunn 2009). Australia has also suffered from the highest rate of mammal extinction and decline of any continent (Short and Smith 1994, Woinarski et al. 2015), including some important fungal specialists within the family Potoroidae (rat-kangaroos) (Claridge et al. 2007). These fungal specialists previously occupied large areas of Australia, but today are restricted to fragmented populations mainly in coastal regions (Short 1998, Woinarski et al. 2014). This makes understanding how the loss of fungal specialists affects fungal species diversity and fungal-plant interactions particularly pertinent for this continent. From a dietary perspective, six out of eight extant Australian Potoroid species are viewed as fungal specialists and I hypothesise that they perform a disproportionately 13.
(41) important role in fungal dispersal. Australian Potoroid mammals consume fungi as the majority of their diet (40-90%, depending on the season) (Scotts and Seebeck 1989, Taylor 1992, Claridge et al. 1993) and at a high diversity (cumulatively, 97 fungal taxa have been recorded in the diet of P. tridactylus; this study). The two notable exceptions from this family are Aepyprymnus rufescens (rufous bettong) and B. lesueur (burrowing bettong). Only about 23% or less of the diet of these two species is comprised of fungi; they rely mainly on other types of food (Wright and Hume 1984, McIlwee and Johnson 1998, Robley et al. 2001, Bice and Moseby 2008). Specifically, in this meta-analysis the available information on mycophagy in mammals within Australia was examined in terms of the abundance, frequency, seasonality and diversity of fungi consumed. From these data, I infer the relative importance of mammals as fungal dispersers and test the hypothesis that in Australia, Potoroid mammals (members of Potoroidae and fungal specialists) contribute disproportionally more to the consumption of fungi than generalist mycophagous mammal species. I also examine whether there is likely to be functional redundancy among generalist mycophagous mammals in their fungal dispersal roles.. 2.3 Materials and methods 2.3.1 Literature search Searches were made for quantitative data on the occurrence of fungi within dietary studies of Australian mammal species. The following data were collected: the fungal taxa within each mammal species’ diet, the abundance of fungi relative to other foodstuffs, the frequency of fungi across samples or individuals, and the abundance and frequency of fungi consumed across seasons. 14.
(42) The original location reported in each study was used as the lowest grouping variable within the dataset. To standardise the data and later compare potential dispersal events from populations of different mammal species that might overlap, data from locations were further pooled and averaged across sites if they occurred within 100 km of a random central point. To locate dietary studies the following keywords were used alone, or in combination, to search Web of Science and Google Scholar databases: mycophagy, fungi, diet, mammal, Australia. Additionally, Australian mammal species names were searched combined with the word “diet”. Unpublished theses were surveyed as well as relevant books. Methods within each study were examined for the inclusion criteria (see below) and added to the dataset if fungi were present. All references within an earlier review by Claridge and May (1994) were re-examined, except for 1 unpublished study (N. Baczocha) and 1 reference that could not be obtained (Stimson 1987). Taxonomic names of Australian mammals followed Van Dyck et al. (2013) except for I. obesulus peninsulae which was considered separate from I. obesulus (southern brown bandicoot), as the populations that were studied are disparate (Keiper and Johnson 2004), and with the addition of Pseudomys pilligaensis (Pilliga mouse) (Tokushima et al. 2008). All bats were excluded (but see, O’Malley 2012). 2.3.2 Developing inclusion criteria Fungal spores of the taxa most frequently encountered in diets (Basidiomycota and Ascomycota) are generally considerably smaller than most other dietary items (<20 µm). Consequently, authors may overlook such small particles in dietary analyses where particles are only examined at low magnification under a dissecting microscope. This is particularly likely for large-bodied mammals and predators, but may even occur 15.
(43) in small-bodied species, as for example with members of the genus Antechinus (mousesized insectivorous marsupials), where a lack of detection of fungal spores in dietary analysis (Allison et al. 2006) appears to be rectified when samples are examined at higher magnifications (Reddell et al. 1997, Vernes and Dunn 2009, O’Malley 2012, Vernes et al. 2015). Some authors ignore finer particles altogether (Evans and Jarman 1999), or sieve fine particles away without collecting and examining them (Smith and Broome 1992). This can also lead to underestimates of both the quantity and type of fungi eaten. For example Watts (1977) reported no fungi in the diet of R. fuscipes, contrasting with more methodologically appropriate studies reporting high levels of mycophagy for this species (Tory et al. 1997, Vernes and Dunn 2009, Vernes et al. 2015). Nevertheless, clumps of fungal hyphae may be visible at lower magnifications and are unlikely to pass through sieves. Therefore, it may still be possible to estimate the fungal portion of the diet even if fine particles are not examined (Scott et al. 1999). For the purposes of the meta-analysis three methodological properties were considered important for being able to detect and/or estimate the abundance of fungi within mammalian diets: (1) examination of the ‘fine fraction’ or ‘filtrate’, if sieving techniques were used, (2) the smallest sieve size, and (3) the highest magnification. Out of the dietary studies examined in which the fine fraction was collected and inspected, the lowest magnification used that still reported fungi was 10x (Newell 2009). In those where the fine fraction was not inspected but fungi were still reported, the largest sieve size was 0.3 mm2 and lowest magnification was 20x (Braithwaite and Griffiths 1996). Consequently, to reduce the likelihood of underestimating the abundance, frequency and seasonality of fungi within a specific mammal species diet, I excluded studies that used a minimum sieve size above 0.2 mm2 and/or examined material at less than 40x magnification. 16.
(44) There were some studies that met the above criteria but did not mention fungi in their species diets (i.e. producing ‘zero’ data). These studies were not included in the dataset because I could not distinguish true absence from false negatives. For instance, even though fungi have been found to be a consistent part of the diet of W. bicolor (Claridge et al. 2001, Vernes 2010, Danks 2011, O’Malley 2012), some modern papers ignore fungi altogether (Green et al. 2014) (a possible false negative). Indeed, many other mammal species may not be included in the mycophagy data; for example, studies of Petrogale spp. (rock wallabies’) diets met the above criteria but did not record fungi (Short 1989, Horsup and Marsh 1992), even though at least seven taxa of fungi were found in Pe. penicillata (brush-tailed rock-wallaby) scats in northern NSW (Vernes 2010). With these limitations in mind, the number of mammal species shown to consume fungi found by my literature search is considered to be conservative. To identify fungal spores, specific techniques and expertise are needed. Spore characteristics can only be distinguished using at least 100x magnification (for Ascomycota and Basidiomycota). Even between comparable samples, fungal spore diversity may differ due to extraction methods (Gordon and Comport 1998). I used the following criteria to include studies within the diversity dataset: fine fraction material must have been examined (no sieving), samples must have been examined at 100x magnification or greater, and spores must have been identified by use of mycological literature and/or a mycological expert. 2.3.3 Compiling datasets A list of fungal taxa consumed by different Australian mammal species was compiled. Each fungal taxon was listed to the nearest taxonomic level. If the author had questionmarked or grouped fungal taxa (e.g. morpho-species), the next highest taxonomic level. 17.
Figure


+7


Related documents
