1
Development of a model for calculating the solar ultraviolet
1
Protection Factor of small to medium sized built shade structures
23
Alfio V. Parisi1,*, Abdurazaq Amar1,Nathan J. Downs1,2, Damien P. Igoe1, Simone L. 4
Harrison2,1,3 and Joanna Turner1 5
6
1Faculty of Health, Engineering and Sciences, University of Southern Queensland, Toowoomba, 7
Australia. 8
9
2Skin Cancer Research Unit, College of Public Health, Medical and Veterinary Sciences, James 10
Cook University, Townsville, Australia. 11
12
3College of Medicine and Dentistry, James Cook University, Townsville, Australia. 13
14
*To whom correspondence is to be addressed. Email: [email protected].
15
Ph:+61 7 46312226 16
2
Abstract
22 23
A method was proposed for calculating the ultraviolet protection factor (PF) of small to medium 24
built shade structures. The method takes into account the amount of sky view visible from under 25
the structure, the transmittance of the roof material, the relative amount of diffuse ultraviolet 26
radiation (UV), the measurement position under the structure and the albedo of the relevant 27
surfaces. The PF of four different shade structure designs was measured 90 cm above ground-level 28
at the centre of the widest diameter of each structure. Measurements were only made on cloud-29
free days. Three structures had a thin metal roof and the fourth had shade-cloth. The proportion of 30
sky view ranged from 4.6% to 15.4% for these structures. The influence of position was 31
investigated for one structure, with the PF evaluated 50 cm in from each of the sides at 90 cm 32
above ground-level. The reliability of the method was tested by comparing calculated and 33
measured PF values for solar zenith angles ranging from 7o to 49o. The mean absolute difference 34
between the calculated and the measured PF for these small to medium structures was 1.4 PF 35
(14%). The proposed method is more likely to be widely used to measure the PF in situ compared 36
to measuring UV in full sun and in the shade with a UV meter because many stakeholders do not 37
have access to UV meters due to the cost or the degree of specialization required to use these 38
meters effectively. 39
40
3 1. Introduction
42 43
Excessive sun-exposure is the main environmental risk-factor for skin cancer; the most prevalent 44
form of cancer in Caucasian populations. The risk of skin cancer can be minimized, with the World 45
Health Organisation (WHO) stating that four out of five skin cancers are preventable [1]. Skin 46
cancer poses a significant economic burden globally [2]. For instance in 2017, 13,941 cases of 47
melanoma were diagnosed in Australia (average lifetime cost 44,796 AUD per case in 2010; [2, 48
3]), with the cost of keratinocyte cancers in 2012 estimated to be 703 AUD million and over 70 49
million for melanoma [4]. In the USA, 91,270 melanoma cases are expected in 2018 [5], with the 50
cost of skin cancer treatments in the USA based on 2004 data being an estimated two billion dollars 51
per year and solar keratoses adding a further $1.2 billion [6]. 52
The primary prevention of skin cancer through reduced exposure to ultraviolet radiation (UV) will 53
reduce the global burden of disease [7], associated health care expenditure [8] and the societal 54
burden it poses. One essential component of a strategy to reduce UV exposure that is promoted by 55
Cancer Council, Australia and WHO is the use of shade while outdoors [1, 9]. Previous research 56
has reported that adequate protection is provided by those shade structures with an UV protection 57
factor of 15 or more [10]. 58
59
To assist the general public to determine whether a shade structure provides adequate UV 60
protection, the UV protection factor (PF) of built shade structures which assesses the ratio of 61
available incident solar radiation to the solar radiation with a shade structure in place, should be 62
made available for public scrutiny. The Australian Standard AS 4174:2018 for knitted and woven 63
shade fabrics only provides a method for determining in the laboratory the UV transmittance and 64
4 structures such as shade sails. The Standard determines the attenuation of direct UV for new, dry, 66
non-stretched materials, whereas the UV protection provided by shade-cloth roofing materials in
67
situ is also influenced by the amount of stretch, and age of the roof material. The protection factor 68
measured in the laboratory is significantly different to the protection factor provided by a shade 69
structure once erected in a local environment due to the additional contribution of the diffuse UV 70
component. Previous research has shown that the UV transmittance of the material used on the 71
roof of structures purposefully built for the provision of shade is a poor indication of the actual PF 72
of the built shade structure due to the other influencing factors such as surroundings, the position 73
under the structure, roof materials and the amount of sky view from underneath the structure [11, 74
12]. A design of a shade structure using louvers that takes into account the angle of the sun to 75
shade from the direct (shadow causing) UV radiation has been reported [13]. It is well established 76
that both the direct and diffuse components of solar UV radiation contribute to human UV 77
exposure [14] and the exposure due to the diffuse UV needs to be taken into account. Shade 78
structures that only provide protection from direct solar UV alone, but do not block sufficient 79
amounts of sky allowing exposure to diffuse solar UV radiation under the shade canopy, can have 80
poor PF ratings [15]. Previous research has reported on the determination of the Sky View Factor 81
(SVF) from Google Street View for larger scale urban settings [16-19]. The method presented here 82
takes into account the SVF or sky view visible from under the structure, the UV transmittance of 83
the roof material which may be rated in accordance with the Ultraviolet Effectiveness 84
Classification (Australian Standard AS 4174:2018) [20], the relative amount of diffuse UV, the 85
measurement position under the structure and the albedo of the relevant surfaces beneath the 86
structure. 87
5 Some of the approaches used to evaluate the protection provided by shade structures previously 89
have included shade audits [21-23], using software to map existing or proposed shade [24] and 90
physical measurements of the PF of different types of shade [25-31]. Additionally, there are 91
existing recommendations for shade provision [32-34]. 92
93
Shade is a practical form of passive sun-protection that is particularly beneficial in schools since 94
children and adolescents often resist wearing hats [35]. School students often seek shade during 95
scheduled meal breaks to provide respite from the heat [36]. Similarly, in urban environments 96
shading has been reported to provide thermal comfort [37-39]. Numerous people can utilize shade 97
structures simultaneously and since these structures can be constructed with quality, durable 98
materials to protect against weathering and everyday use, shade provision can be a cost-effective, 99
enduring option for the school environment, complimenting existing strategies for minimizing UV 100
exposure. Shade is particularly beneficial during lesson breaks and scheduled outdoor classes, such 101
as physical education lessons, since these can coincide with peak UV exposure periods. The 102
importance of shade provision as a sun-protection strategy is reflected in the distribution of shade 103
grants to schools and non-profit organisations [40, 41]. 104
105
Previous research [42] and a recent article by Choice [43] have reported on problems associated 106
with not having a suitable means of communicating the PF of built shade structures to the public. 107
For example, an opaque roof constructed from roofing material with a UV transmission of zero 108
may offer inadequate UV protection (i.e. a PF of ~1.5 to 3) once the shade structure is erected [44, 109
45]. Others have reported on the inadequacy of UV protection provided by built structures at 110
6 environment [30]. Utrillas et al., [46] proposed a method to measure the in situ PF of a shade 112
umbrella, however there is currently no agreed means of determining the PF of the many and 113
varied forms of shade structures both in Australia and abroad without a UV detector. This research 114
reports on the development and validation of an accessible new tool for determining the in situ PF 115
of small to medium sized built free-standing shade structures and provides useful insights for shade 116
builders and consumers. 117
118
2. Methodology 119
120
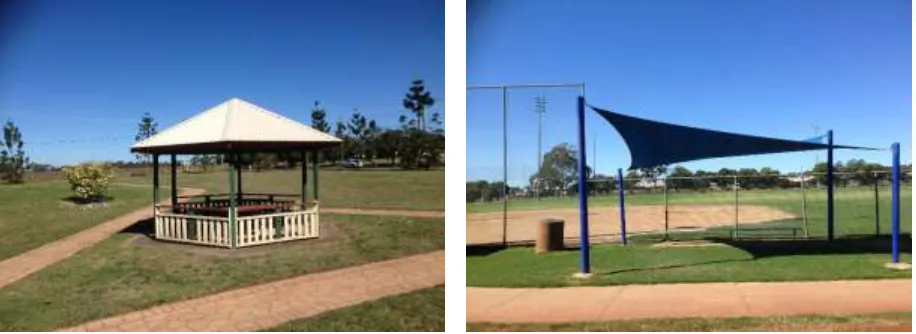
A series of four free-standing built shade structures comprised of a small, a medium and a large 121
structure all with solid thin metal roofs and a fourth structure with a shade-cloth roof (Figure 1) 122
were used to develop and validate the proposed PF model. These four structures were selected 123
because they are representative of the built shade structures currently found in parks managed by 124
local government authorities in Australia. They were selected to provide typical examples of a 125
range of different sized structures (small, medium and large) with a solid roof, as well as a typical 126
free-standing shade-cloth structure. No adjacent buildings were located in the immediate vicinity 127
of any of these built shade structures. All four free-standing built shade structures were located in 128
the regional city of Toowoomba (27.6° S, 151.9° E) in Queensland, Australia. The physical 129
dimensions of these structures are provided in Table 1. 130
131
Previous research has shown that the measured PF of a tree canopy was influenced by the presence 132
of more than 50% cloud cover [47]. As this may be the case for shade structures, measurements 133
supporting the development and validation of the PF were undertaken on cloud-free days to 134
minimize the potential influence of cloud cover. 135
7 The proposed method is based on the proportion of sky view visible from beneath the structure, 137
the UV transmittance of the roof material, the relative proportion of available diffuse erythemal 138
UV and the albedo of the relevant surfaces beneath the structure. To calculate the proportion of 139
the sky view and the proportion of the sky covered by the roofing material of each of the structures, 140
wide-angle images were taken on a cloud-free day from a point in the centre of the structure, at 90 141
cm above ground-level, at approximately noon, and also between mid-morning and noon. Image 142
analysis was used to calculate the proportion of sky view and the proportion of the sky covered by 143
the roof for each structure. Additionally, as the PF can be influenced by the solar zenith angle 144
(SZA) [48], the PF model was evaluated for a range of SZAs from 7o to 49o [49]. Data on the 145
proportion of the sky view and the proportion of the sky covered by the roof of each structure were 146
entered into a model designed to calculate the erythemal UV beneath built shade structures. The 147
PF was then determined as described in Section 2.2. 148
8 150
Figure 1 - The four structures investigated included: (top left) a small structure, (top right) a large
151
shade structure, (bottom left), a medium shade structure (bottom left), all with thin metal roofs
152
except (bottom right), structure with shade-cloth roof.
153
154
155
Images were taken with a smartphone (Sony Xperia Z1, Sony Corporation, Tokyo, Japan) fitted 156
with a fish eye lens (Oldshark, Fisheye 235 degrees lens, supplier: MiniInTheBox.com). Any make 157
or model of smartphone would suffice. The phone was positioned on a horizontal plane 90 cm 158
above ground-level with the camera pointing upwards. This height was chosen as some structures 159
have a table at approximately 90 cm above the ground. The lens is supplied with a clip that makes 160
it relatively easy to attach over the camera of a smartphone. A shutter control connected by 161
Bluetooth (Bluetooth remote shutter, supplier: Kogan.com) was used to take the images to ensure 162
the user was not in the field of view. The image focus was set as the underside of the structure roof 163
directly above the smartphone camera (f/2.4) and the default settings for shutter speed (between 164
1/1,294 and 1/281 seconds) and ISO (32) were used. 165
9
2.1 Image Analysis
167
The images produced by the lens were larger than the camera sensor [50] resulting in 168
approximately one third of the sky view of the image not being recorded for images taken at 90 169
cm above the ground. As the missing portion of the image was near the perimeter of the image, 170
and generally included part of the sky view, it was necessary to calculate the complete amount of 171
sky view visible. Although this problem could be overcome by using an expensive DLSR camera 172
with an 8 mm fish eye lens, the cost would be prohibitive, making the proposed method for 173
determining the PF of built shade accessible to fewer people. Rather, we opted to resolve this using 174
relatively inexpensive and widely available tools. The smartphone fitted with the fish eye lens was 175
set to video mode and placed in the centre of a turntable mounted on a tripod. The smartphone 176
video camera was used to record the underside of each structure while the turntable was rotated 177
through 360 degrees. For each structure, four video frames depicting the roof at 90 degree intervals 178
were downloaded to a computer and photo-stitched together using free Image Composite Editor 179
10 181
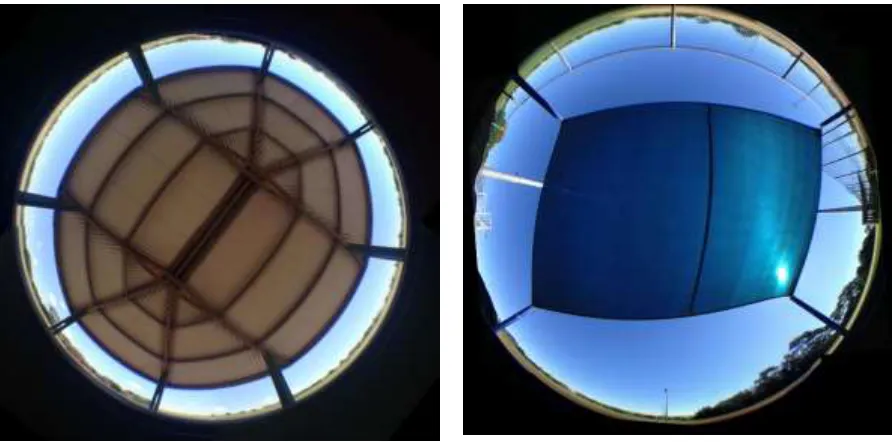
Figure 2 - Images taken 90 cm above ground-level with a smartphone fitted with a fish eye lens
182
then photo-stitched to provide a complete image from beneath the structure for the (top left) small
183
shade structure, (top right) medium shade structure, (bottom left), large shade structure and
184
(bottom right) shade-cloth structure.
185
186
The proportion of sky view visible within each image was determined using the freely-available 187
SVF Calculator software [52] which requires the royalty-free MATLAB Compiler Runtime [53] 188
to be installed on a personal computer. This enables novice users to run the model without 189
requiring a MATLAB license or programming skills. 190
191
The SVF Calculator segments the image into a series of annuli to calculate the SVF [54, 55]. After 192
loading a hemispherical image of a shade structure, users specify the radius by clicking three points 193
on the circumference. The software converts the image to black and white and automatically sets 194
a threshold to distinguish between sky and non-sky pixels (including the structure’s roof, supports, 195
11 non-sky pixels still incorrectly classified as sky, can be manually set to non-sky by selecting the 197
relevant part of the image. The software then calculates SVF as a number between 0 and 1 (i.e. 0-198
100%). 199
200
Table 1 – Physical characteristics of four built shade structures typical of those found in parks in 201
Toowoomba, Queensland (27.6° S, 151.9° E). 202
Height (maximum height) (m)
Dimensions Roof type (Transmittance) Roof material albedo (%) Ground cover Albedo¶ (%) Six sided small structure or gazebo
2.0 (2.7)* 3.5 m x 3.0 m Hexagon side length of 1.75 m
Metal (0%)
7.5 Pavers 9.2
Medium structure
2.05 (3.3)* 4.3 m x 3.7 m Hexagon, side length of 2.15 m
Metal (0%)
7.5 Concrete 9.2
Large structure
2.10 (2.85)*
5.75 m x 4.06 m Elongated octagonal shape
Metal (0%)
7.5 Concrete
with large wooden table 4.0 Shade-cloth structure
2.0# (3.2) 6.6 m x 4 m Shade-cloth (6%)
4.0 Grass 2.4
*Height measured at the edges and maximum height shown in brackets is the height at the apex. 203
204
# Height is the minimum height of the structure. 205
¶ The albedo expressed as a percentage is the albedo of the ground cover beneath the structure as 206
used in the model. 207
208
2.2 Protection Factor
209
The Protection Factor to a horizontal plane of a built structure is [11]: 210 211 Global Shade UVBE PF UVBE
(1)
12 where UVBEGlobal is the erythemally weighted UV irradiance [56] to a horizontal plane in full sun
213
and UVBEShade is the erythemally weighted UV irradiance to a horizontal plane beneath a shade
214
structure. 215
216
For the PF model developed in this research for shade structures, the UVBEShade was calculated
217
using a modification for shade structures based on an approach reported for the calculation of the 218
UVBEShade under tree canopies [57]:
219
220
𝑈𝑉𝐵𝐸𝑆ℎ𝑎𝑑𝑒 = (𝑈𝑉𝐷𝑖𝑓𝑓𝑢𝑠𝑒× 𝐹𝑆𝑘𝑦) + (𝑈𝑉𝐺𝑙𝑜𝑏𝑎𝑙 × 𝐹𝑅𝑜𝑜𝑓× 𝑇)
221
+ (𝑈𝑉𝐷𝑖𝑓𝑓𝑢𝑠𝑒× 𝐹𝑅𝑜𝑜𝑓× 𝛼𝐺𝑟𝑜𝑢𝑛𝑑(1
2+ 𝛼𝑅𝑜𝑜𝑓)) 222
(2) 223
where UVDiffuse is the diffuse horizontal plane erythemal UV, UVGlobal is the global horizontal plane
224
erythemal UV, FSky is the unobscured sky view fraction due to the shade structure for the particular
225
measurement position within the shade, FRoof is the sky view fraction obscured by the roof, T is the
226
transmittance of the shade structure roof material in the erythemal UV waveband, Ground is the
227
albedo of the ground beneath the structure and Roof is the albedo of the underside of the roof
228
material. The third term of this equation represents the diffuse UV scattered from the ground 229
surface under the structure and does not include the direct UV as that has been blocked by the roof 230
of the shade structure. In this term, the Roof term is to take into account the UV scattered from the
231
ground and then scattered by the roof to the receiving plane. The term with the factor of one half 232
is to take into account the UV scattered from the ground and then undergoes scattering by the air 233
molecules. One half is used on the assumption that half is scattered upwards and half is scattered 234
13 236
The albedo [58-61] of the various types of ground cover shown in Table 1 were used in these 237
calculations of UVBEShade, along with the albedo of the underside of the roof material as reported
238
in the literature [61] and as measured by the first author for the shade cloth structure The magnitude 239
of the albedo’s influence on the calculated PFis less than the influence due to the sky view. The 240
influence of albedo was investigated for the small structure by testing albedo values of 7% and 241
11% in Equations (1) and (2) and comparing the resulting PFs(10.2, and 8.8, respectively)to that 242
obtained with the 9.2% used in this model (PF 9.4). In both cases, calculated PF was within 1 PF 243
of that calculated using the 9.2% albedo. 244
245
The transmittance in the erythemal UV waveband of the roof material was zero for the structures 246
with the thin metal roof. For the shade-cloth roof, the erythemal UV transmittance employed was 247
6% where the supplier had provided this transmittance on their documentation for ten year old 248
shade sail material (http://www.sunsetcanvas.com.au/products/shade/shade-sails). 249
250
The model PRO6UV [62] was used to calculate the UVBEGlobal and the UVBEDiffuse horizontal plane
251
irradiances for cloud free days. The inputs to the model include latitude, longitude, elevation above 252
sea level, time of day, day of year, albedo, aerosol optical depth and total column ozone. Similar 253
models such as libRadtran [63] can be used. Calculated PF values were compared to values 254
determined by measurements of UVBEGlobal and UVBEShade with an erythemal UV meter (model
255
3D, Solar Light Co., PA, USA). UVBEShade was measured on a horizontal plane in the centre of
256
each shade structure from a position 90 cm above ground-level and equation (1) was used to 257
determine the PF. The method was validated by conducting a series of UVBEGlobal, and UVBEShade
14 measurements on cloud-free days for SZAs ranging from 9o (summer - 24th, 25th and 31st January 259
2017; 15th and 16th January 2018) to 49o (late autumn – 3rd, 11th, 16th and 29th May 2017). 260
261
2.3 Influence of Position Under Structure
262
The proposed model was used to determine the influence position beneath the structure had on in
263
situ PF using PF determined from a central position beneath the small structure and 50 cm in from 264
each of the six sides of the hexagonal structure on a cloud free day at approximately noon for an 265
SZA of 16o. Sky view fractions were measured for the north, north-east, east, south, south-266
west and north-western sides of the hexagonal structure. These data were also used to validate the 267
model by comparing the calculated PF with the measured PF of the built shade structure. 268
269
3. Results and Discussion 270
3.1 Image Analysis
271
A photo-stitched image was generated for each shade structure using the images taken under each 272
structure at a height 90 cm above ground-level using the smartphone fitted with the fish eye lens 273
(Figure 2). The advantage of the proposed method is that smartphones are widely available and a 274
fish eye lens similar to that used in this research is relatively inexpensive at less than 25 AUD. The 275
amount of the sky view obstructed by each structure’s roof and supports are visible in each image, 276
together with any trees in the vicinity. The shade structure with the shade-cloth roof depicts a 277
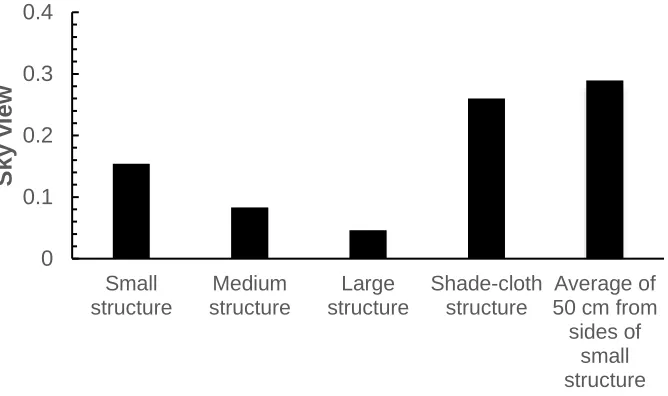
bright spot on the roof due to the partial transmission of direct sunlight. The proportion of SVF 278
visible for each of the structures has been provided in (Figure 3), with the SVF ranging from 0.26 279
(26%) for the shade-cloth structure to 0.15 (15%) for the small structure to 0.05 (5%) for the large 280
15 282
Figure 3 – Measured sky view beneath the centre of each of the four shade-structures at a height
283
90 cm above ground-level. The last column depicts sky view measured 50 cm in from the outer
284
edge of the roof, averaged for the six sides of the small hexagon structure.
285
286
The average SVFs determined 50 cm in from each of the six sides of the small structure and 90 287
cm above ground-level was 0.289 (28.9%). SVFs determined 50 cm from the edge of the structure 288
are almost double those obtained at the centre of the structure, demonstrating how the SVF of a 289
structure varies with position under the structure. Our proposed technique enables PF to be 290
determined at different positions under the structure. 291
292
3.2 Protection Factor
293
A comparison of the measured and the calculated irradiances for the global and the diffuse 294
erythemal UV and the measured and calculated PFs for the three small to medium structures 295
determined on cloud free days are provided in Figure 4. The resulting 1:1 lines are drawn in the 296
figure for comparison. PFs are likely to be lower on cloudy days due to the increased relative 297
amount of diffuse UV. PFs varied from approximately 5 for the small structure to 15 for the 298
medium structure for the SZA at the time of the PF calculation. For the sides of the small structure, 299
0 0.1 0.2 0.3 0.4
Small structure
Medium structure
Large structure
Shade-cloth structure
Average of 50 cm from sides of
small structure
S
k
y
v
ie
16 SVFs determined 50 cm from the edge of the small structure ranged from 0.23 to 0.38, compared 300
to 0.11 for the same structure measured in the centre. The resulting PFs for the same structure 301
evaluated on a cloud free day were lower at the edge (ranged from 5 to 8) than at the centre (9 to 302
11), illustrating how the PF of a shade structure changes according to the measurement position 303
beneath the structure. 304
305
This research was not designed to compare the PFs of different shade structures, but rather to 306
develop and propose an accessible method by which PF could be calculated, given that the PF 307
changes with SZA and position within the structure. The mean absolute error (MAE) or mean 308
absolute difference between calculated and measured erythemal UV irradiances was 0.02 W/m2 309
(13%). The MAE between the calculated and measured PFs was 1.4 (14%) for small to medium-310
sized shade structures. When the calculated PFs of 27 and 32 for the large shade structure are 311
included (Figure 4: depicted by two unfilled circles) the MAE increases to 1.7 (16%) because the 312
difference between PFs is greater for the large structure. This is likely to be due to the sky view 313
for the large structure being comprised of the portion of the sky lower toward the horizon, where 314
the diffuse UV may not be isotropic [64]. Consequently, the proposed method is suitable for small 315
to medium-sized shade structures with a SVF of at least 8%. 316
317
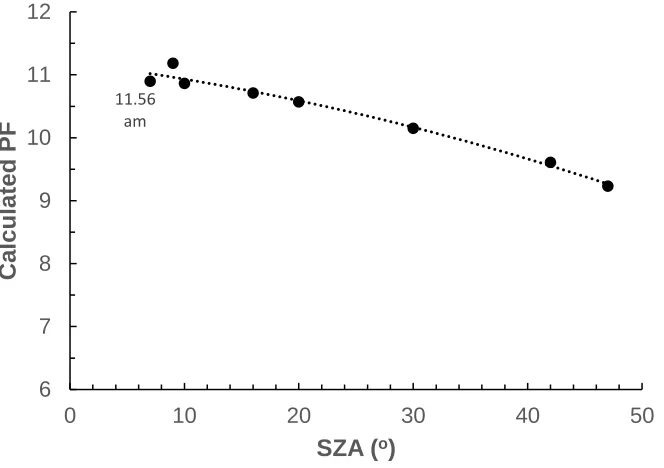
As the PF of a structure is a function of SZA (affecting the shade pattern), the PFs were also 318
evaluated at the centre of the small and medium structures on a cloud free day at approximately 319
noon and also between approximately 10 am to noon. The PF at noon represent the maximum PF 320
for each structure for that season. The PF for the small structure decreased from approximately 321
17 of time and with the seasons. For the small and medium-sized structures, the calculated PF from 323
mid-morning to noon demonstrates that the proposed method can be used at times other than noon, 324
when the relative proportion of diffuse to direct UV is higher. Additionally, the PF for a given 325
structure can be calculated in different seasons as the proportion of diffuse UV changes with the 326
SZA. 327
328
329 330
331
332
0.0 0.2 0.4 0.6
0.0 0.2 0.4 0.6
C
alcul
ated
E
ry
the
mal
U
V
(
W/
m
2)
Measured Erythemal UV (W/m2)
1:1 line
Global UV
Diffuse UV
1:1 line
0 10 20 30 40
0 10 20 30 40
Cal
c
ula
ted
P
F
Measured PF
18
Figure 4 – Comparison of the calculated and measured global UV and diffuse erythemal UV
333
irradiances (top graph) and comparison of the calculated Protection Factor (PF) versus measured
334
PF (bottom graph), along with the 1:1 lines.
335
[image:18.612.88.420.170.404.2]336
Figure 5 – The calculated PF at the centre of and 90 cm above the ground of the small structure
337
at the different solar zenith angles (SZAs). The smallest SZA for this data is close to noon in
338
summer and is shown as 11.56 am.
339
340
4. Conclusion 341
The proposed method has been tested in the field on four shade structures demonstrating its utility 342
for calculating the PF of built small to medium-sized shade structures with a SVF greater than 0.08 343
(8%). The proposed method was developed for determining PF at 90 cm above ground-level in the 344
centre of different shade structure designs with SVF ranging from 4.6% to 15.4%. Three of the 345
structures had a thin metal roof and the fourth had shade-cloth. The SVF, albedo of the relevant 346
surfaces, SZA (influences relative proportion of diffuse UV), measurement position beneath the 347
11.56 am
6 7 8 9 10 11 12
0 10 20 30 40 50
Cal
c
ula
ted
P
F
19 structure, and the UV-transmittance of the roof material (influenced by the age, stretch and 348
weathering of the material) were taken into account. The proposed method was validated by 349
comparing calculated and measured PFs across SZAs ranging from 7o to 49o. The MAE between 350
calculated and measured PF for small and medium structures was 1.4 (14%), increasing to 1.7 351
(16%) if the large structure was included. Given the larger difference in calculated and measured 352
PFs obtained for the large structure, the proposed method is only recommended for small to 353
medium shade structures with a SVF of at least 8%. 354
355
Further research is required to confirm that the method works irrespective of time of year, time of 356
day and the type of shade structure. Future testing of this method will determine its reliability 357
under different albedos, SZA, temporal and seasonal conditions as well as for a broad range of 358
shade structure sizes and designs with roofing materials exhibiting different UV-transmittance 359
characteristics, both with and without side protection (positioned at different compass directions). 360
Comparing PFs for different types of built structures will require measurement position beneath 361
the structure, height above ground-level and SZA to be standardized. 362
363
The proposed method should inform the shade structure design process, resulting in newly 364
constructed shade structures in public and community settings offering higher PFs than previous 365
designs. It will enable the amount of UV protection provided by built shade structures in schools, 366
early childhood settings and other public settings to be more readily determined by non-scientists 367
with access to any smartphone device and some relatively inexpensive and widely-available tools. 368
This research makes the determination of the PF of built shade simpler for both shade builders and 369
20 the UV meter required and the skills required to use one. Shade builders who use our easy to 371
follow approach are likely to become better informed about the relative merits of various shade 372
structure designs and the factors that influence their effectiveness, while government, sporting, 373
school and community organisations who use our model will become more discerning and 374
informed purchasers of built shade. . The proposed method could be used to provide an assurance 375
of quality of shade that planned structures are expected to provide. Further automation of the 376
method (e.g. developing a smartphone app) would make using the proposed method even easier 377
and would likely facilitate its wide-spread adoption. Funders of shade could positively influence 378
the shade industry in this direction by making it mandatory for shade builders quoting on shade 379
provision to provide some assurance/guarantee of shade quality in terms of anticipated PF. If 380
applicants seeking funding for additional shade were also expected to measure the PF of their 381
existing shade structures using this method, it would also inform the distribution of limited shade 382
funding to those who provide the highest PF. It is apparent from these applications alone that the 383
proposed method has the potential to vastly improve communication about the quality of shade of 384
planned structures and may form the basis of a quality assurance framework for the shade creation 385
industry. Consequently, this research has the potential to influence the development of improved 386
industry standards for shade creation. 387
388
Funding: This research did not receive any specific grant from funding agencies in the public,
389
commercial, or not-for-profit sectors.
390
391
392
21 References
395
[1] World Health Organisation, 2017, Ultraviolet radiation and the INTERSUN programme,
396
http://www.who.int/uv/sun_protection/en/(accessed June 2017). 397
[2] Doran, C.M., Ling, R., Byrnes, J., Crane, M., Searles, A/. Perez, D. & Shakeshaft, A. 2015,
398
“Estimating the economic costs of skin cancer in New South Wales, Australia,” BMC Public
399
Health, 15:952, doi.org/10.1186/s12889-015-2267-3 400
[3] Australian Institute of Health and Welfare, 2017. Summary pages for selected cancers 2017,
401
http://www.aihw.gov.au/cancer/cancer-in-australia-2017/summary-pages-for-selected-402
cancers/#t17 (accessed August 2017). 403
[4] Fransen, M., Karahalios, A., Sharma, N., English, D.R., Giles, G.G. & Sinclair, R.D., 2012,
404
“Nonmelanoma skin cancer in Australia,” Medical Journal Australia, vol.197, pp.565–568. 405
[5] American Cancer Society, 2018, Cancer facts and figures 2018,
406
https://www.cancer.org/research/cancer-facts-statistics/all-cancer-facts-figures/, (accessed 407
June, 2018). 408
[6] Neidecker, M.V., Davis-Ajami, M.L., Balkrishnan, R. & Feldman, S.R. 2009,
409
“Pharmacoeconomic considerations in treating actinic keratosis,” Pharmacoeconomics, 410
vol.27, pp.451–64. 411
[7] Whiteman, D. 2014, Inquiry into skin cancer in Australia, Submission to Parliamentary 412
Inquiry, 413
http://www.aph.gov.au/Parliamentary_Business/Committees/House/Health/Skin_Cancer/Sub
414
missions (accessed June 2017). 415
[8] SunSmart®, 2017, Skin cancer facts and stats,
http://www.sunsmart.com.au/about/skin-cancer-416
facts-stats (accessed June 2017) 417
[9] SunSmart®, 2017, UV and sun protection, http://www.sunsmart.com.au/sun_protection
418
(accessed June 2017). 419
[10] Parsons, P., Neale, R., Wolski, P. & Green, A. 1998, “The shady side of solar protection,”
420
Medical Journal of Australia, vol.168, pp.327-330. 421
[11] Gies, P., Makin, J., Dobbinson, S., Javorniczky, J., Henderson, S., Guilfoyle, R. & Lock, J.
422
2013, “Shade provision for toddlers at swimming pools in Melbourne,” Photochemistry and
423
Photobiology, vol.89, pp.968-973. 424
[12] Boyers, L.N., Karimkhani, C., Gamble, R. & Dellavalle, R.P. 2014, “Novel and promising sun
425
safety interventions: UV photography and shade structures,” OA Dermatology, Mar 09, 426
vol.2(1), pp.1-6. 427
[13] Horner, M., Rhode-Barbarigos, L. & Adriaenssens, S, 2014, “Site-specific louvered shells for
428
shading harmful ultraviolet radiation,” Building and Environment, vol.78, pp.14-22. 429
[14] Diffey, B.L. 1980, “Ultraviolet radiation physics and the skin,” Physics in Medicine and
430
Biology, vol.25, pp.405-426. 431
[15] Turnbull, D. & Parisi, A.V. 2005, “Increasing the ultraviolet protection provided by shade
432
structures,” J Photochem Photobiol B: Biol. vol. 78, pp.62-67. 433
[16] Gong, F., Zeng, Z, Zhang, F., Li, X., Ng, E. & Norford, L.K. 2018, “Mapping sky, tree, and
434
building view factors of street canyons in a high-density urban environment,” Building and
435
Environment, vol.134, pp.155-167. 436
[17] Middel, A., Lukasezyk, J., Maciejewski, R., Demuzere, M. & Roth, M. 2018, “Sky View
437
Factor footprints for urban climate modelling,” Urban Climate, vol.25, pp.120-134. 438
[18] Zeng, L., Lu, J., Li, W. & Li, Y. 2018, “A fast approach for large-scale Sky View Factor
439
22
[19] Li, X., Ratti, C. & Seiferling, I. 2018, “Quantifying the shade provision of street trees in urban
441
landscape: A case study in Boston, USA, using Google Street View,” Landscape and Urban
442
Planning, vol.169, pp.81-91. 443
[20] Australian Standard, AS 4174-2018, Knitted and woven shade fabrics,
https://www-saiglobal-444
com.ezproxy.usq.edu.au/online/autologin.asp (accessed April 2018). 445
[21] SunSmart®, 2017, Shade audit, http://www.sunsmart.com.au/shade-audit/ (accessed May
446
2017). 447
[22] SunSafe Nova Scotia, 2006, Summer Sun Safety Program: How to Conduct a Shade Audit,
448
http://www.cancercare.ns.ca/site-cc/media/cancercare/Shade_Audit_Guide.doc (accessed 449
August 2017). 450
[23] Gage, R., O’Toole, C., Robinson, A., Reeder, A., Signal, L. & Mackay, C. 2018, “Wellington
451
Playgrounds Uncovered: An Examination of Solar Ultraviolet Radiation and Shade Protection 452
in New Zealand,” Photochemistry and Photobiology, vol.94, pp.357-361. 453
[24] WebShade, nd, WebShade, Balmain, Australia, http://www.webshade.com.au/index.html
454
(accessed May 2017). 455
[25] Moise, A.F. & Aynsley, R. 1999, “Ambient ultraviolet radiation levels in public shade
456
settings,” International Journal of Biometeorology, vol.43, pp.128-138. 457
[26] Downs, N, Parisi, A.V., Turner, J. & Turnbull, D. 2008, “Modelling ultraviolet exposures in a
458
school environment,” Photochemical and Photobiological Sciences, vol.7, pp.700-710. 459
[27] Moise, A.F., Buttner, P.G. & Harrison, S.L. 1999, “Sun exposure at school,” Photochemistry
460
and Photobiology, vol.70, pp.269-274. 461
[28] Turnbull, D.J. & Parisi, A.V. 2003, “Spectral UV in public shade settings,” Journal
462
Photochemistry and Photobiology B: Biology, vol.69, pp.13-19. 463
[29] Turnbull, D.J. & Parisi, A.V. 2004, “Annual variation of the angular distribution of the UV
464
beneath public shade structures,” Journal Photochemistry and Photobiology B: Biology,
465
vol.76, pp.41-47. 466
[30] Gies. P. & Mackay, C. 2004, “Measurements of the solar UVR protection provided by shade
467
structures in New Zealand primary schools,” Photochemistry and Photobiology, vol.80, 468
pp.334-339. 469
[31] Parisi, A.V., Eley, R., Downs, N. 2012, “Determination of the usage of shade structures via a
470
dosimetry technique,” Photochemistry and Photobiology, vol.88, pp.1012-1015. 471
[32] EPA (United States Environmental Protection Agency), 2017, Shade Planning for America's
472
Schools, http://www.epa.gov/sunsafety/shade-planning-americas-schools (accessed June 473
2017). 474
[33] Cancer Council NSW, 2013, Guidelines to Shade,
https://www.cancercouncil.com.au/wp-475
content/uploads/2011/04/Guidelines_to_shade_WEB2.pdf (accessed May 2017). 476
[34] SunSmart Victoria, 2015, Shade Guidelines,
477
https://www.sunsmart.com.au/downloads/resources/brochures/shade-guidelines.pdf (accessed 478
June 2017). 479
[35] Turner, D., Harrison, S.L., Buettner, P., Nowak, M. 2014, “Does being a “SunSmart School”
480
influence hat-wearing compliance? An ecological study of hat-wearing rates at Australian 481
primary schools in a region of high sun exposure,” Preventive Medicine, vol.60, pp.107-114. 482
[36] Dobbinson, S.J., White, V., Wakefield, M.A., Jamsen, K.M., White, V., Livingston, P.M.,
483
English, D.R. & Simpson, J.A. 2009, “Adolescents' use of purpose built shade in secondary 484
23
[37] Hwang, R., Lin. T. & Matzarakis, A. 2011, “Seasonal effects of urban street shading on
long-486
term outdoor thermal comfort,” Building and Environment, vol.46, pp.863-870. 487
[38] Makaremi, N., Salleh, E., Jaafar, M. Z. & GhaffarianHoseini, A. 2012, “Thermal comfort
488
conditions of shaded outdoor spaces in hot and humid climate of Malaysia,” Building and
489
Environment, vol.48, pp.7-14. 490
[39] Watanabe, S. & Ishii, J. 2016, “Effect of outdoor thermal environment on pedestrians’ behavior
491
selecting a shaded area in a humid subtropical region,” Building and Environment, vol.95, 492
pp.32-41. 493
[40] Cancer Council Qld, 2018, SunSmart shade initiative 2018,
https://cancerqld.org.au/cancer-494
prevention/programs-resources/sunsmart-shade-initiative-2018/ (accessed June 2018). 495
[41] American Academy of Dermatology, 2018, Shade Structure Grant Program,
496
http://www.aad.org/spot-skin-cancer/what-we-do/shade-structure-grant-program. (accessed 497
June, 2018). 498
[42] Parisi, A.V. & Turnbull, D.J. 2014, “Shade provision for UV minimisation: a review,”
499
Photochemistry and Photobiology, vol.90, pp.479-490. 500
[43] Choice, 2014, Shady claims on shade sails,
https://www.choice.com.au/outdoor/outdoor-501
entertaining/shade-cloths/articles/shade-cloth-investigation (accessed May 2017). 502
[44] Turnbull, D.J., Parisi, A.V. & Sabburg, J. 2003, “Scattered UV beneath public shade structures
503
during winter,” Photochemistry and Photobiology, vol.78, pp.180-183. 504
[45] Turnbull, D.J. & Parisi, A.V. 2006, “Effective shade structures,” Medical Journal of Australia,
505
vol.184, pp.13-15. 506
[46] Utrillas, M.P., Martinez-Lozano, J.A. & Nunez, M. 2010, “Ultraviolet radiation protection by
507
a beach umbrella,” Photochemistry and Photobiology, vol.86, pp.449-456. 508
[47] Grant, R.H. & Heisler, G.M. 2006, “Effect of cloud cover on UVB exposure under tree
509
canopies: Will climate change affect UVB exposure,” Photochemistry and Photobiology,
510
vol.82, pp.487-494. 511
[48] Parisi, A.V., Willey, A., Kimlin, M.G. & Wong, J.C.F. 1999, “Penetration of solar erythemal
512
UV radiation in the shade of two common Australian trees,” Health Physics, vol.76(6), pp.682-513
686. 514
[49] Geoscience Australia, 2015, “Compute Sun and Moon Azimuth & Elevation,”
515
http://www.ga.gov.au/geodesy/astro/smpos.jsp (accessed August, 2017). 516
[50] Parisi, A.V., Downs, N., Igoe, D. & Turner, J. 2016, “Characterisation of cloud cover with a
517
smartphone camera,” Instrumentation Science and Technology, vol.44, pp.23-34, 518
DOI:10.1080/10739149.2015.1055577. 519
[51] Microsoft, nd, Image Composite Editor, USA,
https://www.microsoft.com/en-520
us/research/product/computational-photography-applications/image-composite-editor/
521
(accessed June 2017). 522
[52] Lindberg, F. & Holmer, B. 2010, Sky View Factor Calculator User Manual Version 1.1,
523
University of Gothenburg, Sweden.
524
http://www.gu.se/digitalAssets/1337/1337400_skyviewfactorcalculator-user-manual.pdf
525
(accessed January 2017). 526
[53] MathWorks®, 2017, MATLAB Compiler, Massachusetts, USA.
527
https://au.mathworks.com/products/compiler/mcr.html (accessed May 2017). 528
[54] Steyn, D.G. 1980, “The calculation of view factors from fisheye-lens photographs: Research
529
24
[55] Johnson, G.T. & Watson, I.D. 1984, “The determination of view-factors in urban canyons,”
531
Journal Climate and Applied Meteorology, vol.23, pp.329-335. 532
[56] CIE (International Commission on Illumination) 1998, Erythema reference action spectrum
533
and standard erythema dose,CIE S007E-1998, CIE Central Bureau, Vienna, Austria. 534
[57] Grant, R.H. 1997, “Biologically active radiation in the vicinity of a single tree,”
535
Photochemistry and Photobiology, vol.65, pp.974-982. 536
[58] Feister, U. & Grewe, R. 1995, “Spectral albedo measurements in the UV and visible region
537
over different types of surfaces,” Photochemistry and Photobiology, vol.62, no.4, pp.736-744. 538
[59] McKenzie, Kotkamp & Ireland 1996, “Upwelling UV spectral irradiances and surface albedo
539
measurements at Lauder, New Zealand”, Geophysical Research Letters, vol.23, pp.1761-1764. 540
[60] Diffey, B.L., Green, A.T., Loftus, M.J., Johnson, G.J. & Lee, P.S. 1995, “A portable instrument
541
for measuring ground reflectance in the ultraviolet,” Photochemistry and Photobiology, vol.61, 542
no.1, pp.68-70. 543
[61] Turner, J. & Parisi, A.V. 2018, “Ultraviolet radiation albedo and reflectance in review: The
544
influence to ultraviolet exposure in occupational settings,” International Journal of
545
Environmental Research and Public Health, vol.15, 1507, doi:10.3390/ijerph15071507 546
[62] Deo, R, D., Downs, N., Parisi, A,V., Adamwoski, J.F. & Quilty, J.M. 2017, “Very short-term
547
reactive forecasting of the solar ultraviolet index using an extreme learning machine integrated 548
with the solar zenith angle,” Environmental Research, vol.155, pp.141-166. 549
[63] Mayer, B. & Kylling, A. 2005, “The libRadtran software package for radiative transfer
550
calculations – description and examples of use,” Atmospheric Chemistry and Physics, vol.5, 551
pp.1855-1877. 552
[64] Grant, R.H., Heisler, G.M. & Gao, W. 1997, “Clear sky radiance distributions in ultraviolet
553
wavelength bands,” Theoretical and Applied Climatology, vol.56, pp.123-135. 554