95
RESEARCH PAPER
Behavior of concentrically loaded geopolymer-concrete circular columns
reinforced longitudinally and transversely with GFRP bars
(Title contains 14 words)
Running headline: Behavior of concentrically loaded geopolymer-concrete circular columns reinforced longitudinally and transversely with GFRP bars (128 characters)
by
G.B. Maranan1, A.C. Manalo1, B. Benmokrane2, W. Karunasena1, and P. Mendis3
1 Centre of Excellence in Engineered Fibre Composites (CEEFC), Faculty of Health, Engineering and Sciences (FoHES), University of Southern Queensland, Toowoomba 4350, Australia
2 Department of Civil Engineering, University de Sherbrooke, Sherbrooke, Quebec, Canada J1K 2R1
3 Department of Infrastructure Engineering, The University of Melbourne, Victoria 3010, Australia
Submitted to Engineering Structures
Corresponding Author: Allan Manalo
Senior Lecturer in Civil Engineering (Structural)
Centre of Excellence in Engineered Fibre Composites (CEEFC), Faculty of Health, Engineering and Sciences,
University of Southern Queensland, Toowoomba, Queensland 4350, Australia Tel: +61 7 4631 2547 Fax: +61 7 4631 2110
E-mail: allan.manalo@usq.edu.au
Manuscript summary:
Total pages 33 (including 1-page cover) Number of figures 16
96
Behaviour of concentrically loaded geopolymer-concrete circular columns
reinforced longitudinally and transverse with GFRP bars
G.B. Maranan1, A.C. Manalo1,*, B. Benmokrane2, W. Karunasena1, and P. Mendis3
1 Centre of Excellence in Engineered Fibre Composites (CEEFC), Faculty of Health, Engineering and Sciences
(FoHES), University of Southern Queensland, Toowoomba 4350, Australia
2 Department of Civil Engineering, University de Sherbrooke, Sherbrooke, Quebec, Canada J1K 2R1 3 Department of Infrastructure Engineering, The University of Melbourne, Victoria 3010, Australia
Email: ginghis.maranan@usq.edu.au; allan.manalo@usq.edu.au; Brahim.Benmokrane@USherbrooke.ca; karu.karunasena@usq.edu.au; pamendis@unimelb.edu.au
Abstract
97 Keywords: Geopolymer-concrete columns; glass-fiber-reinforced polymer (GFRP) bars; Short columns; Slender columns; Hoops; Spirals.
_________________________ *Corresponding author, tel. +61 7 4631 2547; fax. +61 7 4631 2110 E-mail addresses: allan.manalo@usq.edu.au (A. C. Manalo)
1. Introduction
98 [18-23] systems, and FRP-reinforced geopolymer concrete (FRP-RGC) [24, 25], relatively few studies are available that deal with the behavior of compression members comprised of these systems [26]. In fact, among the current design guidelines and codes of practice for FRP-RC systems, only the Japan Society of Civil Engineers (JSCE) has established a design procedure for FRP-RC columns [27]. The ACI 440.1R-06 [28] does not recommend the use of FRP bars in columns while the CSA S806-12 [29] ignores the compression contribution of FRP bars, owing to their low compression contribution. Moreover, design guidelines for S-RGC systems have yet to be established.
99 internal GFRP spirals and vertical reinforcement under axial compressive loading to failure. The test results indicated that these columns achieved 84% of the axial load capacity of the all-steel control column. Afifi et al. [39] and Mohamed et al. [40] investigated the axial capacity of circular columns reinforced with GFRP bars and ties. Their study indicated that concrete columns reinforced with GFRP and steel bars behaved similarly, although the axial capacities of the GFRP-RC columns were, on the average, 7.0% lower than their counterpart steel-RC columns. Moreover, the experimental findings showed that GFRP hoops and spirals enhanced the ductility and effectively confined the concrete core in the post-peak stages. In conclusion, the research work cited indicates the suitability of concrete columns longitudinally and transversely reinforced with GFRP bars.
Some researchers have investigated the applicability of geopolymer concrete for reinforced columns. Sumajouw et al. [41, 42] tested 12 slender fly-ash-based, geopolymer-concrete columns reinforced with steel bars. Their results showed that the column capacity increased when the longitudinal reinforcement and concrete compressive strength increased. Furthermore, they stated that the current design provisions for conventional concrete could be adopted for geopolymer concrete. Sarker [43] analyzed the behavior of geopolymer-concrete columns reinforced with steel bars. He recommended that the analytical method for conventional concrete columns could be used for geopolymer-concrete columns with the appropriate stress–strain relationship of geopolymer concrete. Sujatha et al. [44] tested a total of 12 slender geopolymer-concrete column specimens reinforced with M30 and M60 grade bars. The results showed that the geopolymer-concrete columns behaved similarly to OPC columns regardless of the concrete grade, with the geopolymer concrete yielding higher load and deflection capacities and more ductile behavior than OPC.
100 durable and more sustainable structural member with adequate strength and structural integrity. As of this writing, however, there have been only two studies that dealt with the bond behaviour of FRP bars in geopolymer concrete [45, 46], two research works about the structural behaviour of FRP-RGC beams [24, 25], and none about compression members. Thus, gaining an understanding of their structural performance is very important. This study investigated the compression behavior of geopolymer-concrete columns longitudinally and transversely reinforced with GFRP bars. The parameters considered were tie configuration (hoops and spirals), tie spacing, and slenderness ratio.
2. Experimental Program
2.1. Materials
2.1.1.Longitudinal and transverse reinforcement
101
ffu and elastic modulus Ef were calculated using the nominal cross-sectional area Ab. Currently,
there is no standard method for determining the compressive strength of FRP bars since it is complicated due to the occurrence of fiber micro-buckling. Nevertheless, this study utilized five 15.9 mm GFRP bars, with a length of 50 mm, that were cut as flat as possible and were subjected to axial loads. Based on the test, the average compressive strength of the GFRP bars was 612.5 MPa, which was 51.7% of the bars’ tensile strength. This strength ratio was comparable to that proposed by Deitz el. [31] (50%), but was higher than that stated by Kobayashi and Fujisaki [32] (30% to 40%) for GFRP bars. In addition, this study assumed that the GFRP bars’ elastic modulus in compression was similar to its elastic modulus in tension and that the tension and compression behaviour of GFRP bars was linearly elastic up to failure. These assumptions were also reported by the previous researchers.
2.1.2. Geopolymer concrete
A commercially produced geopolymer concrete with a proprietary mixture consisting of fine and medium sands, 10 and 20 mm coarse aggregates, plasticizer, water, and a geopolymer binder resulting from the alkali activation of two industrial waste materials – class F fly ash (FA) and ground granulated blast-furnace slag (BFS) – were used to fabricate the column specimens. All the geopolymer concrete cylinders and column specimens were cured in an ambient condition. Figure 3 shows the typical stress-strain curves of the geopolymer concrete with an average 28-day compressive strength f’c and modulus of elasticity Ec of 38 MPa and
102 chemicals are added [52]. The other mechanical properties of the geopolymer concrete were reported by Maranan et al. [24] and Aldred and Day [52].
Table 1
Mechanical properties of the reinforcement.
Bar ϕf, mm Ab, mm2 ffu,* MPa Ef, GPa εf, %
No. 3 9.5 71.3 1372 65.1 + 2.5 2.11
No. 5 15.9 197.9 1184 62.6 + 2.5 1.89
*Guaranteed tensile strength: average value – 3x standard deviation (ACI 440.3R-12 [48])
[image:8.595.200.400.220.365.2]
Fig. 1. 15.9 mm GFRP bars.
a. Circular hoops a. Spirals
Fig. 2. 9.5 mm GFRP ties.
Fig. 3. Typical stress-strain curve of the 100 mm diameter by 200 mm high geopolymer concrete cylinder.
0 10 20 30 40
0 2000 4000 6000
S
tre
ss
(M
Pa)
103
2.2. Test Specimens
Eight full-scale GFRP-RGC columns were cast and tested. One short column was fabricated without transverse reinforcement in the test region, which served as the control specimen. Three short columns reinforced with circular hoops uniformly spaced at 50, 100, and 200 mm on centers and two short columns reinforced with spirals spaced at 50 and 100 mm on centers were fabricated to investigate the influence of tie spacing and configuration. The specimen with spirals at 200 mm on centers was not considered in this study because this spacing caused the GFRP bars to buckle inward, yielding an almost hourglass-shaped reinforcement cage. In addition, two slender columns reinforced with circular hoops and spirals spaced at 100 mm on centers were produced to examine the slenderness effect. The short and slender columns had total heights (L) of 1.0 m and 2.0 m, respectively, yielding slenderness ratios (L/r) of 8 and 16, respectively. The L/r of 16 was practically equivalent to the slenderness limit of 17.2 suggested by Mirmiran [53], Mirmiran et al. [54], and Zadeh and Nanni [55] for GFRP-reinforced concrete columns. Figure 4 presents the specific details and configurations of the tested GFRP-RGC columns. All of the columns had a diameter of 250 mm and were reinforced with similar amounts of longitudinal reinforcement, consisting of six 15.9 mm GFRP bars, equivalent to 2.43% of the column’s gross cross-sectional area (Ag). The column height was divided into a
middle test region of 2L/3 and two end regions of L/6. The columns’ end regions were strengthened with ties spaced at 50 mm on centers to make sure that failure occurred in the test region. Figure 5 shows the actual configuration of the GFRP reinforcement cages. Figure 6, on the other hand, shows the wooden framework and the plastic-tube formwork with cast column specimens.
104 represents the type of transverse reinforcement: H for circular hoops and S for spirals. The ## sign represents the hoop center-to-center spacing or the spiral pitch in millimeters. For example, the specimen identified as GGC-8-H50 is a GFRP-reinforced geopolymer-concrete column with a L/r of 8 and transversely reinforced with 9.5 mm circular GFRP hoops spaced at 50 mm on centers. The specimen labelled as GGC-8-S50, on the other hand, is a GFRP-reinforced geopolymer-concrete column with a L/r of 8 and transversely reinforced with 9.5 mm GFRP spirals with a pitch of 50 mm on centers.
[image:10.595.88.506.268.488.2]
Fig. 4. Details and configuration of the column specimens.
[image:10.595.85.444.538.716.2]
105
[image:11.595.77.523.431.570.2]Fig. 6. Wooden framework and plastic formworks with cast column specimens.
Table 2
Specimen identification and test matrix.
Column D, mm Dc, mm ρf, % s, mm ρft, % L/r Type
GGC-8-00 250 200 2.43 - - 8 -
GGC-8-H50 250 200 2.43 50 3.13 8 Hoops
GGC-8-H100 250 200 2.43 100 1.57 8 Hoops
GGC-8-H200 250 200 2.43 200 0.78 8 Hoops
GGC-8-S50 250 200 2.43 50 3.13 8 Spirals
GGC-8-S100 250 200 2.43 100 1.57 8 Spirals
GGC-16-H100 250 200 2.43 100 1.57 16 Hoops
GGC-16-S100 250 200 2.43 100 1.57 16 Spirals
2.3. Test Program and Instrumentation
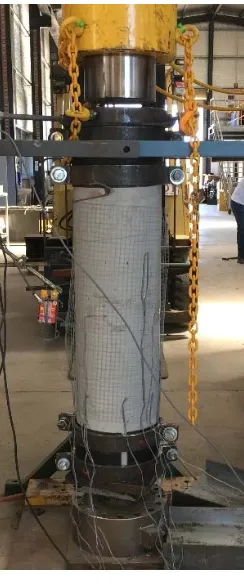
106 clamps and specimens, thereby ensuring that the end regions were properly confined. The top and bottom ends were smoothened and levelled evenly during the casting process and were provided with 3 mm thick neoprene rubber during testing to ensure uniform distribution of the applied load across the cross section. Furthermore, chicken wire was placed around the column specimens for safety purposes.
a. Schematic Diagram b. Actual
[image:12.595.105.311.206.503.2]Fig. 7. Test Set-up.
[image:12.595.379.501.208.500.2]107 loaded to failure in displacement control with a hydraulic jack to allow for the observation of both the pre- and post-peak behavior. The magnitude of the applied loads was measured with a 3000 kN capacity load cell, whereas the corresponding deformations were measured with a string pot. The strain, load, and deflection readings were recorded with a data logger attached to the machine, while the failure modes were documented with a video recorder.
3. Experimental Results
3.1. Load–Deformation Response
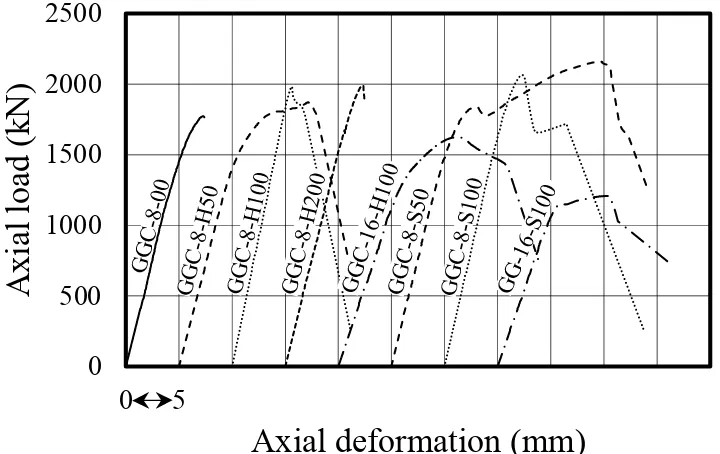
Figure 8 shows the relationships between the axial load and the deformation of the tested columns. The load–deformation of the unconfined short column (GGC-8-00) consisted only of a relatively linear ascending segment, with a stiffness of 301 kN/mm, up until the peak load level, denoted as Pg in this study. Pg represents the gross capacity of the geopolymer-concrete
column or the column’s capacity before concrete cover spalling. After exceeding Pg, the
column failed suddenly and did not show any post-peak behavior.
[image:13.595.116.476.467.694.2]
Fig. 8. Load-deformation response of the specimens.
0
500
1000
1500
2000
2500
0
5
10 15 20 25 30 35 40 45 50 55
Ax
ial load
(kN)
108 The load–deformation responses of GGC-8-H50, GGC-8-H100, GGC-8-S50, and 8-S100 can be divided into three phases. The first phase was comparable to that of GGC-8-00, a relatively linear load–deformation relationship with an average stiffness of 318 kN/mm. This can be expected since, at this stage, the columns’ behavior was governed predominantly by the geopolymer concrete’s compressive properties with little or no significant contribution from the GFRP ties. Furthermore, to activate the passive confinement of the GFRP ties, a higher magnitude of applied loads was needed due to the low elastic-modulus characteristics of these ties. Upon exceeding a load level approximately equivalent to GGC-8-00’s Pg,
micro-cracks were formed causing the lateral expansion of the geopolymer concrete that subsequently yielded vertical hairline cracks on the concrete surface. At this stage, the passive confinement of the lateral reinforcement was marginally activated. A short nonlinear segment with reduced slope occurred prior to Pg owing to simultaneous crushing and cracking of the geopolymer
concrete. Right after exceeding Pg, the concrete cover began to spall, producing a short
descending branch that represents the second phase response of the columns. These columns, except GGC-8-H200, continued to sustain additional loads owing to the still-intact concrete core confined by lateral ties as represented by ascending or descending lines, depending on the amount of transverse reinforcement. This behavior represents the third phase response. A second peak load Pc was recorded that corresponds to the maximum load capacity of the
confined concrete core. This load level also marks the initiation of geopolymer-concrete core crushing failure. The load-deformation response of GGC-8-H200, on the other hand, consisted only of two phases: a linear load-deformation response and a short descending branch.
109 of the column. These columns also showed more noticeable nonlinear behavior and stiffness degradation before reaching their Pg compared to their counterpart GGC-8 columns.
3.2. Failure Mode
Figures 8 shows the post-failure overview of the tested columns, while Figure 10 displays the specific failure of each material. As can be expected, the specimens failed by either crushing failure or buckling failure depending upon the slenderness ratio, suggesting the effectiveness of the design and construction procedure employed in the study. Right after reaching Pg,
GGC-8-00 failed suddenly through the simultaneous crushing of the geopolymer concrete and global buckling of the GFRP bars (Figure 10a). The columns failed in a brittle manner accompanied with an explosive sound. A well-formed cone on both ends (Figures 8a) characterized GGC-8-00’s post-failure configuration.
The failure of GGC-8-H200 commenced with the formation of vertical hairline cracks at an applied load approximately equivalent to GGC-8-00’s Pg. Since the columns had poor
confinement, the longitudinal bars started to deflect laterally that contributed further to the splitting of the geopolymer-concrete cover. Upon reaching its Pg, simultaneous crushing of the
geopolymer-concrete core and buckling of the longitudinal bars occurred. Concrete-cover spalling and concrete shearing outward along the inclined plane (Figure 9d) typified GGC-8-H200’s failure, with relatively more intact geopolymer-concrete core compared to GGC-8-00, owing to the presence of circular ties.
110 axial strains and Poisson’s effect increased, thereby increasing the geopolymer concrete’s lateral strain, which consequently induced the formation of vertical columnar hairline cracks on the concrete surface. These cracks progressively widened and increased in number prior to
Pg, as shown in Figure 9b. More but narrower cracks were formed with increasing amounts of
transverse reinforcement. After the concrete cover spalled, the geopolymer-concrete core underwent significant cracking, followed by the lateral expansion of the core, again, due to Poisson’s effect. The longitudinal GFRP bars, on the other hand, started to kink and to delaminate due to the closely spaced ties preventing the bar lateral movement (Figure 10c). These events were subsequently followed by GFRP-bar rupture, geopolymer-concrete core crushing, and lap-splice joint failure of the GFRP hoops (Figure 10c) or rupture of the GFRP spirals (Figure 10d), specifically at the intersection of the longitudinal and transverse reinforcement.
GGC-16-H50 (Figure 9g) and GGC-16-S50 (Figure 9f) underwent cracking and crushing mechanisms similar to that of their counterpart short columns before reaching ultimate failure. The failure of these columns, however, was governed by column buckling and not by the crushing or shear failure of the concrete, as shown by post-failure curvature/shape of the specimens.
[image:16.595.84.511.539.686.2]
111
a. GFRP bars’ global buckling
b. Vertical cracks formation and geopolymer concrete cover
spalling
c. GFRP bars’ kinking and delamination, geopolymer concrete core
crushing, and circular hoops’ lap splice joint failure
d. GFRP bars’ kinking and delamination, geopolymer concrete core crushing, and
spiral rupture
Fig. 10. Different failure mode configurations of the column specimens
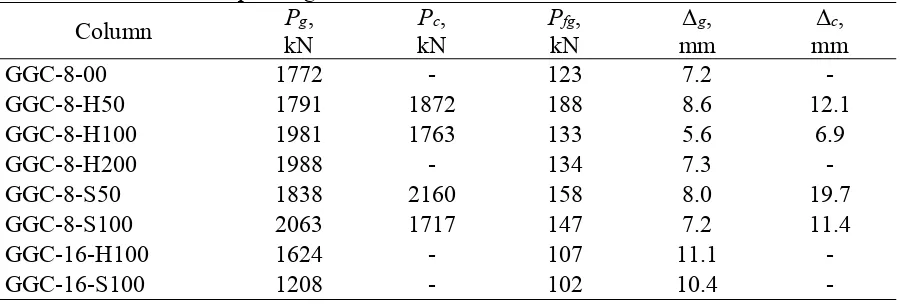
3.3. Strength and Deformation Capacity
Table 3 summarizes the gross concrete and concrete-core load capacities (Pg and Pc,
respectively) of the tested columns. The Pg of GGC-8-00 was 1772 kN. The geopolymer
concrete’s strength was calculated by subtracting the compression contribution of the GFRP bars from this load and then dividing the remaining load by the difference between the geopolymer concrete’s gross area and total bar area ((Pg-Pfg)/(Ag-Af)). The resulting strength
was equivalent to 34.42 MPa, which was approximately 90% of the average compressive strength of the standard geopolymer-concrete cylinders used in the study. Interestingly, this ratio was higher than the commonly used value of 85% for estimating the theoretical capacity of ordinary-concrete column sections, which tends to support Maranan et al.’s [24] conclusion that geopolymer concrete has better mechanical properties than ordinary portland-cement concrete of the same grade such as higher elastic modulus (leading to its better compatibility with GFRP bars compared to normal concrete), greater ultimate compressive strain (as much as 4800 με), and larger tensile strength. The use of lateral ties, however, increased the Pg of
GGC-8-00. GGC-8-H50, GGC-8-H100, and GGC-8-H200 yielded Pg values of 1791 kN, 1981
[image:17.595.90.509.69.257.2]112 by 4% and 16%, respectively. As mentioned earlier, this enhancement could be attributed to the activation of the lateral confining pressures of the circular hoops or spirals right after a load level approximately equivalent to GGC-8-00’s Pg had been achieved. The Pg of GGC-8-H50
and GGC-8-S50 were relatively low compared to the columns with lower volumetric ratios. Given that the Pg was mainly dependent on the geopolymer concrete, this result could be due
to the presence of closely spaced ties that caused discontinuity of the geopolymer concrete between the cover and core, making the column more susceptible to early concrete-cover spalling. Only GGC-8-H50, GGC-8-H100, GGC-8-S50, and GGC-8-S100, however, yielded
Pc of 1872 kN, 1763 kN, 2160 kN, and 1691 kN, respectively, which were 105%, 89%, 118%
and 82% of their respective Pg,. As can be expected, the well-confined columns (GGC-8-H50
and GGC-8-H100) yielded Pc that were higher than their Pg. The columns with spiral
reinforcement, in general, produced higher Pg and Pc compared to their counterpart
circular-tie-reinforced columns. GGC-16-H100 and GGC-16-S100, on the other hand, reached Pg of
1624 kN and 1208 kN, respectively, which were just 90% and 64%, respectively, of that of GGC-8-H100 and GGC-8-S100, respectively. This result could be expected since these columns failed due to buckling, a geometric type of failure, and not by compressive or shear failure.
Table 3 summarizes the GFRP bars’ compression contribution at Pg load level (Pfg),
which was determined by multiplying the measured average longitudinal bar strain (εfg) with
the total nominal area (Af) and elastic modulus (Ef) of the GFRP bars. Pfg represents the
maximum compression contribution of the GFRP bars since the bars yielded an almost plateau behavior right after reaching this load level. The control specimen GGC-8-00 yielded the lowest Pfg of 123 kN, while those with lateral ties obtained Pfg ranging from 133 KN to 188
113 closely spaced lateral ties (GGC-8-H50 and GGC-8-S50) produced higher Pfg/Pg than
GGC-8-00, with an average of 9.5%. The Pfg of GGC-16-H100 and GGC-16-S100 were 107 kN and
143 kN, respectively, which is generally lower than their counterpart GGC-8 columns. Nevertheless, it can be generalized from these results that the longitudinal GFRP bars made a notable compression contribution and that it could be enhanced through the provision of adequate lateral confinement. This generalization contradicts De Luca et al.’s [27] findings that the compression contribution of GFRP bars was less than 5% of column capacity. Hence, they concluded that the bar contribution could be ignored when evaluating the nominal capacity of an axially loaded square RC column. This could be related to the lower longitudinal reinforcement ratio (1.0%) they used and the better mechanical properties of the GFRP bars used in this study compared to the bars they used for their research work.
Table 3 also provides the axial deformation at Pg and Pc load levels (Δg and Δc,
respectively). Except for GGC-8-H100 (5.6 mm), all the transversely reinforced GGC-8 columns produced Δg values that were higher than that of GGC-8-00 (7.2 mm). GGC-8-H100
yielded a lower axial deformation than GGC-8-00 because the former column exhibited less severe cracking, prior to reaching its peak capacity, compared to the latter column, owing to the circular hoops that restrained the expansion of concrete core and delayed the formation of cracks. The Δg of the hoop-confined columns were in the following increasing order:
114 the reason why the axial deformation of 8-S50 (8.0 mm) was greater than that of GGC-8-S100 (7.2 mm). GGC-16-H100 and GGC-16-S100, on other hand, achieved Δg of 14.1 mm
and 12.9 mm, respectively, which are higher than that of GGC-8-H100 and GGC-8-S100, respectively. The Δc of GGC-8-H50 (12.1 mm), GGC-8-H100 (6.9 mm), GGC-8-S50 (19.7
mm), and GGC-8-S100 (11.4) were approximately 1.41, 1.23, 2.46, and 1.57 times that of their corresponding Δg, respectively. Obviously, the column with higher volumetric ratio or lower
tie spacing, irrespective of the tie configuration, demonstrated better deformability performance compared to those with lower volumetric ratios. Furthermore, the column with spiral reinforcement showed higher deformability compared to that with circular ties. The Δg
[image:20.595.75.525.402.554.2]of GGC-16-H100 (11.09 mm) and GGC-16-S100 (10.39 mm) were greater than their counterpart short columns.
Table 3
Peak loads and the corresponding deformations.
Column Pg,
kN
Pc,
kN
Pfg,
kN
Δg,
mm
Δc,
mm
GGC-8-00 1772 - 123 7.2 -
GGC-8-H50 1791 1872 188 8.6 12.1
GGC-8-H100 1981 1763 133 5.6 6.9
GGC-8-H200 1988 - 134 7.3 -
GGC-8-S50 1838 2160 158 8.0 19.7
GGC-8-S100 2063 1717 147 7.2 11.4
GGC-16-H100 1624 - 107 11.1 -
GGC-16-S100 1208 - 102 10.4 -
3.4. Geopolymer Concrete and GFRP Reinforcement Strains
Figure 11 shows the relationships between the axial load and the average axial strains in the geopolymer concrete. These strains were similar for all the tested columns up until an applied load approximately equivalent to 81% of GGC-8-00’s Pg. Table 4, on the other hand, shows
the maximum average strains in the geopolymer concrete at the Pg load level or the average
concrete strain when the cover began to spall (εcg). Right after reaching its Pg, GGC-8-00 failed
115 2183 με. These strain values were larger than GGC-8-00’s εcg, owing to the transverse
reinforcement that prevented the premature cracking within the specimen and prevented the early buckling of the GFRP bars. Interestingly, the average εcg of the tested short columns ε cg-ave, equivalent to 2032 με, was comparable to that of the normal concrete (2000 με) suggested
by Afifi [56] and Saatcioglu [57]. The εcg of GGC-16-H100 and GGC-16-S100 were 1266 με
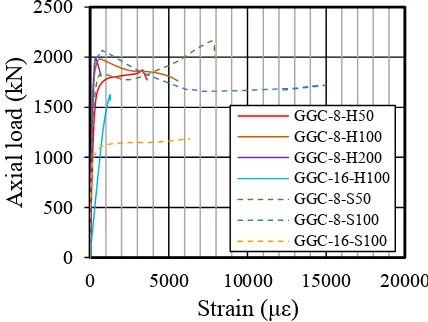
and 637 με, respectively, which is generally lower than their counterpart short columns. Figure 12 displays the relationships between the axial load and the axial compression strains in the longitudinal bars. As with the geopolymer concrete’s strains, at the same load levels, relatively comparable strain readings were obtained from all specimens up until 81% of GGC-8-00’s Pg. The figure clearly shows that the GFRP bars maintained their integrity and
load resistance until after the surrounding concrete was crushed and spalled off after the peak load. Table 4 summarizes the strains in the longitudinal GFRP bars at Pg load level (εfg). The
εfg of GGC-8-00 was 1647 με, which is equivalent to 8.7% of the GFRP bars’ ultimate tensile
strain εf. Generally, the GFRP ties enhanced the εfg of the short columns. The εfg of
GGC-8-H100 and GGC-8-H200 were 1779 με and 1803 με, respectively, yielding εfg/εf ratios of 9.4%
and 9.5%, respectively. The well-confined GGC-8-H50, on the other hand, yielded the highest
εfg among the columns with circular hoops, equivalent to 3070 με or 13.3% of εf. GGC-8-S50
and GGC-8-S100 developed εfg of 2116 με and 1967 με, respectively, translating to strain
development of 11.2% and 10.4% of εf, respectively. The strains in the bars at Pc load level
were also summarized in Table 4. The εfc were 6047 με, 5955 με, 8648 με, and 7866 με for
GGC-8-H50, GGC-8-H100, GGC-8-S50, and GGC-8-S100, respectively, translating to εfc/εf
ratios of 32.0%, 31.5%, 45.8%, and 41.6%, respectively. These values were lower than the strain ratio capacity (51.7%) reported earlier. GGC-16-H100 (1436 με) and GGC-16-S100 (1922 με) produced εfg/εf ratios of 7.6% and 10.2%, respectively. These results showed that the
116
εfg of the short columns εfg-av (2036 με) was relatively comparable to εcg-ave, suggesting the
compatibility between the bars and the geopolymer concrete and that equivalency between these materials could be assumed for design and analysis purposes. Furthermore, this strain value was higher than the design strain limit of 1000 με proposed by Zadeh and Nanni [55] to avoid exaggerated deflections.
Figure 13 shows the relationships between the axial load and the lateral-tie strain. Marginal strains (εftg) were recorded at lower loads. After exceeding the load equivalent to
GGC-8-H100’s Pg, however, relatively higher strains were obtained from GGC-8-H50 and
GGC-8-S50 because of the early spalling of their concrete covers compared to the columns with wider tie spacing. The εftg of GGC-8-H50 (1729 με) was higher than that of GGC-8-H100
(664 με) and GGC-8-H200 (853 με). A similar trend was also observed in the spiral-confined columns with GGC-8-S50 (968 με) yielding a higher εftg than GGC-8-S100 (730 με). The trend
reversed, however, right after the Pg load level was reached. The εftc, the transverse
reinforcement strain at Pc load level, were 5569 με and 13131 με for 8-H100 and
GGC-8-S100, respectively. These strains were higher than that of GGC-8-H100 (3302 με) and GGC-8-S100 (7765 με), respectively. On the other hand, the columns with spiral reinforcement generally yielded higher εftc compared to their counterpart columns with circular hoops.
GGC-16-H100 and GGC-16-S100 recorded εftg values of 552 με and 700 με, respectively, which
[image:22.595.74.526.624.762.2]were lower than their counterpart short columns. Table 4
Geopolymer concrete and GFRP reinforcement strains.
Column εcg, με εfg, με εfc, με εftg, με εftc, με
GGC-8-00 1424 1647 - - -
GGC-8-H50 2129 2518 6047 1729 3302
GGC-8-H100 1845 1779 5955 664 5569
GGC-8-H200 2183 1803 - 853 -
GGC-8-S50 2183 2116 8680 968 7765
GGC-8-S100 1821 1967 7866 730 13131
117 Fig. 11. Axial load versus geopolymer
[image:23.595.83.284.107.252.2]concrete strain curves.
Fig. 12. Axial load versus longitudinal bar strain curves.
Fig. 13. Axial load versus lateral-tie strain curves.
3.5. Confinement Efficiency and Ductility Index
In this study, the column ductility index (D.I.) was defined as the ratio of the displacement that corresponds to 85% of Ppeak to the displacement that corresponds to the elastic behavior limit
(Δ85/Δ1), as shown in Figure 14. The procedure for determining these displacements was based
on Pantelides et al.’s [26] recommendations. The confinement efficiency (C.E.), on the other hand, was computed as the ratio of the compressive strength of the confined column to the compressive strength of the unconfined column (f’cc/f’co). The f’cc was calculated as the peak
load divided by the area of the confined geopolymer concrete, which is represented by point C 0 500 1000 1500 2000 2500
0 1000 2000 3000 4000
A
xial l
oad
(kN)
Strain (με)
GGC-8-00 GGC-8-H50 GGC-8-H100 GGC-8-H200 GGC-16-H100 GGC-8-S50 GGC-8-S100 GGC-16-S100 0 500 1000 1500 2000 2500
0 2500 5000 7500 10000
Ax
ial load
(kN)
Strain (με)
GGC-8-00 GGC-8-H50 GGC-8-H100 GGC-8-H200 GGC-16-H100 GGC-8-S50 GGC-8-S100 GGC-16-S100 0 500 1000 1500 2000 2500
0 5000 10000 15000 20000
A xia l loa d (k N )
Strain (με)
[image:23.595.190.404.325.486.2]118 in Figure 15. The f’co, on the other hand, was equivalent to 0.90f’c. Table 5 summarizes the D.I.
[image:24.595.326.498.491.626.2]and C.E. values of the tested columns. Based on the experimental results, the ductility index and confinement efficiency increased when the amount of transverse reinforcement increased. These results are consistent with Afifi et al.’s [39] findings on circular concrete columns reinforced with GFRP bars and spirals. Sharma et al. [58] also reported a similar trend regarding the ductility of the confined columns for conventional RC columns. The geopolymer concrete columns with spiral reinforcement, in general, showed higher ductility and confinement efficiency than those with circular hoops. These findings are not consistent with those of Mohamed et al. [40] wherein they concluded that the FRP circular hoops have similar confining efficiency as the FRP spirals. This could be expected since they utilized hoops with longer lap or splice lengths, approximately 2.5 to 5 times longer than that of the hoops employed in this study. The ductility and confinement efficiency of the slender geopolymer concrete columns were not considered in this study, mainly because of the nature of failure of these specimens.
Fig. 14. Definition of Δ85 and Δ1. Fig. 15. Confined stress-deformation curve
of GGC-8-S50. A xia l lo ad Axial deformation 0.85Ppeak
Δ1 Δ85
Ppeak 0 10 20 30 40 50 60 70 80
0 5 10 15 20 25 30
Ax
ial stre
ss
(MPa
)
Axial deformation (mm) A B C Confined geopolymer concrete behaviour Unconfined geopolymer concrete behaviour A: Beginning of spalling
[image:24.595.87.274.492.626.2]119 Table 5
Normalised strength, ductility index (D.I.) and confinement efficiency (C.E.) of GFRP-RGC and GFRP-RC circular columns.
Author Specimen Type (%)ρft ݂ܲെ ܲ
ᇱܣ D.I. C.E. Current Study GGC-8-H50 Hoop 3.13 85.9 2.08 1.84
GGC-8-H100 Hoop 1.57 99.1 1.32 1.74
GGC-8-S50 Spiral 3.13 90.1 2.99 2.13
GGC-8-S100 Spiral 1.57 102.7 1.79 1.67
Afifi et al. 2013 G4V-3H80 Spiral 1.48 89.0 1.13 1.37
G8V-3H40 Spiral 2.95 89.4 4.75 1.89
G8V-3H80 Spiral 1.48 89.2 2.00 1.69
G8V-3H120 Spiral 0.98 85.9 1.54 1.32
G12V-3H80 Spiral 1.48 89.4 2.45 1.78
Mohamed et al. 2014 G3H200 Hoop 1.48 88.8 1.83 1.57
G3H400 Hoop 1.48 84.8 1.88 1.60
G3H600 Hoop 1.48 87.7 1.91 1.63
Pantelides et al. 2013 13GLCTL Spiral 1.91 - 1.70 1.76
14GLCTL Spiral 1.91 - 3.60 1.59
3.6. Lateral Deflection
120
Fig. 16. Axial load versus lateral deflection.
4. Discussion
4.1. Influence of the Transverse Reinforcement
The provision of transverse reinforcement generally enhanced the compression performance of the tested GFRP-RGC columns. The compression failure of the confined columns was less brittle compared to the unconfined control specimen. At Pg load level, the average strength and
deformation capacity of the confined columns were 10% and 1%, respectively, higher than that of the corresponding values for the unconfined column. Furthermore, the average geopolymer concrete and longitudinal GFRP bar strains of confined columns were 24% and 43% higher, respectively, than that of the unconfined column, suggesting the ties’ effectiveness in enhancing the strain development in each component material of the column.
4.2. Influence of the Transverse-Reinforcement Spacing
The effect of the amount of transverse reinforcement on the performance of confined concrete has been well studied. As can be expected, the closer the tie spacing or the larger the volumetric ratio, the less brittle the compression failure of the tested columns, showing a slower rate of strength decay after the peak. After the geopolymer-concrete cover spalled, the well-confined
0 500 1000 1500 2000 2500
-5 0 5 10 15 20
Axia
l lo
ad
(
kN)
Deflection (mm)
121 columns (GGC-8-H50 and GGC-8-S50) showed relatively higher strength and deformation capacities than the less-confined columns (GGC-8-H100 and GGC-8-S100). These observations tend to support Paultre and Legeron’s [59] generalization for confined columns, which states that the effectiveness of confinement reinforcement in restraining concrete varies from “one” for a continuous tube to “zero” when the ties are spaced more than half the minimum core cross section. This conclusion may also explain why the poorly confined GGC-8-200 evidenced load–deformation behavior and failure mode similar to GGC-8-00, since the hoop spacing was too wide to provide any lateral confinement. Interestingly, the columns with a volumetric ratio of 3.13% or a transverse-reinforcement spacing of 50 mm on centers yielded another peak and deformation capacities that were higher than their initial capacities. This can be related to the high confinement that enhanced the geopolymer-concrete core and prevented vertical GFRP bar buckling, owing to reduced the unbraced length of the bars, which enhanced the compression contribution of the GFRP bars.
The amount of transverse reinforcement, expressed in terms of ρft, played a major role
after the concrete cover spalled. An adequate amount of lateral reinforcement with respect to the unsupported length of longitudinal reinforcement ensured the stability of the longitudinal reinforcement between the ties. Furthermore, after the concrete spalled, the well-confined geopolymer-concrete columns yielded an ascending load–deformation relationship, while the poorly confined geopolymer-concrete columns produced a descending response.
4.3. Influence of the Transverse-Reinforcement Configuration
122 perimeter and along the height of the geopolymer-concrete core. This observation corroborates Yong et al.’s [60] and Mohamed et al.’s [40] findings for conventional RC and FRP-RC columns, respectively. Furthermore, the difference between the two types of lateral ties can be clearly seen after the spalling of the concrete cover of the well-confined columns. The Pc
-to-Pg ratio of GGC-8-S50 was 1.18, whereas, for GGC-8-H50, the ratio was just 1.04. This result
tends to suggest that the strength enhancement in hoop-confined columns due to transverse reinforcement could be ignored. Interestingly, this finding corroborates those of Kent and Park [61] for rectangular conventional RC columns transversely reinforced with rectilinear ties, in which the concrete core delineated by the outer tie diameter was not fully confined due to the non-uniform lateral pressure that resulted in poor strength enhancement. This could be attributed to the discontinuous nature of the circular hoops, since the column failure was governed by lap-splice failure at the joint and not by the GFRP ties rupturing. It can be deduced, therefore, with the same amount of strength and ductility improvement, hoop-confined columns should be much more confined than spiral-confined columns.
4.4. Influence of the Slenderness Ratio (L/r)
Generally, the columns with higher slenderness ratios and confined with hoops and spirals yielded strength capacities (Pg) that were 66% and 82% of the strength of their short-column
counterparts. The hoop-confined slender column yielded εcg, εfg, and εftg that were just 35%,
123 to the strength of the material—which lowered their strength capacities and did not allow the efficient use of each component material. The higher deformation values could be attributed to column lateral movement. Clearly, these results indicate the influence of slenderness in the tested columns with L/r =16, thereby suggesting that the previously proposed slenderness limit for GFRP-RC columns (17.2) must be lowered for the proposed system. The critical buckling load Pc—estimated from Equation 1—was equivalent to 1898 kN. This is higher than the Pg of
the tested slender columns, indicating that a lower Pc limit must be adopted for the proposed
system. Further research is needed, however, to support these generalizations.
2 2
c
u
EI P
kL
(1a)
0.2 1
c g f se
d
E I E I EI
(1b)
4.5. Theoretical Prediction
The nominal capacities of the tested GFRP-RGC columns were determined using the equations below. These formulas were used to estimate column strength at Pg load levels. Figure 17
shows the comparison of the experimental-to-predicted (Pg-to-Po) ratios using these equations.
' '
1
(
);
10.85 0.0015
0.67
o c g f c
P
f A A
f
(2)'
0.85 (
)
o c g f
P
f A A
(3)'
0.85 (
)
o c g f g fu f
P
f A A
f A
(4)'
0.90 (
)
o c g f fg f f
124 Of the current North American standards for FRP-RC systems, only CSA S806-12 has established a prediction equation for FRP-RC columns, as depicted by Equation 2. This equation, however, ignores the compression contribution of the FRP bars. Using this equation, the ratios of the peak experimental load-to-predicted nominal capacity (Pg/Po) varied from
113% to 143%, with an average value of 129%. Equation 3 was based on the equation in ACI 318-11 [62] recommended for conventional RC columns. It neglects, however, the compression contribution of GFRP bars. Based on this formula, the Pg/Po ratios ranged from
105% to 129% with an average value of 121%, yielding less conservative estimates compared to Equation 1.
Equation 4 depicts the equation recommended by Afifi et al. [39]. The compression contribution of the GFRP bars was considered by introducing a factor αg that accounts for the
reduced compressive strength of the GFRP bars as a function of their tensile strength. Currently, no standard test is available to determine the compressive strength of FRP bars. Hence, in order to determine the factor αg in this study, five 15.9 mm GFRP bars 40 mm in
length were used and were subjected to compressive testing. The test yielded an average αg
approximately equivalent to 0.5. From Equation 4, the Pg/Po ratios ranged from 72% to 92%
125 compared to a GFRP-RC system. Further studies, however, are recommended to validate these conclusions. The longitudinal reinforcement’s contribution was calculated based on the actual strains in the bars, represented by εfg-ave. This strain corresponds to the average compression
strain in GFRP bars at the Pg load level or the strain at which the plastic deformation of the
geopolymer concrete initiated. Based on the column compression test, the εfg-ave was equivalent
to 0.002. The Pg/Po ratios varied from 68% to 111%, with an average value of 100%.
Interestingly, among the equations considered herein, this equation yielded the relatively most accurate prediction of the nominal capacity of the column specimens. In addition, this equation produced conservative estimates, except for the slender columns, thereby suggesting the equation’s suitability in predicting the capacity of short GFRP-RGC columns. A new equation must, therefore, be proposed to consider the slenderness effect on the capacity of GFRP-RGC columns.
Fig. 17. Pg-to-Po ratios.
4.6. Comparison with the GFRP-RC Circular Columns
The performance of the tested GFRP-RGC circular columns was compared to that of Afifi et al.’s [39], Mohamed et al.’s [40], and Pantelides et al.’s [26] GFRP-RC circular columns in terms of normalized strength, ductility index, and confinement efficiency. These values were
0 20 40 60 80 100 120 140 160 GGC-8 -00 GGC-8 -H50 GGC-8 -H100 GGC-8 -H200 GGC-8 -S 50 GGC-8 -S 100 GGC -1 6-H1 00 GGC -1 6-S1 00 Pg / Po (%)
CSA S806-12 Mohammad et al. 2013
[image:31.595.123.469.410.619.2]126 summarized in Table 5. The normalized strength was calculated as the difference between Pg
and Pf divided by the concrete strength (f’c) and the gross area (Ag) of the column. From the
table, it can be seen that the strength of the GFRP-RGC columns were higher than that of the GFRP-RC columns. Interestingly, this finding tends to support the authors’ earlier claim that GFRP bars have better compatibility with geopolymer concrete compared with OPC concrete, owing to the higher elastic modulus of the former concrete compared to the latter concrete. Comparing the ductility and confinement efficiency of RGC columns to that of GFRP-RC columns with comparable amounts and types of transverse reinforcement, the two systems showed relatively comparable performance. From these findings, it can be inferred that GFRP bars can be used as reinforcement for geopolymer-concrete columns, particularly when structural columns that are corrosion resistant and electromagnetic transparent are targeted. This conclusion corroborates Zadeh and Nanni’s [55] generalization based on past experimental research, stating that GFRP bars can be used to strengthen conventional RC columns.
4.7. Proposed stress-strain model for GFRP-RGC Circular Columns
Figure 18 shows the stress-strain curve adopted in this study. The linear elastic segment represents that of the unconfined and confined behaviour while the remaining segment embodies that of the confined behaviour only, upon the activation of the GFRP ties’ passive confinement. Equations 6a-e, proposed by Popovics [63], was employed to model the ascending branch (O-A-B) while Equations 7a-c, which was proposed by Han et al. [64] for high strength reinforced concrete tied columns, was used to model the descending part (B-C-D). The maximum confining pressure (flGFRP) was computed from Equation 8a-b. The constants
127 and 0.50 f’cc (εcc, ε0.85cc, and ε0.50cc, respectively); and transverse reinforcement strain at f’cc
(εftcc). These constants were tabulated in Table 6. Figure 19 shows a good correlation between
the predicted and the experimental stress-strain curves for the tested GFRP-RGC column specimens. The proposed equations, however, are applicable only for the specimens considered in this study. Further research works are needed to further calibrate the proposed equations.
',
1
m cc c ccc m c cc
c cc
f
f
m
(6a)sec c c
E
m
E E
(6b)' sec cc cc
E
f
(6c)
' ' b
cc co ft lGFRP
f
f
a
f
(6d)'
1
d ft lGFRP cc co cof
c
f
(6e)' 0.85 '
0.50
0.85 0.5
c cc0.3
c cc cc
cc cc
f
f
f
(7a)0.85
1
'f ft lGFRP cc co co
f
e
f
(7b)0.85
1
'h ft lGFRP cc co co
f
g
f
(7c)2
ftlGFRP f ftcc
f
E
(8a)
exp
ftcc
i
j
fts
128 Fig. 18. Adopted stress-strain curve for the confined geopolymer concrete.
Table 6
Constants a, b, c, d, e, f, g, h, i, and j.
Column a b c d e f g h i j
Hoop-confined column
22.01 -0.03 72.23 0.54 102.4
0 0.40 210.54 0.36 790.1 0.003
Spiral-confined column
34.88 0.05 132.8
8 0.64 35.39 0.36 7.25 0.02 196.1 0.009
a. GGC-8-00 b. GGC-8-H50 c. GGC-8-H100
d. GGC-8-H200 e. GGC-8-S50 f. GGC-8-S100
Fig. 19. Experimental and predicted stress-strain curves of the GFRP-RGC columns. 0 5 10 15 20 25 30 35 40
0 500 1000 1500 2000
Ax ial S tre ss (M P a)
Axial strain (με)
Experimental Predicted (Hoop) Predicted (Spiral) 0 10 20 30 40 50 60 70
0 2500 5000 7500 10000
A xia l s tr es s (M Pa)
Axial strain (με) Experimental Predicted 0 10 20 30 40 50 60 70
0 2000 4000 6000 8000
Ax ia l s tres s (MP a)
Axial strain (με)
Experimental Predicted 0 10 20 30 40 50 60 70
0 1000 2000 3000
A xia l st re ss ( M Pa )
Axial strain (με)
Experimental Predicted 0 10 20 30 40 50 60 70 80
0 2500 5000 7500 10000
Ax ial st re ss (M Pa)
Axial strain (με)
Experimental Predicted 0 10 20 30 40 50 60 70
0 2500 5000 7500 10000
Ax ia l s tres s (M Pa)
Axial strain (με)
129
4.8. Proposed compression relationship for GFRP bars
It was evident from the experiment that the GFRP bars in the columns with ties spaced at 50-200 mm exhibited local combined crushing and buckling failure while the control specimen undergone buckling failure; hence, two equations were proposed. Equation 9a shows the proposed relationship for predicting the ultimate compression stress in the GFRP bars (f’fu) that
undergone local combined crushing and buckling failure. The maximum value of 612.5 MPa was adopted from the compression test of GFRP bars. This equation was basically derived from the regression analysis of the experimental results acquired from the actual column test. To calculate the experimental f’fu, the load Pfg was divided by the total area and number of
longitudinal bars. The compression behaviour of GFRP bars encased in geopolymer concrete and confined by a closely spaced ties can intuitively be expected to be different from that of buckling test of the bars. The buckling test resulted in a fixed-fixed end condition while in the column test, the end conditions are not as simply defined. Furthermore, buckling behaviour of GFRP bars is not only influenced by the lateral bracing distance (or tie spacing) but also by the geopolymer concrete core condition [65]. Equation 9b, on the other hand, predicts that of GFRP bars that undergone global buckling failure, the bars in the control specimen. Interestingly, the obtained effective length factor k (0.926) was approximately equivalent to 1.0, which is typically adopted for pinned-end specimen. Table 7 shows a good agreement between the experimental and predicted results. Further research works, however, are needed to enhance the accuracy the proposed equations.
0.946 '
612.5 53.564
uf fuf
L
f
s
r
For: 50 mm < Luf < 200 mm (9a)
2 '
2
;
0.926
fcfu
uf f
E
f
k
kL r
130 Table 7
Compressive stress in GFRP bars.
Column Luf, mm Experimental, MPa Predicted, MPa
GGC-8-00 667 102 101.5
GGC-8-H50 50 158 142.2
GGC-8-H100 100 112 124.3 GGC-8-H200 200 112 105.7
GGC-8-S50 50 133 142.2
GGC-8-S100 100 123 124.3
5. Conclusion
This study investigated the behavior of geopolymer-concrete columns reinforced longitudinally and transversely with GFRP bars. From the experimental results, the following conclusions were drawn:
The compression contribution of the GFRP bars (2.43% reinforcement ratio) with respect to column capacity prior to concrete spalling varied from 6.6% to 10.5%, with an average value of 7.6%.
Irrespective of tie configuration, the columns with closely spaced lateral ties or higher volumetric ratios failed in a more ductile manner and showed higher confinement efficiency compared to the columns with relatively lower volumetric ratios. The hoop- and spiral-confined columns with ties spaced at 50 mm on centers yielded ductility indices [confinement efficiency] that were 58% [7%] and 67% [28%], respectively, higher than their counterpart columns with ties spaced 100 mm on centers.
131 ones (1.79 and 1.70, respectively). These findings could be attributed to the uniform lateral confining pressure of the spirals.
The short columns failed due to crushing and/or shear failure, while the slender columns failed due to buckling. Hence, irrespective of the type and amount of transverse reinforcement, the short columns yielded higher compression capacities than the slender columns. The hoop- and spiral-confined short columns with ties spaced at 100 mm on centers yielded strength capacities that were 22% and 71%, respectively, higher than their counterpart slender columns.
The GFRP-RGC circular columns yielded a relatively higher normalized strength (97.3%) compared to GFRP-RC circular columns (88.3%). This could be attributed to the higher elastic modulus of geopolymer concrete (33 GPa) compared to normal concrete (29 GPa) of the same grade (38 MPa), resulting in better compatibility in the GFRP-RGC system than in a GFRP-RC system. Further studies, however, are needed to validate this generalization.
The slender columns failed at a load 66% and 82% of the strength of their short-column counterparts. They exhibited higher deformation compared to the short columns due to the lateral movement and they failed due to buckling.
The nominal capacity of the tested columns could be estimated accurately using the proposed equation because it considers the actual geopolymer-concrete strength-reduction factor (0.90) and the actual compression contribution of the GFRP bars (using the average bar strain as being equivalent to 2000 με).
132
It can be inferred, therefore, that a GFRP-RGC system could be adopted as compression members, particularly when corrosion resistance, electromagnetic transparency, material greenness, durability, and sustainability are sought.Nomenclature:
Ab = nominal area of the GFRP bars (mm2)
Af = total area of the longitudinal GFRP reinforcement (mm2)
Ag = gross cross-sectional area of the column (mm2)
Aft = cross-sectional area of the trsnaverse reinforcement (mm2)
D = column diameter (mm)
Dc = concrete-core diameter delineated by the outside diameter of hoops or spirals
(mm)
Ec = modulus of elasticity of the concrete (MPa)
Ef = tensile modulus of the GFRP bars (MPa)
E’f = compression modulus of the GFRP bars (MPa)
Esec = tangent modulus modulus of elasticity of the concrete (MPa)
EI = flexural stiffness of the reinforced-concrete column
ffu = tensile strength of the GFRP bars (MPa)
f'fu = ultimate compressive stress in the GFRP bars (MPa)
f’c = concrete compressive strength (MPa)
f’cc = confined-column compressive strength (MPa)
f’co = unconfined-column in-place compressive strength, 0.9f’c (MPa)
f’lGFRP = maximum confinement pressure
Ise = moment of inertia of reinforcement about members’ centroidal axis (mm4)
k = effective length factor for buckling
ka = efficiency factor that accounts for the geometry of the section, taken as 1.0
for circular sections
ke = efficiency factor that accounts for the premature failure of the FRP system
L = column height (mm)
L/r = slenderness ratio
Luf = unsupported length of GFRP bars (mm)
m = parameter that controls the initial slope and curvature of the ascending branch
n = number of longitudinal bars
Pc = concrete core capacity (N, kN)
Pfc = compression contribution of GFRP bars at Pc load level (N, kN)
Pfg = compression contribution of GFRP bars at Pg load level (N, kN)
Pg = gross capacity of the column (N, kN)
Po = nominal capacity of the column (N, kN)
Ppeak = peak capacity of the column (N, kN)
r = radius of gyration (mm)
rf = radius of gyration of GFRP bars (mm)
s = circular hoop spacing or spiral pitch on-center (mm)
αg = compressive-strength reduction of the GFRP bar as a function of its tensile
strength
βd = concrete creep factor (assumed equivalent to 1.0 in this study)
Δc = deformation at Pc load level (mm)
133
Δ1 = displacement that corresponds to the limit of the elastic behavior (mm)
Δ85 = displacement that corresponds to 85% of maximum load (mm)
εc = axial strain in geopolymer concrete (με)
εcc = axial strain in confined geopolymer concrete at f’cc (με)
ε0.50cc = axial strain in confined geopolymer concrete at 0.50f’cc (με) in the
descending branch of the stress-strain model
ε0.85cc = axial strain in confined geopolymer concrete at 0.85f’cc (με) in the
descending branch of the stress-strain model
εcg = average axial concrete strain at Pg load level (με)
εcg-ave = average of εcg (με)
εco = axial strain in unconfined geopolymer concrete corresping to f’co (με)
εf = ultimate tensile strain of the GFRP bars
εfc = average strain in the longitudinal GFRP bars at Pc load level (με)
εfg = average strain in the longitudinal GFRP bars at Pg load level (με)
εfg-ave = average of εfg (με)
εftg = average tie strain at Pg load level (με)
εftc = average tie strain at Pc load level (με)
εftcc = tie strain at f’cc (με)
εft = ultimate tensile strain of the transverse reinforcement (με)
γb = safety factor
μ = ductility index
ϕf = nominal diameter of the GFRP bars (mm)
ρf = longitudinal reinforcement ratio
ρft = transverse reinforcement volumetric ratio
Acknowledgement
The authors would like to express their special thanks to V-ROD® Australia for providing the materials as well as to the Natural Science and Engineering Research Council of Canada (NSERC) and the technical staff of the structural lab at University of Southern Queensland.
References
[1] Rizkalla S, Hassan T, Hassan N. Design recommendations for the use of FRP for reinforcement and strengthening of concrete structures. Progress in Structural Engineering and Materials. 2003;5:16-28.
134 [3] Gangarao HVS, Tally N, Vijay PV. Reinforced concrete design with FRP composites: CRC Press; 2007.
[4] Kong DLY, Sanjayan JG. Effect of elevated temperatures on geopolymer paste, mortar and concrete. Cement and Concrete Research. 2010;40:334-9.
[5] Neupane K, Bajewa D, Shrestha R, Chalmers D, Sleep P. Mechanical properties of geopolymer concrete: Applicability of relationship defined by AS 3600. Concrete in Australia. 2014;40:50-6.
[6] Davidovits J. Geopolymers: Inorganic polymeric new materials. Journal of Thermal Analysis. 1991;37:1633-56.
[7] Duxson P, Provis JL, Lukey GC, Van Deventer JS. The role of inorganic polymer technology in the development of ‘green concrete’. Cement and Concrete Research. 2007;37:1590-7.
[8] Sofi M, van Deventer JSJ, Mendis PA, Lukey GC. Engineering properties of inorganic polymer concretes (IPCs). Cement and Concrete Research. 2007;37:251-7.
[9] Sarker PK. A constitutive model for fly ash-based geopolymer concrete. Architecture Civil Engineering Environment (The Silesian University of Technology). 2008;1:113-20.
[10] Olivia M, Nikraz H. Properties of fly ash geopolymer concrete designed by Taguchi method. Materials and Design. 2012;36:191-8.
[11] Adam MA, Said M, Mahmoud AA, Shanour AS. Analytical and experimental flexural behavior of concrete beams reinforced with glass fiber reinforced polymer bars. Construction and Building Materials. 2015;84:354-66.
135 [13] Kassem C, Farghaly AS, Benmokrane B. Evaluation of flexural behavior and serviceability performance of concrete beams reinforced with FRP bars. ASCE Journal of Composites for Construction. 2011;15:682-95.
[14] Benmokrane B, Chaallal O, Masmoudi R. Flexural response of concrete beams reinforced with FRP bars. ACI Structural Journal. 1996;91:46-55.
[15] Mohamed K, Farghaly AS, B.Benmokrane. Effect of web reinforcement in FRP-reinforced deep beams. In: Proceedings of the 7th International Conference on FRP Composites in Civil Engineering (CICE 2014). Vancouver, Canada; 2014. p. 79.
[16] Razaqpur AG, Spadea S. Shear strength of FRP reinforced concrete members with stirrups. Journal of Composites for Construction. 2015;19:04014025.
[17] Oller E, Marí A, Bairán JM, Cladera A. Shear design of reinforced concrete beams with FRP longitudinal and transverse reinforcement. Composites Part B: Engineering. 2015;74:104-22.
[18] Kumaravel S, Thirugnanasambandam S. Flexural behaviour of geopolymer concrete beams. International Journal of Advanced Engineering Research and Studies. 2013;3:4-6. [19] Abraham R, Raj S D, Abraham V. Strength and behaviour of geopolymer concrete beams. International Journal of Innovative Research in Science, Engineering and Technology. 2013;2:159-66.
[20] Dattatreya JK, Rajamane NP, Sabitha D, Ambily PS, Nataraja MC. Flexural behaviour of reinforced geopolymer concrete beams. International Journal of Civil and Structural Engineering. 2011;2:138-59.
136 [22] Ambily P, Madheswaran C, Lakhsmanan N, Dattatreya J, Sathik S. Experimental studies on shear behaviour of reinforced geopolymer concrete thin webbed T-beams with and without fibres. International Journal of Civil & Structural Engineering. 2012;3:128-40.
[23] Ng TS, Foster SJ. Shear strength of lightweight fibre reinforced geopolymer concrete composite beam. In: Fragomeni S, Venkatesan S, Lam NTK, Setunge S, editors. 21st Australasian Conference on the Mechanics and Structures of Materials. Victoria University, Melbourne, Australia: Taylor & Francis Group; 2010. p. 77-82.
[24] Maranan G, Manalo A, Benmokrane B, Karunasena W, Mendis P. Evaluation of the flexural strength and serviceability of geopolymer concrete beams reinforced with glass-fibre-reinforced polymer (GFRP) bars. Engineering Structures. 2015;101:529-41.
[25] Maranan G, Manalo A, Karunasena W, Benmokrane B, Mendis P. Comparison of the shear behaviour of geopolymer concrete beams with GFRP and steel transverse reinforcements. In: Wu Z, Wu G, Wang X, editors. The 12th International Symposium on Fiber Reinforced Polymers for Reinforced Concrete Structures (FRPRCS-12) & The 5th Asia-Pacific Conference on Fiber Reinforced Polymer in Structures (APFIS-2015). Nanjing, China; 2015. p. 169.
[26] Pantelides CP, Gibbons ME, Reaveley LD. Axial load behavior of concrete columns confined with GFRP spirals. Journal of Composites for Construction. 2013;17:305-13.
[27] De Luca A, Matta F, Nanni A. Behavior of full-scale glass fiber-reinforced polymer reinforced concrete columns under axial load. ACI Structural Journal. 2010;107.
[28] ACI 440.1R-06. Guide for the design and construction of structural concrete reinforced with FRP bars. Farmington Hills, Michigan, USA: American Concrete Institute; 2006.
137 [30] Chaallal O, Benmokrane B. Physical and mechanical performance of an innovative glass-fiber-reinforced plastic rod for concrete and grouted anchorages. Canadian Journal of Civil Engineering. 1993;20:254-68.
[31] Deitz D, Harik I, Gesund H. Physical properties of glass fiber reinforced polymer rebars in compression. Journal of Composites for Construction. 2003;7:363-6.
[32] Kobayashi K, Fujisaki T. Compressive behavior of FRP reinforcement in non-prestressed concrete members. In: Taerwe L, editor. Proceedings of the 2nd International RILEM Symposium (FRPRCS 2): Non-Metallic (FRP) Reinforcement for Concrete Structures: CRC Press; 1995. p. 267-74.
[33] Wu W-P. Thermomechanical properties of fiber reinforced plastic(FRP) bars. Dissertation Abstracts International (USA). 1992;52:292.
[34] Paramanantham NS. Investigation of the behavior of concrete columns reinforced with fiber reinforced plastic rebars [MS Thesis]. Texas, USA: Lamar University; 1993.
[35] Alsayed S, Al-Salloum Y, Almusallam T, Amjad M. Concrete columns reinforced by glass fiber reinforced polymer rods. ACI Special Publication. 1999;188.
[36] Tobbi H, Farghaly AS, Benmokrane B. Concrete columns reinforced longitudinally and transversally with glass fiber-reinforced polymer bars. ACI Structural Journal. 2012;109. [37] Tobbi H, Farghaly AS, Benmokrane B. Behavior of concentrically loaded fiber-reinforced polymer reinforced concrete columns with varying reinforcement types and ratios. ACI Structural Journal. 2014;111.
[38] Tobbi H, Farghaly AS, Benmokrane B. Strength model for concrete columns reinforced with fiber-reinforced polymer bars and ties. ACI Structural Journal. 2014;111.
138 [40] Mohamed HM, Afifi MZ, Benmokrane B. Performance evaluation of concrete columns reinforced longitudinally with FRP Bars and confined with FRP hoops and spirals under axial load. Journal of Bridge Engineering. 2014;19:04014020.
[41] Sumajouw D, Hardjito D, Wallah S, Rangan B. Fly ash-based geopolymer concrete: study of slender reinforced columns. Journal of Materials Science. 2007;42:3124-30.
[42] Sumajouw D, Hardjito D, Wallah S, Rangan B. Behavior of geopolymer concrete columns under equal load eccentricities. ACI Special Publication. 2005;228:577-94.
[43] Sarker PK. Analysis of geopolymer concrete columns. Materials and structures. 2009;42:715-24.
[44] Sujatha T, Kannapiran K, Nagan S. Strength assessment of heat cured geopolymer concrete slender column. Asian Journal of Civil Engineering. 2012;13:635-46.
[45] Maranan G, Manalo A, Karunasena K, Benmokrane B. Bond stress-slip behavior: case of GFRP bars in geopolymer concrete. Journal of Materials in Civil Engineering. 2014;27:04014116.
[46] Maranan G, Manalo A, Karunasena W, Benmokrane B. Pullout behaviour of GFRP bars with anchor head in geopolymer concrete. Composite Structures. 2015;132:1113-21.
[47] CSA S807-10. Specification for fibre-reinforced polymers. Toronto, Canada: Canadian Standards Association; 2010. p. 44.
[48] ACI 440.3R-12. Guide test methods for fiber-reinforced polymers (FRPs) for reinforcing or strengthening concrete structures. B2-Test method for longitudinal tensile properties of FRP bars. Farmington Hills, MI, USA: American Concrete Institute; 2012.
139 [51] ASTM C807-13. Standard test method for time of setting of hydraulic cement mortar by modified vicat needle. West Conshohocken, Pennsylvania, USA: ASTM International; 2013. [52] Aldred J, Day J. Is geopolymer concrete a suitable alternative to traditional concrete. 37th Conference on our World In Concrete and Structures. Singapore2012.
[53] Mirmiran A. Length Effects on FRP-Reinforced Concrete Columns. In: Saadatmanesh H, Ehsani MR, editors. The 2nd International Conference on Composites in Infrastructure (ICCI 1996). Tucson, AZ, USA: ICCI; 1998.
[54] Mirmiran A, Yuan W, Chen X. Design for slenderness in concrete columns internally reinforced with fiber-reinforced polymer bars. ACI Structural Journal. 2001;98.
[55] Zadeh HJ, Nanni A. Design of RC columns using glass FRP reinforcement. Journal of Composites for Construction. 2013;17:294-304.
[56] Afifi MZ. Behavior of circular concrete columns reinforced with FRP bars and stirrups [PhD Thesis]. Quebec, Canada: University of Sherbrooke; 2013.
[57] Saatcioglu M, Razvi SR. Strength and ductility of confined concrete. Journal of Structural Engineering. 1992;118:1590-607.
[58] Sharma UK, Bhargava P, Kaushik S. Behavior of confined high strength concrete columns under axial compression. Journal of Advanced Concrete Technology. 2005;3:267-81.
[59] Paultre P, Légeron F. Confinement reinforcement design for reinforced concrete columns. Journal of structural engineering. 2008;134:738-49.
[60] Yong Y-K, Nour MG, Nawy EG. Behavior of laterally confined high-strength concrete under axial loads. Journal of Structural Engineering. 1988;114:332-51.
[61] Kent DC, Park R. Flexural members with confined concrete. Journal of the Structural Division. 1971;97:1969-90.
140 [63] Popovics S. A numerical approach to the complete stress-strain curve of concrete. Cement and concrete research. 1973;3:583-99.
[64] Han B-S