S t a t i s t i c s i n f o c u s
Population and social conditions
Authors: Piotr JUCHNO, Alexandros BITOULAS
48/2011
Number of asylum applicants on rise during the first
quarter of 2011
More asylum seekers in EU-27 mainly due to the sharp increase
of applicants from Tunisia since February 2011
The number of Tunisians applying for asylum in the EU-27 increased sharply from around 50 per month in 2010, to 1 100 and 1 200 in February and March 2011 respectively. Nearly 90 % of Tunisians applied for international protection in Italy.
Overall, the number of asylum seekers in the EU-27 during the first quarter of 2011 increased by 4 000 compared with the same period of the previous year. In total, nearly 66 000 persons sought asylum in one of the EU Member States.
France and Germany remained the top
destination countries of asylum applicants with 14 300 and 12 000 applicants respectively.
Germany (+ 2 700) and Italy (+1 300) recorded the highest increases in numbers of applicants in absolute terms compared to the first quarter of
2010, while Sweden (- 1 900) and the
Netherlands (-700) recorded the largest falls.
In the first quarter of 2011, the main
citizenships of people seeking asylum in the EU-27 were Afghans (5 800), followed by Russians (4 100) and Iraqis (3 800). Tunisians (2 500) are now ranked eighth among the main countries of citizenship of asylum seekers.
55 600 first instance decisions on asylum
applications were issued in the EU-27 during the first quarter of 2011. One out of four of such decisions was positive; in total 13 500 persons received some type of protection status, including refugee status (6 800 decisions), subsidiary protection (4 600 decisions) or authorisation to stay for humanitarian reasons (2 100 decisions).
Figure 1: Asylum applicants, EU-27, January 2010 – March 2011
5 000 10 000 15 000 20 000 25 000 30 000
Jan. Feb. Mar. Apr. May Jun. Jul. Aug. Sep. Oct. Nov. Dec.
2010 2011
40 % of all applicants sought asylum in
Germany and France
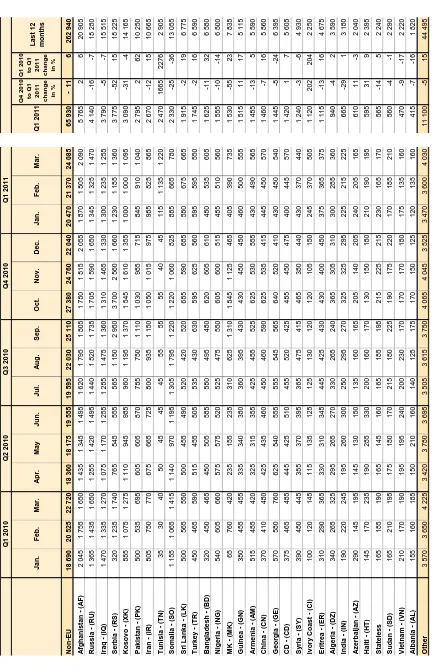
Nearly 66 000 third-country nationals (persons who are not citizens of an EU Member State) applied for asylum in the EU-27 during the first quarter of 2011 (Table 1). This represents an increase of 4 000 compared with the same quarter of the previous year.1 The number of asylum seekers increased slightly each month. To some extent, this resulted from the large influx of applicants from Tunisia (2 470 in Q1 2011 compared with 105 in Q1 2010), as well as from the increasing number of applicants from Pakistan (2 795 vs. 1 730) and Ivory Coast (1 120 vs. 365) (Table 2).
While Germany and Italy recorded the highest increases in absolute terms (2 700 and 1 300 respectively), the number of asylum seekers more than tripled in Luxembourg due to the large
increase in asylum seekers from Serbia.2 As a result Luxembourg became the country with the highest number of applicants relative to population (960 applicants per million inhabitants) (Table 1).
Sweden reported by far the sharpest drop in applicants in absolute terms during the first quarter of 2011. In total 1 900 fewer third-country
nationals applied for asylum in Sweden compared with the first quarter of 2010. This drop resulted mainly from the large decrease in applicants from Somalia (1 200 fewer).
With 14 335 and 12 035 applicants respectively, France and Germany remained the top destination countries in the EU for people seeking asylum.
Citizens of more than 140 countries outside the European Union applied for asylum in the EU-27 during the first quarter of 2011. The highest number of applications was lodged by Afghan citizens (5 765) followed by Russians (4 140), Iraqis (3 790) and Serbians (3 775) (Table 2).
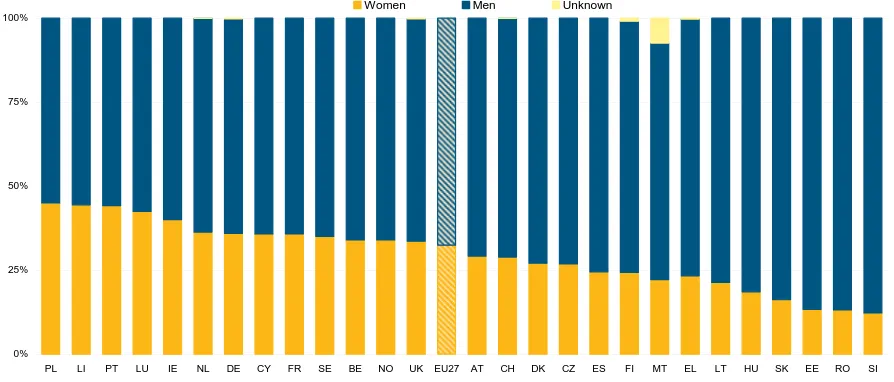
Due to the sharp increase in applicants during February and March 2011, Tunisians (2 470 applicants) entered the list of top ten countries of citizenship of asylum seekers. Nearly 98 per cent of applicants from Tunisia were males (Figure 5) with approximately nine out ten applicants aged 18-34 (Table 4).
1
Another insight into the observation of the development of the number of asylum applicants represents the change over the previous quarter. Given the available historical statistics the number of applicants usually drops during the months January-March compared to the period October-December.
2
Very high relative increases recorded in Latvia, Slovenia and Estonia during this period relate to low absolute changes.
90 per cent of Tunisians applying for asylum in the EU-27 lodged their application in Italy which highlights the importance of geographical proximity as one of the potential factors
influencing the choice of the destination country for asylum seekers (Table 6). Among other such factors are the social and economic situation, the presence of certain ethnic communities,
immigration policy in the country of destination, language or historical ties or the activities of people traffickers.
Similarly to Tunisians applying for asylum in Italy, other examples of high concentration of applicants of certain citizenship in one of the EU-27 Member States were also observed. Nearly 70 per cent of all asylum applicants from Bangladesh and the
Democratic Republic of Congo were seeking asylum in France. France recorded also the majority of the applicants from Armenia and Sri Lanka (55 and 52 per cent respectively), while more than a half of all asylum seekers from Vietnam applied for asylum in Germany (54 per cent).
One out of four asylum decisions
granted during Q1 2011 was positive
In the EU-27 Member States asylum applications are examined by the national authorities
responsible for asylum procedures. Most of the decisions following applications are granted at the first instance level, although according to national law other instances may also grant decisions in response to appeals.
During Q1 2011 out of 55 620 decisions issued at the first instance in the EU-27 about one quarter (13 535 decisions) resulted in a positive judgement, while the remaining 42 085 were negative. With 2 540 Germany granted the highest number of positive decisions in the EU-27 in Q1 2011,
followed by the Netherlands (1 855) and the United Kingdom (1 805) (Table 9).
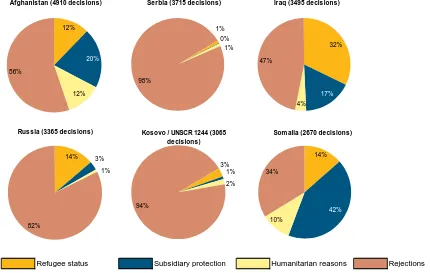
The highest number of total decisions in the EU-27 was issued to citizens of Afghanistan (4 910). Afghans received also the highest absolute number of positive decisions (2 195) (Table 11). However, in relative terms3, of the major countries of citizenship, Somalis were most frequently granted some form of protection in the EU-27, with nearly two out of three granted positive decisions (Figure 7).
3
Statistics on asylum applicants during the 1st quarter of 2011
Figure 2: Asylum applicants, absolute and relative change between Q1/2010 and Q1/2011
-4,000 -3,000 -2,000 -1,000 0 1,000 2,000 3,000 4,000 5,000 6,000 7,000 8,000 9,000 10,000
SE NL HU NO DK FI CY IE PL CZ LI SK BG PT EE LT LV MT RO SI AT ES LU EL UK CH FR BE IT DE EU27
-100 % -75 % -50 % -25 % 0 % 25 % 50 % 75 % 100 % 125 % 150 % 175 % 200 % 225 % 250 % Absolute change Relative change
Note: For country codes please refer to the section Abbreviations in Methodology. Source: Eurostat (online data code: migr_asyappctzm)
Figure 3: Asylum applicants by citizenship, absolute and relative change between Q1/2010 and Q1/2011 in the EU-27
-4,000 -3,000 -2,000 -1,000 0 1,000 2,000 3,000 4,000 5,000 6,000 7,000 8,000 9,000 10,000
SO GE RU IQ NG XK VN AL SY AZ SD IN DZ STATELESS
HT AM CD ER CN GN TR MK LK AF IR BD RS CI PK TN Non-EU
-100 % -75 % -50 % -25 % 0 % 25 % 50 % 75 % 100 % 125 % 150 % 175 % 200 % 225 % 250 % Absolute change Relative change
Note: For country codes please refer to Table 2. Source: Eurostat (online data code: migr_asyappctzm)
[image:3.595.67.532.484.679.2]T
[image:4.595.86.508.78.773.2]a
ble 1: A
s y lu m appl icant s ( includi ng new asy lum appli c a n ts), Q1
2010 - Q1 2011 (r
ounded figures) Jan . F eb . M ar. A p r. M ay Ju n . Ju l. A u g . S e p . O c t. No v . Dec. Jan . F eb . M ar. Q1 2011 Q4 20 10 to Q1 20 11 ch an g e i n % Q 1 201 0 t o Q1 20 11 ch an g e i n % A p plic an ts p e r m illi on in hab itants 1) Q1 20 11 L ast 1 2 m ont hs EU-2 7 18 690 2 0 5 2 5 22 720 18 360 1 8 17 5 19 555 19 595 22 03 0 25 110 27 380 24 76 0 22 0 4 0 20 470 21 370 2 4 0 8 5 6 5 9 3 0
- 11
6 1 30 26 2 94 0 Be lg ium 1 660 2 8 3 5 1 840 1 510 1 59 5 1 800 1 955 2 33 0 2 300 2 855 2 71 0 2 745 2 305 2 330 2 8 1 5 7 4 5 0 -10 1 8 6 8 0 27 2 45 Bu lga ria 100 85 100 75 5 5 85 95 9 5 75 65 9 5 105 115 9 0 70 2 7 5 3 -3 35 1 0 15 Cze c h R e public 65 75 105 75 8 0 65 45 7 0 50 55 4 5 50 65 5 5 70 1 9 0 2 7 -2 2 20 72 5 De nm a rk 405 4 2 0 390 370 3 9 0 320 370 53 5 455 540 42 5 440 360 280 3 1 5 9 5 5 -32 -2 1 1 7 0 4 8 15 Ge rm a n y 3 090 2 8 8 5 3 345 2 945 2 75 5 3 385 3 835 4 65 5 5 600 6 085 5 63 0 4 280 4 235 3 730 4 0 7 0 1 2 0 3 5 -25 2 9 1 4 5 51 2 05 Es tonia 5 5
5 5
*
5 5
* * 5 5 5 5 1 5 2 0 0 1 5 0 1 0 40 Ir e land 190 1 7 5 165 160 1 8 0 155 160 17 5 155 145 15 5 125 135 125 1 2 5 3 8 5 -9 -2 8 85 1 7 90 G ree ce 650 7 4 5 800 660 8 4 0 1 010 990 88 5 1 310 1 080 91 0 395 605 920 1 0 0 5 2 5 3 0 6 1 5 2 2 5 10 6 10 Spai n 175 2 3 0 225 200 1 8 0 200 250 26 0 285 240 29 0 210 240 335 3 6 5 9 3 5 2 7 4 8 20 3 0 45 F ran ce 3 635 4 7 1 0 5 000 4 235 4 11 5 4 230 4 205 3 92 5 4 180 5 070 4 28 0 5 140 4 400 4 640 5 2 9 5 1 4 3 3 5 -1 7 2 2 0 53 7 20 Ita ly 1 010 6 7 5 1 035 730 9 4 5 975 815 51 5 815 870 1 04 0 635 590 1 625 1 7 7 5 3 9 8 5 5 7 4 7 65 11 3 20 Cy p rus 215 2 1 0 190 175 2 1 0 235 215 17 0 190 215 35 5 490 185 145 1 2 5 4 6 0 -57 -2 6 5 7 0 2 7 10 La tv ia * 5 * 1 0 5 5 5 5 5 5 5 1 0 5 20 5 2 5 3 9 21 3 1 0 80 Lithua nia 35 30 35 15 5 0 30 30 4 0 35 65 8 0 60 35 3 5 35 1 0 5 -49 1 0 30 50 5 Lux e m bour g 50 55 55 45 4 5 45 45 5 0 90 95 10 5 100 115 145 2 3 0 4 9 0 6 3 2 11 9 6 0 1 1 15 Hu ngar y 275 2 5 0 230 240 2 2 0 185 120 11 0 115 115 13 0 100 115 8 5 1 3 5 3 4 0 -3 -5 5 35 1 6 80 Ma lt a 25 5 5 10 1 5 * 40 1 5 10 10 1 5 20 10 1 5 30 55 15 4 6 1 3 0 19 5 Ne the rla nds 1 430 1 2 6 0 1 495 1 120 8 9 0 1 085 870 1 18 5 1 450 1 535 1 59 0 1 200 1 255 1 090 1 1 5 5 3 5 0 0 -19 -1 6 2 1 0 14 4 15 Au s tr ia 805 7 9 5 875 760 9 1 5 910 905 1 24 0 960 975 1 00 0 905 880 910 9 7 0 2 7 6 0 -4 1 1 3 3 0 11 3 30 Pol a nd 390 4 1 0 605 500 4 8 5 530 450 70 0 675 630 55 0 610 365 450 5 2 0 1 3 3 5 -25 -5 35 6 4 70 Por tuga l 10 20 10 10 1 5 15 15 2 0 15 10 5 15 10 2 0 15 45 26 1 9 5 16 5 Ro ma nia 50 55 125 70 1 1 5 60 45 10 0 70 80 5 5 55 50 8 5 1 2 5 2 6 0 3 3 1 2 10 91 5 Sl ov eni a 15 10 15 5 2 5 20 10 1 5 20 25 4 5 45 35 3 5 30 1 0 0 -13 1 6 5 50 30 5 Slo v aki a 55 20 45 50 7 0 55 55 5 5 45 35 2 5 30 35 4 5 30 1 0 5 1 7 -1 3 20 52 5 Finl a nd 275 2 7 0 335 225 2 0 0 205 235 27 0 295 255 24 5 275 230 205 2 4 0 6 7 5 -13 -2 3 1 2 5 2 8 85 Sw ed en 2 230 2 3 3 0 3 570 2 155 1 87 5 1 910 1 910 2 74 5 3 880 4 200 2 83 5 2 230 1 965 1 960 2 3 0 5 6 2 3 0 -33 -2 3 6 6 0 29 9 75 Un ited K ingdom 1 840 1 9 7 5 2 120 2 005 1 89 0 2 035 1 925 1 86 0 2 035 2 125 2 14 5 1 765 2 140 1 995 2 2 2 5 6 3 6 0 5 7 1 0 0 24 1 40 Icel an d :: ::: :::: ::: ::: : : : : : Liechte n s tein 5 2 0 3 5 5 5 5 * * 5 5 10 1 5 1 0 5 1 5 2 5 8 -13 74 5 75 No rw a y 845 7 4 0 920 590 6 8 5 735 885 1 03 0 980 960 88 5 775 830 670 6 9 5 2 1 9 5 -16 1 9 4 4 5 9 7 10 Sw itz e rl and 1 190 1 1 6 5 1 300 1 175 1 08 0 1 260 1 145 1 37 0 1 380 1 385 1 57 5 1 415 1 220 1 250 1 8 6 5 4 3 3 5 -1 -5 2 5 5 0 16 1 15 1) R e lative to populat
ion as of
1
st of
J anu ary 2011 (p rovi s ional dat a). re pres ent
s 2 or f
e w e r as y lum applic an ts r e co
rded in the
r e fe renc e period . : - repre s ent s da ta are no t av
ailable in the re
fe renc e period. Q 3 20 10 Q 4 20 10 Q 1 2 010 Q 2 20 10 Q 1 201 1 Source
: Eurostat (online data code:
m
igr
_asyappctzm
T a ble 2: A s y lum appl ica n ts i n t h e EU-27 by cit iz e nsh ip ( in c lu din g new asy lu m app li cant s ), Q 1 /1 0-Q 1 /11 (rou nded f igures) J a n. Feb . M a r. A p r. M a y J u n . J ul . A ug. Sep . O c t. N o v . De c. Jan . F eb. M ar . Q 1 2 011 Q 4 2010 to Q 1 2 011 change in % Q 1 2010
to Q1 2011 chang
e in % Last 12 mont hs N on-EU 18 690 20 525 22 720 18 360 18 175 19 555 19 595 22 030 25 110 27 380 24 760 22 040 2 0 470 2 1 370 2 4 085 65 930 - 11 6 262 940 A fghan ist an ( A F) 2 045 1 755 1 650 1 435 1 345 1 495 1 620 1 795 1 805 1 780 1 815 2 055 1 870 1 805 2 090 5 765 2 6 20 905 R u ssi a (R U) 1 365 1 435 1 650 1 285 1 420 1 495 1 440 1 820 1 735 1 705 1 590 1 650 1 345 1 325 1 470 4 140 -1 6 -7 18 280 Ir a q - (I Q) 1 470 1 335 1 270 1 075 1 170 1 255 1 285 1 475 1 360 1 310 1 465 1 330 1 300 1 235 1 255 3 790 -8 -7 15 515 S e rb ia - (R S) 320 1 235 1 740 765 545 555 565 1 150 2 950 3 700 2 560 1 660 1 230 1 185 1 360 3 775 -5 2 1 5 18 225 Kos o v o (X K ) 885 1 075 1 275 1 110 945 985 960 1 195 1 370 1 545 1 610 1 355 1 000 1 000 1 095 3 090 -3 1 -4 14 165 Pak ist an ( P K ) 500 535 695 605 605 870 785 750 1 110 1 030 985 715 845 910 1 040 2 795 2 6 2 10 250 Ir a n - (I R ) 805 750 770 675 665 725 800 935 1 150 1 050 1 015 975 985 825 865 2 670 -1 2 1 5 10 665 T uni si a ( T N) 35 30 40 50 45 45 45 55 55 55 40 45 115 1 135 1 220 2 470 1665 2276 2 905 S o ma li a - (S O) 1 155 1 065 1 415 1 140 970 1 195 1 305 1 795 1 220 1 220 1 060 825 885 665 780 2 330 -2 5 -36 13 055 Sri L a
nka - (
L K ) 500 565 550 500 455 490 520 420 520 685 590 685 580 675 665 1 915 -2 19 6 775 T u rkey (T R) 450 465 590 515 455 505 535 430 630 595 625 560 595 595 550 1 745 -2 16 6 590 Banglades h (BD) 320 450 465 480 505 585 580 495 480 620 605 610 480 535 605 1 625 -1 1 3 2 6 580 Ni ger ia (N G) 540 605 660 575 575 520 525 475 550 605 600 515 485 510 560 1 555 -1 0 -14 6 500 MK ( M K ) 65 760 420 235 155 235 310 625 1 310 1 845 1 125 465 405 390 735 1 530 -5 5 2 3 7 835 Gu in e a - (GN ) 380 455 455 335 340 380 360 395 430 430 480 450 460 500 555 1 515 11 17 5 115 A rm e n
ia - (A
M ) 515 485 420 325 315 355 425 455 525 625 530 555 430 490 565 1 485 -1 3 5 5 590 Ch in a - (C N) 370 410 480 425 435 460 450 460 590 625 535 415 445 450 570 1 460 -7 16 5 860 G e orgia ( G E) 570 580 760 625 540 555 555 545 565 640 520 410 430 480 540 1 445 -8 -2 4 6 395 CD (C D) 375 465 485 445 425 510 455 520 425 485 450 475 400 445 570 1 420 1 7 5 605 S y ria - (SY) 390 480 445 385 370 395 365 475 415 465 380 440 430 370 440 1 240 -3 -6 4 930 Ivory Coa s t - (C I) 100 120 145 115 135 125 125 130 120 120 105 150 245 370 505 1 120 202 204 2 250 E rit re a - (E R) 310 290 365 330 310 345 445 425 430 430 400 450 375 365 375 1 115 -1 3 1 6 4 675 A lge ri a - (D Z) 340 265 325 295 265 270 330 265 240 365 305 310 300 285 360 940 -4 2 3 590
India - (
IN) 190 220 245 195 260 300 250 295 270 325 325 295 225 215 225 665 -2 9 1 3 180 A z erbai jan (A Z ) 290 145 195 145 130 150 135 160 165 205 140 205 240 205 165 610 11 -3 2 040 Ha it
i - (HT)
145 170 235 190 285 330 200 160 170 130 150 180 210 190 195 595 31 9 2 395 St at el ess 165 185 190 165 145 160 165 185 195 215 225 215 230 165 170 565 -1 4 5 2 240 S u dan ( S D) 165 210 195 175 180 170 215 180 225 190 175 220 170 185 210 560 -4 -1 2 290 Vi et n a m - ( V N ) 210 170 190 195 195 240 200 230 170 170 170 180 175 135 160 470 -9 -1 7 2 220 A lba n ia - (A L) 155 160 185 150 210 160 140 125 175 170 150 125 120 135 160 415 -7 -1 6 1 820 Oth e r 3 570 3 650 4 225 3 420 3 780 3 695 3 505 3 615 3 750 4 065 4 045 3 525 3 470 3 600 4 030 11 100 -5 15 44 495 Not e s : Cou n tr ie s s e lec ted he re ar e thos e w ith th e highes t num ber of as y lum a ppl ic ants r egi s ter ed dur ing Q 1 201 1 Kos o vo K o s o
vo / UN
SCR
1244; MK - th
e fo rm er Y u gos la v r epubl ic o f Mac edonia; CD Cong o, the D e m o c rat ic Republi c of t h e Q 3 2010 Q4 2010 Q 1 2 010 Q 2 2010 Q1 2011 Source
: Eurostat (online data code:
m
igr
_asyappctzm
[image:5.595.84.517.62.732.2]Table 3: Asylum applicants by age group, 1st quarter 2011 (in %)
0-13 14-17 18-34 35-64 65 and over Unknown EU-27 65 930 18.4 6.9 53.7 19.9 0.8 0.3 Belgium 7 450 21.4 9.4 48.2 20.4 0.5 0.0
Bulgaria 275 6.9 4.7 70.4 17.2 0.7 0.0
Czech Republic 190 15.8 0.5 43.2 40.0 0.5 0.0
Denmark 955 14.5 13.7 55.9 15.0 0.9 0.0
Germany 12 035 24.7 9.4 47.3 17.7 0.8 0.0
Estonia 15 0.0 0.0 80.0 20.0 0.0 0.0
Ireland 385 26.2 4.7 53.2 15.6 0.3 0.0
Greece 2 530 3.0 3.7 72.2 20.4 0.5 0.2
Spain 935 10.1 1.9 67.2 20.2 0.5 0.0
France 14 335 17.1 2.9 54.9 24.3 0.8 0.0
Italy 3 985 4.4 2.7 81.8 10.9 0.1 0.2
Cyprus 460 3.3 1.3 73.4 21.8 0.2 0.0
Latvia 25 0.0 0.0 60.0 36.0 4.0 0.0
Lithuania 105 15.5 6.8 46.6 31.1 0.0 0.0
Luxembourg 490 30.1 6.9 39.6 23.2 0.2 0.0
Hungary 340 18.3 8.0 57.5 16.2 0.0 0.0
Malta 55 9.3 5.6 46.3 29.6 1.9 7.4
Netherlands 3 500 19.4 9.3 51.0 19.1 1.2 0.0
Austria 2 760 27.8 8.6 47.0 16.0 0.6 0.0
Poland 1 335 36.3 3.4 37.0 22.6 0.6 0.0
Portugal 45 16.3 4.7 67.4 11.6 0.0 0.0
Romania 260 5.4 2.3 71.7 20.5 0.0 0.0
Slovenia 100 8.2 27.6 51.0 13.3 0.0 0.0
Slovakia 105 11.4 6.7 58.1 23.8 0.0 0.0
Finland 675 19.1 7.1 56.7 16.0 0.6 0.4
Sweden 6 230 20.7 11.2 47.6 18.9 1.6 0.0
United Kingdom 6 360 13.5 6.8 54.0 22.3 0.6 2.7
Iceland : : : : : : :
Liechtenstein 25 19.5 10.8 52.7 16.4 0.6 0.0
Norway 2 195 22.7 4.8 57.1 14.8 0.5 0.2
Switzerland 4 335 25.9 7.4 37.0 29.6 0.0 0.0
Total (absolute
value)
Distribution of age groups as a share of total (in %)
[image:6.595.78.525.537.728.2]: Data are not available in the reference period Source: Eurostat (online data code: migr_asyappctzm)
Figure 4: Asylum applicants by gender, 1st quarter 2011 (in %)
0% 25% 50% 75% 100%
PL LI PT LU IE NL DE CY FR SE BE NO UK EU27 AT CH DK CZ ES FI MT EL LT HU SK EE RO SI
Women Men Unknown
Table 4: Thirty main citizenships of asylum applicants1) in the EU-27, by age group, 1st quarter 2011 (in %)
0-13 14-17 18-34 35-64 65 and over Unknown
Non-EU 65 930 18.4 6.9 53.7 19.9 0.8 0.3
Afghanistan - (AF) 5 765 15.9 25.7 46.5 10.6 1.1 0.2
Russia - (RU) 4 140 39.8 4.7 33.3 21.3 1.0 0.0
Iraq - (IQ) 3 790 21.1 6.9 51.5 18.4 2.1 0.0
Serbia - (RS) 3 775 39.7 7.6 29.9 22.4 0.5 0.0
Kosovo - (XK) 3 090 31.3 6.5 41.7 19.7 0.7 0.0
Pakistan - (PK) 2 795 11.3 3.9 62.4 20.6 0.8 1.0
Iran - (IR) 2 670 10.2 6.4 58.0 24.3 0.7 0.4
Tunisia - (TN) 2 470 0.4 1.0 89.8 8.6 0.0 0.2
Somalia - (SO) 2 330 20.8 9.0 54.6 13.9 1.5 0.1
Sri Lanka - (LK) 1 915 11.1 1.8 62.3 22.4 1.7 0.7
Turkey - (TR) 1 745 11.8 4.8 66.4 16.5 0.4 0.2
Bangladesh - (BD) 1 625 2.8 1.4 76.3 19.2 0.1 0.3
Nigeria - (NG) 1 555 16.6 3.6 61.3 17.4 0.1 1.0
MK - (MK) 1 530 37.7 7.0 31.5 23.6 0.1 0.0
Guinea - (GN) 1 515 13.1 10.8 68.1 7.8 0.1 0.0
Armenia - (AM) 1 485 19.3 4.9 39.9 33.9 2.0 0.0
China - (CN) 1 460 6.6 1.4 54.9 36.1 0.5 0.5
Georgia - (GE) 1 445 14.7 2.8 47.3 33.7 1.1 0.4
CD - (CD) 1 420 20.4 5.7 49.3 23.6 0.7 0.4
Syria - (SY) 1 240 25.7 5.6 52.0 15.6 0.9 0.2
Ivory Coast - (CI) 1 120 7.2 3.2 68.3 20.9 0.1 0.3
Eritrea - (ER) 1 115 13.2 6.5 63.4 15.5 1.3 0.2
Algeria - (DZ) 940 4.0 6.4 66.8 22.5 0.1 0.1
India - (IN) 665 4.0 1.9 72.3 20.8 0.0 0.9
Azerbaijan - (AZ) 610 24.1 5.9 38.9 29.6 1.5 0.0
Haiti - (HT) 595 6.5 1.2 62.0 30.3 0.0 0.0
Stateless 565 19.1 3.9 55.5 19.7 1.1 0.7
Sudan - (SD) 560 7.7 2.3 74.6 14.4 0.2 0.9
Vietnam - (VN) 470 9.3 8.7 56.9 24.2 0.0 0.8
Albania - (AL) 415 16.8 8.4 52.9 20.0 1.7 0.2
Other 11 100 16.1 4.7 56.6 21.7 0.4 0.5
Total (absolute
value)
Distribution of age groups as a share of total (in %)
1) Citizenships selected here are those with the highest number of asylum applicants registered during Q1 2011 in the EU-27 Kosovo - Kosovo / UNSCR 1244; MK - the Former Yugoslav Republic of Macedonia; CD - Congo, the Democratic Republic of the; Source: Eurostat (online data code: migr_asyappctzm)
Figure 5: Thirty main citizenships of asylum applicants1) in the EU-27 by gender, 1st quarter 2011 (in %)
0% 25% 50% 75% 100%
VN RU CD MK RS AM AZ CN XK GE NG ER SO HT AL GN EXT_EU27
IQ IR SY STATELESS
LK AF CI TR PK SD IN DZ BD TN Women Men Unknown
[image:7.595.77.527.529.718.2]Table 5: Five main citizenships of asylum applicants1), 1st quarter 2011 (rounded figures)
(%)
Afghanistan 5 765 9
Russia 4 140 6
Iraq 3 790 6
Serbia 3 775 6
Kosovo / UNSCR 1244 3 090 5
Other 45 370 69
(%) (%) (%)
Serbia 805 11 Iraq 120 43 Ukraine 50 25
Kosovo / UNSCR 1244 735 10 Stateless 30 11 Belarus 15 8
Afghanistan 675 9 Afghanistan 25 9 Mongolia 15 7
Guinea 585 8 Syria 20 7 Kazakhstan 10 5
Russia 575 8 Iran 15 5 Kyrgyzstan 10 5
Other 4 070 55 Other 70 25 Other 95 49
(%) (%) (%)
Afghanistan 240 25 Afghanistan 1 890 16 Libya 5 20
Iran 130 14 Serbia 1 660 14 Afghanistan 5 20
Syria 100 11 Iraq 1 565 13 Belarus * *
Russia 80 8 Iran 805 7 Russia * *
Kosovo / UNSCR 1244 70 7 Syria 555 5 Cameroon * *
Other 340 35 Other 5 560 46 Other 5 0
(%) (%) (%)
China 60 15 Pakistan 625 25 Ivory Coast 205 22
Nigeria 50 13 Georgia 295 12 Cuba 115 12
Pakistan 45 12 Afghanistan 165 7 Western Sahara 65 7
Zimbabwe 25 6 Senegal 150 6 Nigeria 55 6
CD 20 5 China 140 6 Guinea 55 6
Other 185 48 Other 1 150 46 Other 440 47
(%) (%) (%)
Kosovo / UNSCR 1244 1 290 9 Tunisia 2 165 54 Vietnam 60 13
Bangladesh 1 125 8 Afghanistan 250 6 Pakistan 40 9
Russia 1 125 8 Pakistan 230 6 India 40 9
Sri Lanka 990 7 Nigeria 225 6 Nepal 40 9
CD 965 7 Turkey 215 5 Serbia 35 7
Other 8 845 62 Other 900 23 Other 240 53
(%) (%) (%)
Georgia 5 24 Georgia 30 30 Serbia 325 66
CD 5 20 Russia 25 22 MK 35 8
Bangladesh * * Afghanistan 15 17 Kosovo / UNSCR 1244 25 5
Russia * * Kyrgyzstan 10 9 Tunisia 15 3
Ukraine * * Armenia 5 5 Azerbaijan 10 2
Other 10 4 Other 20 17 Other 80 16
(%) (%) (%)
Afghanistan 160 47 Eritrea 20 41 Somalia 640 18
Kosovo / UNSCR 1244 30 9 Libya 5 7 Iraq 505 14
Syria 15 4 Tunisia 5 7 Afghanistan 440 13
Algeria 10 3 Pakistan 5 7 Iran 285 8
Nigeria 10 3 PS 5 7 Armenia 140 4
Other 120 35 Other 15 30 Other 1 490 43
(%) (%) (%)
Afghanistan 520 19 Russia 935 70 Ivory Coast 5 16
Russia 495 18 Georgia 245 19 Guinea 5 16
Iraq 140 5 Belarus 25 2 Cameroon 5 7
Turkey 130 5 Ukraine 15 1 Guinea-Bissau 5 7
Nigeria 110 4 Armenia 15 1 Nigeria 5 7
Other 1 365 49 Other 95 7 Other 20 47
(%) (%) (%)
Tunisia 35 13 Afghanistan 20 22 Moldova 15 16
Armenia 20 7 Turkey 15 14 Georgia 15 12
China 20 7 Serbia 10 10 India 10 10
Iraq 20 7 Algeria 5 5 Russia 10 9
Georgia 15 6 Kosovo / UNSCR 1244 5 4 Turkey 10 9
Other 155 60 Other 45 44 Other 45 44
(%) (%) (%)
Iraq 135 20 Somalia 805 13 Pakistan 815 13
Somalia 95 14 Afghanistan 705 11 Iran 720 11
Russia 80 12 Serbia 545 9 Sri Lanka 565 9
Afghanistan 60 9 Iraq 395 6 Afghanistan 395 6
Nigeria 35 5 Eritrea 395 6 Zimbabwe 335 5
Other 270 40 Other 3 390 54 Other 3 525 55
(%) (%) (%)
Serbia 10 41 Somalia 425 19 Eritrea 725 17
Russia 10 37 Eritrea 300 14 Nigeria 430 10
Nigeria * * Afghanistan 235 11 Tunisia 250 6
Bosnia and Herzegovina * * Iraq 115 5 MK 190 4
Kosovo / UNSCR 1244 * * Iran 95 4 Serbia 185 4
Other * * Other 1 020 46 Other 2 555 59
FINLAND SWEDEN UNITED KINGDOM
LIECHTENSTEIN NORWAY SWITZERLAND
PORTUGAL
ROMANIA SLOVENIA SLOVAKIA
LUXEMBOURG
HUNGARY MALTA NETHERLANDS
SPAIN
FRANCE ITALY CYPRUS
CZECH REPUBLIC
DENMARK GERMANY ESTONIA
BELGIUM
EU-27
BULGARIA
IRELAND GREECE
LATVIA LITHUANIA
AUSTRIA POLAND
1) Citizenships selected here are those with the highest number of asylum applicants registered during Q1 2011 * represents 2 or fewer applicants recorded in the reference period
CD – Congo, the Democratic Republic of the; MK – the former Yugoslav Republic of Macedonia; PS – Palestinian Territory, Occupied
Table 6: Thirty main citizenships of asylum applicants1) by destination country, 1st quarter 2011 (rounded figures)
(%)
France 14 335 22
Germany 12 035 18
Belgium 7 450 11
United Kingdom 6 360 10
Sweden 6 230 9
Other 19 515 30
(%) (%) (%)
Germany 1 890 33 France 1 125 27 Germany 1 565 41
Sweden 705 12 Poland 935 23 Netherlands 505 13
Belgium 675 12 Belgium 575 14 Belgium 485 13
Austria 520 9 Austria 495 12 Sweden 395 10
Netherlands 440 8 Germany 420 10 Austria 140 4
Other 1 530 27 Other 595 14 Other 705 19
(%) (%) (%)
Germany 1 660 44 France 1 290 42 United Kingdom 815 29
Belgium 805 21 Belgium 735 24 Greece 625 22
Sweden 545 14 Germany 460 15 Germany 355 13
Luxembourg 325 9 Sweden 320 10 France 295 11
France 200 5 Austria 80 3 Italy 230 8
Other 240 6 Other 200 7 Other 475 17
(%) (%) (%)
Germany 805 30 Italy 2 165 88 Sweden 805 34
United Kingdom 720 27 Germany 70 3 Netherlands 640 27
Netherlands 285 11 Austria 40 2 United Kingdom 200 8
Sweden 250 9 Sweden 40 2 Germany 180 8
Denmark 130 5 France 35 1 Belgium 110 5
Other 480 18 Other 125 5 Other 400 17
(%) (%) (%)
France 990 52 France 555 32 France 1 125 69
United Kingdom 565 30 Germany 485 28 Greece 120 7
Germany 140 7 Italy 215 12 United Kingdom 115 7
Netherlands 60 3 Austria 130 7 Belgium 85 5
Belgium 50 3 Belgium 110 6 Italy 55 3
Other 110 6 Other 245 14 Other 125 8
(%) (%) (%)
United Kingdom 320 20 Belgium 455 30 Belgium 585 39
Italy 225 14 Germany 450 29 France 575 38
Germany 215 14 France 345 23 Germany 75 5
France 210 13 Sweden 180 12 Netherlands 70 4
Sweden 120 8 Luxembourg 35 2 Greece 60 4
Other 470 30 Other 65 4 Other 150 10
(%) (%) (%)
France 820 55 France 545 37 France 400 28
Belgium 225 15 United Kingdom 285 20 Greece 295 21
Netherlands 140 9 Greece 140 10 Poland 245 17
Germany 80 5 Germany 115 8 Germany 110 8
Sweden 80 5 Belgium 100 7 Belgium 90 6
Other 145 10 Other 275 19 Other 305 21
(%) (%) (%)
France 965 68 Germany 555 45 France 440 39
Belgium 250 18 Belgium 110 9 Spain 205 18
United Kingdom 65 5 Sweden 110 9 Belgium 140 12
Germany 35 2 Denmark 100 8 Italy 105 10
Sweden 20 1 Greece 95 7 United Kingdom 60 5
Other 85 6 Other 275 22 Other 170 15
(%) (%) (%)
Sweden 395 35 France 325 35 Germany 210 31
France 190 17 Germany 145 15 United Kingdom 170 25
United Kingdom 180 16 United Kingdom 115 12 Austria 95 14
Germany 175 16 Austria 75 8 Belgium 55 9
Netherlands 95 9 Belgium 70 7 Cyprus 40 6
Other 80 7 Other 210 22 Other 100 15
(%) (%) (%)
France 205 34 Belgium 5 1 Sweden 225 40
Germany 165 27 Germany 0 United Kingdom 110 20
Sweden 100 17 Bulgaria 0 Austria 55 9
Netherlands 45 8 Czech Republic 0 Germany 45 8
Belgium 25 4 Denmark 0 France 35 7
Other 65 10 Other 590 99 Other 90 16
(%) (%) (%)
United Kingdom 215 39 Germany 255 54 France 115 28
France 165 29 United Kingdom 75 16 Belgium 75 19
Germany 55 9 Cyprus 60 13 United Kingdom 75 19
Netherlands 35 6 Sweden 40 8 Greece 70 17
Sweden 25 4 Slovakia 10 2 Sweden 35 8
Other 65 12 Other 30 7 Other 40 10
NON-EU
AFGHANISTAN - (AF)
PAKISTAN - (PK)
IRAN - (IR) TUNISIA - (TN) SOMALIA - (SO)
RUSSIA - (RU) IRAQ - (IQ)
SERBIA - (RS) KOSOVO / UNSCR 1244 - (XK)
SRI LANKA - (LK) TURKEY - (TR) BANGLADESH - (BD)
NIGERIA - (NG) MK - (MK) GUINEA - (GN)
ARMENIA - (AM) CHINA - (CN) GEORGIA - (GE)
CD - (CD) SYRIA - (SY) IVORY COAST - (CI)
ERITREA - (ER) ALGERIA - (DZ) INDIA - (IN)
AZERBAIJAN - (AZ)
ALBANIA - (AL)
HAITI - (HT) STATELESS - (STATELESS)
SUDAN - (SD) VIETNAM - (VN)
Notes:
1) Citizenships selected here are those with the highest number of asylum applicants registered during Q1 2011 in the EU-27 * represents 2 or fewer applicants recorded in the reference period
10 48/2011 — Statistics in focus
T
[image:10.595.116.469.54.745.2]a
ble 7: New
as
y
lum
applican
ts, Q1 2010 - Q1
2011 (r ounded figures) Jan , F eb . M ar. A p r. M ay Ju n . Ju l. A u g . S e p . O c t. No v . Dec. Jan . F eb . M ar. Q1 2011 Q4 20 10 to Q1 20 11 ch an g e i n % Q 1 201 0 t o Q1 20 11 ch an g e i n % A p plic an ts p e r m illi on in hab itants 1) Q1 20 11 L ast 1 2 m ont hs E U -2 7 : :::: ::: ::: ::: : : : : : : Be lg ium 1 240 2 4 8 0 1 520 1 155 1 26 0 1 325 1 550 1 96 5 2 250 2 460 2 24 0 2 165 1 870 1 840 2 3 0 0 6 0 1 0 -12 1 5 5 5 0 22 3 70 Bu lga ria :: ::: :::: ::: ::: : : : : : Cze c h R e public 30 35 55 40 3 5 35 20 3 5 25 20 2 0 40 30 3 0 40 1 0 5 3 1 -1 1 10 37 0 De nm a rk :: ::: :::: ::: ::: : : : : : Ge rm a n y 2 715 2 4 3 5 2 705 2 455 2 41 5 2 890 3 375 4 08 5 4 765 4 975 4 74 0 3 695 3 740 3 285 3 5 2 5 1 0 5 5 0 -21 3 4 1 3 0 43 9 50 Es tonia 5 5 5 5 * 5 5 * * * 5 5 5 1 5 27 5 1 5 0 1 0 40 Ir e land 190 1 7 5 165 160 1 8 0 155 160 17 0 150 140 15 5 120 135 125 1 2 5 3 8 5 -8 -2 8 85 1 7 70 G ree ce :: ::: :::: ::: ::: : : : : : Spai n 165 2 0 0 205 185 1 7 0 190 245 24 5 265 220 27 0 185 205 265 2 7 0 7 4 0 9 2 9 15 2 7 15 F ran ce 3 325 4 3 5 0 4 600 3 835 3 72 0 3 800 3 755 3 62 0 3 830 4 655 3 91 0 4 625 3 990 4 190 4 7 7 5 1 2 9 6 0 -2 6 2 0 0 48 7 10 Ita ly 1 010 6 7 5 1 035 730 9 4 5 975 815 51 5 815 870 1 04 0 635 590 1 625 1 7 7 5 3 9 8 5 5 7 4 7 65 11 3 20 Cy p rus 215 2 1 0 190 175 2 1 0 230 205 16 5 190 210 35 0 485 : : : : : : : : La tv ia * 5 * 1
0 5
5
5 5
5
5 5
5 5 2 0 5 2 5 5 6 2 1 3 1 0 80 Lithua nia 10 25 15 5 3 5 20 20 3 5 30 55 7 5 50 10 3 0 25 65 -6 3 3 4 20 39 0 Lux e m bour g : : 50 45 4 5 40 40 5 0 90 90 10 5 95 105 145 2 3 0 4 8 0 6 5 : 9 3 5 1 0 70 Hu ngar y :: ::: :::: ::: : 6 0 : : : : : : Ma lt a 25 5 10 1 0 * 40 1 0 10 10 1 0 15 10 1 5 30 50 40 6 3 1 1 5 16 5 Ne the rla nds 1 300 1 1 5 5 1 345 950 7 5 0 890 830 1 06 0 1 240 1 310 1 41 5 1 050 1 045 915 8 9 0 2 8 5 0 -24 -2 5 1 7 0 12 3 45 Au s tr ia :: ::: :::: ::: ::: : : : : : Pol a nd 310 3 3 0 315 285 2 8 5 290 280 46 0 505 415 37 5 485 125 260 3 3 0 7 1 5 -44 -2 5 20 4 0 90 Por tuga l 10 20 10 10 1 5 15 15 2 0 15 10 5 15 10 2 0 15 45 26 1 9 5 16 5 Ro ma nia :: ::: :::: ::: 4 5 8 5 1 2 0 2 5 0 : : 1 0 : Sl ov eni a 10 5 10 * 2 0 15 10 20 25 4 0 40 30 3 5 30 90 -9 2 0 7 45 26 0 Slo v aki a 25 10 25 40 3 5 40 20 3 0 35 25 1 5 15 15 2 5 10 50 -9 -1 5 10 30 5 Finl a nd :: ::: :::: ::: ::: : : : : : Sw ed en 2 225 2 3 3 0 3 565 2 150 1 87 0 1 910 1 895 2 73 5 3 880 4 190 2 83 0 2 220 1 960 1 955 2 3 0 0 6 2 2 0 -33 -2 3 6 6 0 29 9 05 Un ited K ingdom 1 725 1 8 0 0 1 875 1 855 1 74 0 1 865 1 780 1 75 5 1 925 2 020 2 04 0 1 685 2 040 1 890 2 1 4 0 6 0 7 0 6 1 2 95 22 7 35 Icel an d :: ::: :::: ::: ::: : : : : : Liechte n s tein :: ::: :::: ::: ::: : : : : : No rw a y :: ::: :::: ::: ::: : : : : : Sw itz e rl and 1 070 1 0 2 0 1 155 1 045 9 4 0 1 095 965 1 17 5 1 205 1 225 1 34 5 1 190 1 050 1 055 1 5 9 5 3 7 0 0 -2 1 4 4 7 0 13 8 85 1) R e lative to populat
ion as of
1
st of
J anu ary 2011 (p rovi s ional dat a).
* - repr
ese n ts 2 o r fe wer asy lum ap pl ic ant s rec o rded i n t he ref e rence pe riod. Q 1 201 1 Q 1 2 010 Q 2 20 10 Q 3 20 10 Q 4 20 10 Source
: Eurostat (online data code:
m
igr
_asyappctzm
Statistics in focus — 48/2011 11
Statistics on first instance decisions on asylum applications during the 1st
[image:11.595.72.486.121.398.2]quarter of 2011
Figure 6: First instance decisions by outcome, selected Member States1), 1st quarter 2011
Sw eden (6375 decisions)
7%
73%
3%
17%
France (9345 decisions)
9%
89%
2%
Germ any (11910 decisions)
79%
15% 1%
5%
Belgium (4890 decisions)
18%
77%
5%
UK (6335 decisions)
21%
71%
1%
7%
Netherlands (3910 decisions)
5%
16% 53%
26%
1) Member States selected here are those reporting the highest number of first instance decisions issued during Q1 2011. Note: UK – United Kingdom
Source: Eurostat (online data code: migr_asydcfstq)
Figure 7: First instance decisions in the EU-27 by outcome, selected citizenships1), 1st quarter 2011
Serbia (3715 decisions)
98%
1% 0% 1%
Iraq (3495 decisions)
32%
4% 47%
17%
Russia (3365 decisions)
82%
3%
1% 14%
Kosovo / UNSCR 1244 (3065 decisions)
94%
1%
2% 3%
Som alia (2670 decisions)
34%
42%
10%
14%
Afghanistan (4910 decisions)
56%
12%
20%
12%
1) Citizenships selected here are those for which the highest number of first instance decisions was issued during Q1 2011. Source: Eurostat (online data code: migr_asydcfstq)
[image:11.595.69.499.468.741.2]12 48/2011 — Statistics in focus Table 8: First instance decisions by citizenship and outcome, selected Member States1), 1st quarter 2011 (rounded figures)
Guinea 180 Iraq 100 XK 740 Iraq 655 Somalia 60 Afghanistan 420 Serbia 2 130
Iraq 140 Afghanistan 90 Russia 480 Iran 370 Afghanistan 30 XK 20 Afghanistan 1 105
Afghanistan 80 Somalia 10 Armenia 360 Afghanistan 175 Eritrea 20 Iraq 20 Iraq 655
Other 460 Other 20 Other 2 225 Other 595 Other 40 Other 130 Other 5 480
Russia 90 Mali 75 XK 855 Iran 40 Somalia 345 Somalia 270 Iraq 250
Sri Lanka 90 Guinea 40 Bangladesh 670 Iraq 35 Iraq 185 Iraq 75 Somalia 245
CD 80 Ivory Coast 25 Sri Lanka 625 Afghanistan 15 Afghanistan 115 Iran 65 Afghanistan 230
Other 610 Other 90 Other 6 095 Other 95 Other 390 Other 230 Other 1 325
Iraq 145 Somalia 545 Afghanistan 75 Serbia 760 Iran 270 Afghanistan 55 Iran 15 Pakistan 590
Iran 65 Afghanistan 215 XK 20 XK 375 Eritrea 165 Iran 40 Pakistan 5 Sri Lanka 470
Somalia 60 Eritrea 205 Stateless 20 Somalia 320 Sudan 155 Zimbabwe 40 Egypt 5 Iran 450
Other 195 Other 145 Other 80 Other 3 140 Other 765 Other 275 Other 15 Other 3 020
Russia 285 Afghanistan 485 Turkey 70 Russia 1 075 Iraq 1 130 Somalia 1 120 Afghanistan 590 Serbia 3 640
Afghanistan 205 Iraq 210 Afghanistan 50 Pakistan 685 Iran 930 Afghanistan 1 005 Somalia 280 XK 2 885
Iran 155 Somalia 135 Nigeria 45 Nigeria 670 Afghanistan 605 Iraq 590 Iraq 130 Russia 2 765
Other 645 Other 625 Other 465 Other 7 050 Other 4 160 Other 1 900 Other 1 095 Other 32 800
BELGIUM (4 890 decisions) GERMANY (11 910 decisions)
Refugee status Subsidiary protection
Humanitarian
reasons Rejections Refugee status
Subsidiary protection
Humanitarian
reasons Rejections
FRANCE (9 345 decisions) NETHERLANDS (3 910 decisions)
Refugee status Subsidiary protection
Humanitarian
reasons Rejections Refugee status
Subsidiary protection
Humanitarian
reasons Rejections
Refugee status Subsidiary protection
Humanitarian
reasons Rejections
Refugee status Subsidiary protection
Humanitarian
reasons Rejections Refugee status Subsidiary
protection
Humanitarian
reasons Rejections
Not applicable
Not applicable
OTHER (12 860 decisions) EU-27 (55 620 decisions)
SWEDEN (6 375 decisions) UNITED KINGDOM (6 335 decisions)
Refugee status Subsidiary protection
Humanitarian
reasons Rejections
1) Member States selected here are those with the highest number of first instance decisions issued during Q1 2011. Notes: XK – Kosovo / UNSCR 1244; CD – Congo, the Democratic Republic of the
Source: Eurostat (online data code: migr_asydcfstq)
Table 9: First instance decisions by outcome, 1st quarter 2011 (rounded figures)
Total decisions
Total positive decisions
Refugee status
Subsidiary protection
Humanitarian
reasons Rejected
EU-27 55 620 13 535 6 825 4 615 2 095 42 085
Belgium 4 890 1 080 860 220 - 3 810
Bulgaria 115 35 * 35 - 80
Czech Republic 210 125 20 100 5 85
Denmark 830 275 125 90 60 555
Germany 11 910 2 540 1 795 155 590 9 370
Estonia 15 5 * 5 10
Ireland 395 15 15 * - 380
Greece 1 345 75 20 55 * 1 265
Spain 800 180 80 95 5 620
France 9 345 1 095 870 230 - 8 250
Italy1) 3 235 1 100 280 365 455 2 135
Cyprus 495 10 * 10 485
Latvia 15 5 * 5 - 10
Lithuania 65 5 * 5 - 60
Luxembourg 230 10 10 * - 220
Hungary 165 35 15 20 5 130
Malta 35 15 5 10 * 20
Netherlands 3 910 1 855 185 1 035 640 2 050
Austria 3 240 1 035 600 435 - 2 205
Poland 750 105 35 25 45 650
Portugal 20 20 5 15 - 5
Romania 105 25 20 5 80
Slovenia 35 5 * * - 30
Slovakia 45 25 20 5 20
Finland 725 275 55 180 40 450
Sweden 6 375 1 775 470 1 110 200 4 600
United Kingdom 6 335 1 805 1 350 415 40 4 530
Iceland : : : : : :
Liechtenstein 5 * * - 5
Norway 3 295 1 310 1 020 195 100 1 980
Switzerland 3 495 1 380 710 290 385 2 110
1) See country information notes. - represents data are not applicable
* represents 2 or fewer first instance decisions recorded in the reference period : represents data are not available in the reference period
Statistics in focus — 48/2011 13 Table 10: First instance decisions by destination country and outcome, selected citizenships of asylum applicants1), 1st quarter 2011 (rounded figures)
Belgium 25 Belgium * Denmark 15 Germany 2 130 Germany 175 Sweden 215 Germany 420 Germany 1 105
France 10 Bulgaria * Germany 5 Sweden 760 Austria 140 Austria 200 Sweden 75 UK 410
Austria 5 Czech Repu * Italy 5 Belgium 310 Belgium 80 Italy 150 Netherlands 40 Netherlands 230
Other * Other * Other * Other 440 Other 210 Other 440 Other 50 Other 965
Germany 130 Sweden 545 Netherlands 270 Sweden 320 Austria 200 Austria 50 Germany 15 France 545
UK 95 Netherlands 345 Sweden 5 Netherlands 245 France 90 Poland 20 Poland 15 Belgium 480
Sweden 60 Germany 60 Italy 5 Germany 110 Belgium 45 Finland 20 Estonia 5 Poland 450
Other 75 Other 170 Other * Other 235 Other 130 Other 15 Other * Other 1 285
Germany 655 Netherlands 185 Netherlands 75 Germany 655 Belgium 55 Austria 10 Sweden 20 France 855
Sweden 145 Belgium 100 Germany 20 Sweden 255 France 25 Italy 5 Germany 20 Belgium 740
Belgium 140 Finland 85 Sweden 15 Netherlands 250 Italy 5 Sweden 5 Italy 10 Germany 570
Other 190 Other 220 Other 25 Other 485 Other * Other * Other * Other 715
UK 1 185 Netherlands 390 Italy 410 France 6 640 Germany 1 795 Sweden 1 110 Netherlands 640 Germany 9 370
Germany 805 UK 340 Netherlands 250 Germany 4 480 UK 1 350 Netherlands 1 035 Germany 590 France 8 250
France 655 Sweden 270 Germany 105 UK 3 880 France 870 Austria 435 Italy 455 Sweden 4 600
Other 1 495 Other 770 Other 205 Other 12 535 Other 2 805 Other 2 040 Other 410 Other 19 870
SERBIA - (RS) AFGHANISTAN - (AF)
Refugee status Subsidiary protection
Humanitarian
reasons Rejections Refugee status
Subsidiary protection
Humanitarian
reasons Rejections
SOMALIA - (SO) RUSSIA - (RU)
Refugee status Subsidiary protection
Humanitarian
reasons Rejections Refugee status
Subsidiary protection
Humanitarian
reasons Rejections
IRAQ - (IQ) KOSOVO / UNSCR 1244 - (XK)
Refugee status Subsidiary protection
Humanitarian
reasons Rejections Refugee status
Subsidiary protection
Humanitarian
reasons Rejections
OTHER NON-EU
Refugee status Subsidiary protection
Humanitarian
reasons Rejections Refugee status
Subsidiary protection
Humanitarian
reasons Rejections
1) Citizenships selected here are those with the highest number of first instance decisions issued during Q1 2011. * – represents 2 or fewer first instance decisions recorded in the reference period.
Note: UK – the United Kingdom
[image:13.595.63.535.370.701.2]Source:: Eurostat (online data code: migr_asydcfstq)
Table 11: First instance decisions by outcome, 30 main citizenships of asylum applicants1) in the EU-27, 1st quarter 2011 (rounded figures)
Total decisions
Total positive decisions
Refugee status
Subsidiary protection
Humanitarian
reasons Rejected
Non-EU 55 620 13 535 6 825 4 615 2 095 42 085
Afghanistan - (AF) 4 910 2 195 605 1 005 590 2 710
Serbia - (RS) 3 715 80 35 5 35 3 640
Iraq - (IQ) 3 495 1 850 1 130 590 130 1 645
Russia - (RU) 3 360 600 465 105 30 2 765
Kosovo - (XK) 3 065 180 95 25 60 2 885
Somalia - (SO) 2 670 1 765 365 1 120 280 905
Iran - (IR) 2 525 1 160 930 130 100 1 365
Pakistan - (PK) 1 995 250 120 95 30 1 745
Sri Lanka - (LK) 1 750 355 275 40 40 1 395
Nigeria - (NG) 1 630 145 35 50 65 1 485
Turkey - (TR) 1 560 245 145 25 75 1 315
China - (CN) 1 420 220 140 65 20 1 200
MK - (MK) 1 305 20 5 5 10 1 290
Armenia - (AM) 1 245 90 30 25 35 1 155
Bangladesh - (BD) 1 195 35 15 15 5 1 160
Syria - (SY) 1 055 295 235 20 40 765
Guinea - (GN) 1 050 345 240 80 20 705
Eritrea - (ER) 1 045 735 355 340 40 310
CD - (CD) 855 195 140 30 20 660
Georgia - (GE) 850 25 10 5 10 825
Algeria - (DZ) 795 30 20 5 * 765
India - (IN) 600 5 5 * * 595
Sudan - (SD) 535 250 215 30 5 285
Stateless 530 215 120 75 25 315
BA - (BA) 500 15 5 5 5 485
Tunisia - (TN) 485 20 10 * 10 465
Azerbaijan - (AZ) 465 85 50 5 25 385
Haiti - (HT) 440 45 30 15 * 395
Mongolia - (MN) 435 25 5 5 15 410
Mauritania - (MR) 405 30 20 5 5 375
Other 9 730 2 040 975 685 375 7 695
1) Citizenships selected here are those with the highest number of first instance decisions issued during Q1 2011.
Notes:Kosovo – Kosovo / UNSCR 1244; MK – the former Yugoslav Republic of Macedonia; CD – Congo, the Democratic Republic of the; BA – Bosnia and Herzegovina.
14 48/2011 — Statistics in focus
METHODOLOGICAL NOTES
DATA SOURCES
The data used for this publication are provided to Eurostat by the Ministries of Interior, Justice or immigration agencies of the Member States. Data are based entirely on relevant administrative sources. Apart from statistics on new asylum applicants, these data are supplied by Member States according to the provisions of Article 4 of the Regulation (EC) 862/2007 of 11 July 2007 on Community statistics on migration and international protection.
All data presented in this publication are rounded to the nearest 5.
All data presented in this publication are provisional (except as otherwise stated) and may be a subject to change.
DEFINITIONS AND COVERAGE
'Asylum applicant' means a person having submitted an application for international protection or having been included in such application as a family member during the reference period. 'Application for
international protection' means an application for international protection as defined in Art.2(g) of Council
Directive 2004/83/EC, i.e. including requests for refugee status or for subsidiary protection status,
irrespective of whether the application was lodged on arrival at border, or from inside the country, and irrespective of whether the person entered the territory legally (e.g. as a tourist) or illegally. In deciding when to regard an asylum application as having been lodged, the principles expressed in Article 4(1) of Council Regulation 2003/343/EC should be applied, i.e. 'An application for asylum shall be deemed to have been lodged once a form submitted by the applicant for asylum or a report prepared by the authorities has reached the competent authorities of the Member State concerned. Where an application is not made in writing, the time elapsing between the statement of intention and the preparation of a report should be as short as possible'. Applications submitted by persons who are subsequently found to be a subject of a Dublin procedure (Council Regulation (EC) No 343/2003) are included in the number of asylum applications. Within the same reference period every person being a subject of asylum application is counted only once, therefore repeat applications are not recorded if the first application has been lodged in the same reference period. However, such a repeat application will be recorded if lodged in a different reference month. It means that the aggregation of the monthly figures may overestimate the number of persons applying for international protection within the aggregated period (quarter or year).
In some Member States (e.g. IT, MT) due to restrictions of the asylum procedure (e.g. time limits for lodging repeat application) repeat applications may be very rare. Therefore the number of new asylum applicants may equal or almost equal the number of asylum applicants.
The number of asylum applicants and the number of first instance decisions during the same reference period differs. This is due to the time lag between the date of asylum application and the date of the decision on asylum application. The duration of this time lag may vary considerably depending on the national asylum procedure and the administrative workload. Asylum application lodged in one reference period may therefore result in a decision in a later period, while some asylum decisions reported for that period may relate to the applications lodged in previous reference periods.
'New asylum applicant' means a person having submitted an application for international protection for the first time. Applications submitted by persons who are subsequently found to be a subject of a Dublin procedure are included in the statistics on new asylum applicants if such persons are also a subject of first asylum application. All Member States are requested to supply these data but their provision is voluntary. As persons are counted once only, statistics on new asylum applicants may be used for preparation of annual aggregates.
Statistics in focus — 48/2011 15 'Rejected applicant' means a person covered by a first instance decision rejecting an application for
international protection, including decisions considering applications as inadmissible or as unfounded and decisions under priority and accelerated procedures, taken by administrative or judicial bodies during the reference period.
'Person granted refugee status at first instance' means a person covered by a first instance decision granting refugee status, taken by administrative or judicial bodies during the reference period. Refugee status means status as defined in Art.2 (d) of Directive 2004/83/EC within the meaning of Art.1 of the Geneva Convention relating to the Status of Refugees of 28 July 1951, as amended by the New York Protocol of 31 January 1967. According to the Art.2(c) of that Directive refugee means a third country national who, owing to a well-founded fear of being persecuted for reasons of race, religion, nationality, political opinion or membership of a particular social group, is outside the country of nationality and is unable or, owing to such fear, is unwilling to avail himself or herself of the protection of that country, or a stateless person, who, being outside of the country of former habitual residence for the same reasons as mentioned above, is unable or, owing to such fear,
unwilling to return to it.
'Person granted subsidiary protection status at first instance' means a person covered by a first instance decision granting subsidiary protection status, taken by administrative or judicial bodies during the reference period. Subsidiary protection status means status as defined in Art.2 (f) of Directive 2004/83/EC. According to the Art.2(e) of that Directive a person eligible for subsidiary protection means a third country national or a stateless person who does not qualify as a refugee but in respect of whom substantial grounds have been shown for believing that the person concerned, if returned to his or her country of origin, or in the case of a stateless person, to his or her country of former habitual residence, would face a real risk of suffering serious harm and is unable, or, owing to such risk, unwilling to avail himself or herself of the protection of that country.
Person granted authorisation to stay for humanitarian reasons at first instance' means a person covered by another first instance decision granting authorisation to stay for humanitarian reasons under national law concerning international protection,
taken by administrative or judicial bodies during the reference period. It includes persons who are not eligible for international protection as currently defined law but are nonetheless protected against removal under the obligations that are imposed on all Member States by international refugee or human rights instruments or on the basis of principles flowing from such instruments. Examples of such categories include persons who are not removable on ill health grounds and unaccompanied minors.
'Dublin procedure' means a procedure according to the Council Regulation (EC) No 343/2003, establishing the criteria and mechanisms for determining the Member State responsible for examining an asylum
application lodged in one of the Member States by a third-country national.
COUNTRY INFORMATION
The number of rejections at first instance in Italy includes a number of recommendations to issue an authorization to stay for humanitarian reasons. These recommendations are issued by the National Asylum Commission to the Police. Such recommendation does not guarantee the grant of an authorization to stay for humanitarian reason, and therefore the number of first instance rejections is overestimated. Indeed, some individuals might be counted twice under the same reference period: first as a person rejected and
recommended for an authorisation to stay for humanitarian reasons and subsequently as a person granted an authorisation to stay for humanitarian reasons.
ABBREVIATIONS
Belgium (BE), Bulgaria (BG), Czech Republic (CZ), Denmark (DK), Germany (DE), Estonia (EE), Ireland (IE), Greece (EL), Spain (ES), France (FR), Italy (IT), Cyprus (CY), Latvia (LV), Lithuania (LT), Luxembourg (LU), Hungary (HU), Malta (MT), the Netherlands (NL), Austria (AT), Poland (PL), Portugal (PT), Romania (RO), Slovenia (SI), Slovakia (SK), Finland (FI), Sweden (SE), the United Kingdom (UK), Iceland (IS), Lichtenstein (LI), Norway (NO) and Switzerland (CH).
EU ASYLUM POLICY
The Directorate-General for Home Affairs (DG HOME) is responsible for developing EU policies on asylum. For more information please see:
Further information
Eurostat Website: http://ec.europa.eu/eurostat
Data on ‘Population’
http://epp.eurostat.ec.europa.eu/portal/page/portal/population/data/database
Further information about ‘Population’
http://epp.eurostat.ec.europa.eu/portal/page/portal/population/introduction
Journalists can contact the media support service:
Bech Building, Office A4/125, L-2920 Luxembourg Tel.: (352) 4301 33408
Fax: (352) 4301 35349
E-mail: eurostat-mediasupport@ec.europa.eu
European Statistical Data Support:
With the members of the ‘European statistical system’, Eurostat has set up a network of support centres in nearly every Member State and in some EFTA countries.
Their role is to provide help and guidance to Internet users of European statistics.
Contact details for this support network can be found on the Eurostat website at:
http://ec.europa.eu/eurostat/.
All Eurostat publications can be ordered via the ‘EU Bookshop’:
http://bookshop.europa.eu/.
Manuscript completed on: 20.09.2011 Data extracted on: 08.07.2011 ISSN 1977-0316