PRIMARY STRUCTURE STUDY OF PHOSPHOFRUCTOKINASE FROM
Streptococcus lactis
A thesis presented fulfilment of the
requirement for the degree of Master of Science in Biochemistry at
MASSEY UNIVERSITY
QIAN XIAO
ABSTRACT
Phosphofructokinase is an important regulatory enzyme in the glycolytic pathway catalysing the
phosphorylation of Fructose-6-phosphate to Fructose-1,6-bisphosphate.
Phosphofructokinase from Streptococcus lactis was
isolated by chromatographic methods including DEAE Cellulose ion-exchange and Cibacron Blue Sepharose dye-ligand chromatographies.
Phosphofructokinase from Streptococcus lactis was
digested with trypsin, chymotrypsin, Staphylococcus aureus VS protease and CNBr and the peptides obtained
were sequenced and aligned against the sequences of
Escherichia coli and Bacillus stearothermophilus
phosphofructokinases.
326 out of 328 amino acid residues of
Streptococcus lactis phosphofructokinase were obtained
in this study.
The comparison of Streptoccus lactis
phosphofructokinase with Escherichia coli and Bacillus stearothermophilus phosphofructokinases showed that the
sequence similarities among them are above 50%.
Most of the secondary structures are conserved in
Streptococcus lactis phosphofructokinase. The two~-helices at the carboxyl terminal of bacterial
phosphofructokinases are longer in Streptococcus lactis than in Escherichia coli and Bacillus
stearothermophilus.
The residues involved in binding of Fructose-6-phosphate/Fructose-1,6-bisphosphate are the same in the bacterial phosphofructokinase and the residues involved in binding of ATP/ADP and binding of effectors have high degree of similarity.
ACKNOWLEDGEMENTS
I am sincerely grateful to my respected supervisor, Dr. C.H. Moore, for his support and
encouragement throughout this study. His great help and invaluable advice are much appreciated.
I would also like to thank:
Mr.J.R. Reid for running the amino acid analyser and the gas-phase sequencer. Dr.B.F. Anderson for assistance in using the
computer program FRODO.
Dr.G.G. Midwinter and Prof. E.N. Baker for their comments on interpretation of the secondary structure of S. lactis PFK. Dr.G.G. Prichard for providing the starter
cultures.
The staff of the Biochemical Processing Centre, DSIR for growing the bacteria in the Fermacell fermentor.
The help of other staff in the Department of Chemistry and Biochemistry is appreciated.
Finally I wish to thank my husband Ruoquan for his encouragement during this study and his assistance in preparing this manuscript and also to thank my parents for their consistent concern, support and encouragement.
ADP
AMP
ATP
bis acrylamide .BME BS BSA cAMP DEAE DNA EC EDTA F6P Fl,6BP FPLC Hpr NADH PEP PEP-PTS PFK p PTH RPLC SL SDS-PAGE
LIST OF ABBREVIATIONS
adenosine 5'-diphosphate adenosine 5'-monophosphate adenosine 5'-triphosphate N'N-methylene-bis-acrylamide .B-mercaptoethanol
Bacillus stearothermophilus
bovine serum albumin cyclic-AMP
diethyl amino ethyl deoxyribonucleic acid Escherichia coli
ethylenediamine tetra acetic acid fructose-6-phosphate
fructose-1,6-bisphosphate
Fast protein liquid chromatography heat stable protein in PEP-PTS nicotinamide adenine dinucleotide, reduced form
phosphoenolpyruvate
phosphoenolpyruvate phosphotransferase system
phosphofructokinase inorganic phosphate phenylthiohydantoin
Reverse-phase liquid chromatography
Streptococcus lactis
sodium dodecyl sulphate-polyacrylamide gel electrophoresis
TFA TPCK
Tris
tetrafluoro acetic acid
L-l-tosylamide-2-phenylethyl chloromethyl ketone
tris (hydroxymethyl) aminomethane
VII
AMINO ACID ABBREVIATIONS
Alanine Ala A
Arginine Arg R
Asparagine Asn N
Aspartic acid Asp D
Cysteine Cys C
Glutarnic acid Glu E
Glutarnine Gln Q
Glycine Gly G
Histidine His H
Isoleucine Ile I
Leucine Leu L
Lysine Lys K
Methionine Met M
Phenylalanine Phe F
Praline Pro p
Serine Ser
s
Threonine Thr T
Tryptophan Trp w
Tyrosine Tyr y
TABLE OF CONTENTS
ABSTRACT
ACKNOWLEDGEMENTS
LIST OF ABBREVIATIONS AMINO ACID ABBREVIATIONS TABLE OF CONTENTS
LIST OF FIGURES LIST OF TABLES
CHARTER 1 INTRODUCTION
1.1 GENERAL INTRODUCTION
1.2 1.3 1.4 CHAPTER 2
2.1
1.1.1 General Background of
Phosphofructokinase
1.1.2 Structural aspects of PFK
1.1.3 Regulation of PFK activity
LACTOSE METABOLISM IN
s.
lactis DETERMINATION OF THE AMINO ACID AIMSMATERIALS AND METHODS MATERIALS
2·.1.1 Enzymes
2.1.2 Materials for bacterial
culture Page ii vi V vii viii xiv xvii 1 1 1 2 4 6 10 21 23 23 23 23
2.1.3 Chemicals used for SDS-PAGEs 23
2.1.4 Others 23
2.2 METHODS 24
2.2.1 Tris/glycerol buffer 24
2.2.2 Preparation of Cibacron Blue
Sepharose resin 24
2.2.3 Assay systems for measuring
PFK activity 25
2.2.4 Protein level determination 27 2.2.4.1 Biuret method 27 2.2.4.2 Modified Lowry method 27 2.2.4.3 Coomassie Blue dye
binding method 2.2.5 SDS polyacrylamide gel
electrophoresis (SDS PAGE) 2.2.6 Amino acid analysis
2.2.7 Amino terminal sequencing 2.2.8 FAB Mass Spectrometric
analysis
2.2.9 Tryptic digestion
2.2.10 Chymotryptic digestion 2.2.11 S. aureus VS protease
27
27 30 30
31 32 33
digestion 33
2.2.12 CNBr digestion 33
2.2.13 Separation of CNBr peptides by gel filtration
chromatography on the Fast Protein Liquid Chromatography (FPLC) apparatus
2.2.14 Separation of S. aureuse VS protease digested PFK peptides on G-50 Sephadex gel
filtration column
34
CHAPTER 3
2.2.15 Separation of peptides on
Reverse Phase Liquid Chromatography (RPLC)
RESULTS
ISOLATION OF PFK FROM
s.
lactis3.1 GROWTH OF S. lactis
3.2 PFK ISOLATION PROCEDURE
3.3 PFK ISOLATION RESULTS AND
DISCUSSION
CHAPTER 4 RESULTS
PRIMARY STRUCTURE ANALYSIS OF
PFK FROM
s.
lactis35
37 37
38
40
50
4.1 AMINO ACID ANALYSIS OF SL PFK 50
4.2 AMINO TERMINAL SEQUENCE OF SL PFK 53
4 .3 TRYPTIC PEPTIDES ANALYSIS 54
4.3.1 Tryptic peptides separation
4.3.2 Analysis of fractions collected from the RPLC
separation of tryptic
peptides
4.3.2.1 Results of fraction
1 analysis
4.3.2.2 Results of fraction
2 analysis
4.3.2.3 Results of fraction
3 analysis
4.3.2.4 Results of fraction
4 analysis
54
54
57
57
57
XI
4.3.2.5 Results of fraction
5 analysis 59
4.3.2.6 Results of fraction
6 analysis 59
4.3.2.7 Results of fraction
7 analysis 59
4.3.2.8 Results of .fraction
8 analysis 60
4.3.2.9 Results of fraction
9 analysis 62
4.3.2.10 Results of fraction
10 analysis 62
4.3.2.11 Results of fraction
11 analysis 62
4.3.2.12 Results of fraction
12 analysis 63
4.3.2.13 Results of fraction
13 analysis 63
4.3.2.14 Results of fraction
14 analysis 63
4.3.2.15 Results of fraction
lla analysis 65
4. 3. 3 Amino acid composition
and mass spectrometric
analysis results of the
tryptic peptides 65
4. 3. 4 Alignment of SL PFK tryptic
peptides against the
sequences of BS and EC PFKs 68
4.5
4.6
CHAPTER 5
5.1
4.4.1 CNBr peptides mapping 70
4.4.2 Amino terminal analysis of
the CNBr peptides 70
4.4.3 Analysis of fraction 1 70
4.4.4 Analysis of fraction 2 74
4.4.4.1 Separation of CN3,CN4 and
CN6
4.4.4.2 Treatment of CN3
4.4.4.3 Treatment of CN4
4.4.4.4 Treatment of CN6
4.4.5 Analysis of fraction 3
4.4.6 Alignment of SL PFK CNBr
peptides against EC and
BS PFKs
CHYMOTRYPTIC DIGESTION
S. aureus VS PROTEASE DIGESTION
DISCUSSION
SEQUENCE STUDY OF
s.
lactis PFK5.1.1 General discussion
5.1.2 Tryptic digestion (3.4)
74 75 77 78 78 79 81 87 92 92 92 94
5.1.3 CNBr digestion (3.5) 95
5.1.4 Chymotryptic digestion (3.6) 96
5.2 STRUCTURAL COMPARISON OF PFKs
FROM DIFFERENT SOURCES
5.2.1 Sequence similarities among
PFKs from B. stearothermophilus,
E. coli and S. lactis
97
97
5.2.2 Secondary structure
similarities of PFKs from S. lactis, E. coli and B. stearothermophilus 5.2.3 Tertiary and quaternary
100
structure of bacterial PFKs 105 5.2.4 Comparison of the active
site of bacterial PFKs 5.2.4.1 F6P/Fl,6BP binding
108
site 108
5.2.4.2 ATP/ADP binding site 111 5.2.5 Comparison of the effector
binding site of bacterial PFK 113 5.2.6 Comparison of the subunit
interaction in bacterial PFKs 116
REFERENCE 119
Fj.gure 1
Figure 2
Figure 3
Figure 4
Figure 5
Figure 6
Figure 7
Figure 8
Figure 9
LIST OF FIGURES
Lactose metabolism in S. lactis
Phosphoenol pyruvate
phosphotransferase system for lactose transfer in S. lactis
CNBr cleavage of protein
Edman degradation mechanism
Glycerol-3-phosphate dehydrogenase assay system
SL PFK isolation procedure
DEAE Cellulose Column elution profile
Cibacron Blue Column (I) elution profile
Cibacron Blue Column (II) elution profile
Figure 10 SDS-PAGE of PFK isolation results
Figure 11 Time-dependancy of amino acids during hydrolysis
Figure 12 Tryptic peptide mapping on RPLC
Figure 13 Purification of RPLC fraction 1 of tryptic peptides
Figure 14 Purification of RPLC fraction 3 of tryptic peptides
Figure 15 Mass spectrometry analysis of T4
Figure 16 Purification of RPLC fraction 5 of
tryptic peptides
F~' gure 17 Purification of RPLC fraction 6 of tryptic peptides
Figure 18aPlot of log(pmoles) against cycle
number for T14 and T16
Figure 18 Purification of RPLC fraction 7 of tryptic peptides
Figure 19 Purification of RPLC fraction 8 of tryptic peptides
Figure 20 Purification of RPLC fraction 9 of tryptic peptides
Figure 21 Purification of RPLC fraction 10 of
tryptic peptides
Figure 22 Purification of RPLC fraction 11 of typtic peptides
Figure 23 Purification of RPLC fraction 12 of tryptic peptides
Figure 24 Purification of RPLC fraction 13 of tryptic peptides
Figure 25 Plot of log(pmoles) against cycle number of T7 analysis on sequencer
Figure 26 Separation of T7-1 and T7-2 on RPLC
Figure 27 Alignment of tryptic peptides of SL PFK against the sequences of EC and BS PFKs
Figure 28 CNBr peptides mapping on FPLC
Figure 29 Separation of CN3, CN4 and CN6 on RPLC
Figure 30 Alignment of CNBr peptides of SL PFK against the sequences of EC and BS PFKs
Figure 31 Chymotryptic peptide mapping on RPLC
Figure 31aAlignment of chymotryptic peptides of SL PFK against the sequences of EC and BS PFKs
Figure 32 Separation of S. aureus VS protease digested SL PFK on G-50 gel
filtration column
Figure 33 RPLC separation of water-soluble material from G-50 elution
Figure 34 RPLC separation of formic
acid-soluble material from G-50 elution
Figure 35 The sequence of SL PFK
Figure 36 Comparison of the sequences of EC, BS and SL PFKs
Figure 37 Schematic view of two subunits in the EC PFK tetramer
Figure 38 Computer-graphic view of two subunits of EC PFK tetramer from the
computer program FRODO showing the binding of the substrates Figure 39 Computer-graphic view of two
subunits of EC PFK tetramer from the
computer program FRODO showing the binding of effctors
Figure 40 Computer-graphic view of EC
PFK tetramer from the computer program FRODO
Figure 41 Computer-graphic view of two
subunits of EC PFK from the
computer program FRODO highlighting the ~-helices which are different in amino acid sequence in PFKs from SL and BS and EC
Figure 42 Simplified binding scheme at EC PFK
effector site
Figure 43 Computer-graphic view of the
effector site of EC PFK from the
computer program FRODO showing the possiblity that Lys211 replaces Arg54 in function
XVI
106
107
107
115
LIST OF TABLES
Table 1: Typical results of the isolation of SL PFK
Table 2: Amino acid content of bacterial PFKs
Table 3: Tryptic peptide characterisation
Table 4: Amino terminal sequences of CNBr peptides
Table 5: Subpeptides of CNS digested with
S. aureus VS protease
Table 6: Subpeptides of CNS digested with trypsin
Table 7: Subpeptides of CN3 digested with trypsin
Table 8: Subpeptides of CN4 digested with trypsin
Table 9: Subpeptides of CN6 digested with trypsin
Table 10: Characterisition of chymotryptic peptides
Table 11: Similarities among bacterial PFKs
Table 12: The most commonly occurring amino acid interchanges between BS PFK and SL PFK
Table 13: The most commonly occurring amino acid interchanges between EC PFK and SL PFK
Table 14: Conservative and strictly
conservative interchanges between SL and BS PFKs
Table 15: Conservative and strictly
conservative interchanges between SL and EC PFKs
Table 16 Secondary structure elements of bacterial PFK
Table 17: Comparison of the residues forming ol-8 in EC, BS and SL PFKs
Table 18: Comparison of the residues forming
Dl-9 in EC, BS and SL PFKs
Table 19: Site ·A: F6P/Fl,6BP binding site
Table 20: Site B: ADP/ATP binding site
Table 21: Site C: effector binding site
Table 22: Residues involved in subunit
association in bacterial PFKs
XVIII
112
114
CHAPTER ONE: INTRODUCTION
1.1 GENERAL INTRODUCTION
1.1.1 General Background of Phosphofructokinase
Phosphofructokinase
(ATP:D-frutose-6-phosphate-1-phosphotransferase, EC 2.7.1.11) catalyses the transfer
of the Y-phosphate group of ATP to the C-1 hydroxyl
group of 6-phosphate (F6P) to form
fructose-1,6-bisphosphate Fl,6BP) and ADP as shown below:
ATP ADP
OH
~
L
..
H OH
Fructose-6-phosphate
Fructose-!, 6-bisphosphate
This reaction is involved in the glycolytic pathway of
all organisms. In 1936, the first report of PFK in
glycolysis was published (Negelein, 1936). Since then,
great effort has been concentrated on the study of PFK
from various sources and the knowledge of the function,
the structure, the reaction mechanism and the regulatory
properties of PFK has been expanded.
The conversion of F6P to Fl,6BP is catalysed by
PFK while the reverse reaction is catalysed by
fructose-1,6-bisphosphate (Fl,6BP) phosphatase. This division of
the reaction between two enzymes in the metabolic
pathway enables the reaction to be easily controlled by
for energy and for metabolic intermediates provided by
the glycolytic pathway.
1.1.2 Structural aspects of PFK
PFK has been isolated and studied from various
sources, including bacteria, plants, yeast and animals
(Mansour, 1972; Ramaiah, 1975; Hofmann, 1976; Goldhammer
and Paradies, 1979; Uyeda, 1979). A common feature of
the PFKs from different biological origins is their
tetrameric structure although their molecular weights
are quite different (Rutherfurd, 1988). The PFKs from
different bacteria are similar in their primary sequence
and their secondary, tertiary and quarternary structures
(Shirahara and Evans, 1988). The primary structure of
mammalian PFKs has an internal homology and is similar
to that of bacterial PFKs, which suggests that they
evolved by duplication of an ancestral gene now
represented by the bacterial PFK (Poorman et al., 1984) .
The subunit molecular weight of mammalian PFKs is
about 85, 000 (Uyeda, 1979). While the smallest active
form of mammalian PFKs is the tetramer structure, the
enzymes are capable of aggregating to form the more
active high molecular weight multimeric structures
(Paetkau and Lardy, 1967; Layzer et al., 1969; Kemp,
1971; Tarui etal., 1972; Massey and Deal, 1973; Dunaway,
1974; Brand and Soling, 1974; Trujillo and Deal, 1977;
Reinhart and Lardy, 1980; Foe and Kemp, 1985).
Yeast PFKs have subunit molecular weight of about
100,000 (Kopperschlager et al., 1977). They consist of two non-identical subunits
a
and B, differentiated by their antigenic properties (Herrmann et al., 1973). The enzymes can form high molecular weight multimers the same as the mammalian enzymes, but they do not undergo the association and dissociation that occurs inmammalian enzymes.
Plant PFKs have a subunit molecular weight of
about 80,000 (Glodhammer and Paradies, 1979). They have similar regulatory properties to the PFKs from animals and bacteria and they may have homology to the enzymes from animals and bacteria.
Bacterial PFKs have a subunit molecular weight of 35,000 (Blangy, 1968; Hengartner and Harris, 1975; Uyeda and Kurooka, 1970). Unlike the eukaryotic PFKs, they do not aggregate to form structures higher than tetrarners. The known primary, secondary, tertiary and quarternary structures of Escherichia coli (Shirakihara and Evans, 1988) and Bacillus stearothermophilus (Evans and Hudson 1979) PFKs are similar. Four subunits, each of which is divided into two domains, are arranged in a way that one contacts with only two of the others. The enzyme has three sites which bind the substrates F6P and ATP and effectors. The F6P binding site sits between two
subunits of the tetramer while the allosteric effector binding site sits between another pair of subunits. These ligand bridges between subunits mediate the substrate cooperativity and the allosteric control.
The cooperativity and the allosteric control of the EC PFKs are explained well by the two-state
concerted allosteric model described by Monod et al
(1965), that is the transition between the conformations of active R-state and the inactive T-state (Evans et al, 1981) and this is based on the conclusions of Blangy et al (1968) that the enzyme's two states have different affinity for F6P but the enzyme does not change the catalytic rate once the substrate binds to the enzyme.
1.1.3 Regulation of PFK activity
Eukaryotic PFKs and prokaryotic PFKs are
allosterically controlled and the binding of substrate F6P shows cooperativity. Although enzymes from
different sources have their particular ways of
regulation, the following features are conserved
(Fordyce, 1982):
i. Enzyme activity has a sigmoidal dependence on F6P concentration.
ii. Enzyme activity changes with the energy
requirements of the cell, increasing when ATP is required.
iii. Enzyme activity has a feedback inhibition by the intermediates in the carbohydrate metabolic pathways. These intermediates are citrate in mammals and phosphoenol pyruvate (PEP) in bacteria.
The way by which the effectors regulate PFK
activity is to alter the affinity of the enzyme for
substrate F6P. The inhibitors decrease the affinity and
the activators increase the affinity. The eukaryotic
PFKs are inhibited by citrate and ATP and activated by
phosphate, AMP, and cAMP; while the bacterial PFKs are
inhibited by PEP and activated by ADP. The mammalian
PFKs are also subjected to hormonal regulation through
phosphorylation/dephosphorylation (Brand and Soling,
1975; Hussey et·al., 1977). For example, the rabbit
muscle PFK is activated by phosphorylation catalysed by
a cyclic 3' ,5'-AMP-independent kinase and inactivated by
a phosphatase catalysed dephosphorylation and these two
enzymes are subjected to hormonal control. The
mammalian PFK can self-associate to an oligomeric form
larger than the active tetramer giving i t a higher
affinity for the substrate F6P and the
association/dissociation transition changes with a
variety of factors such as the enzyme concentration, the
level of metabolic effectors and the pH (Rutherfurd,
1988). The regulation of bacterial PFKs is relatively
simple. They are only regulated allosterically and the
number of effectors is less than that for eukaryotic
PFKs. They are not activated by AMP and not inhibited
by either citrate or ATP.
1.2 LACTOSE METABOLISM INS. lactis
S. lactis can utilize lactose in milk to form lactic acid so that milk pH drops and as a result, milk proteins precipitate to start cheese formation and thus it takes an important role in New Zealand cheese
production.
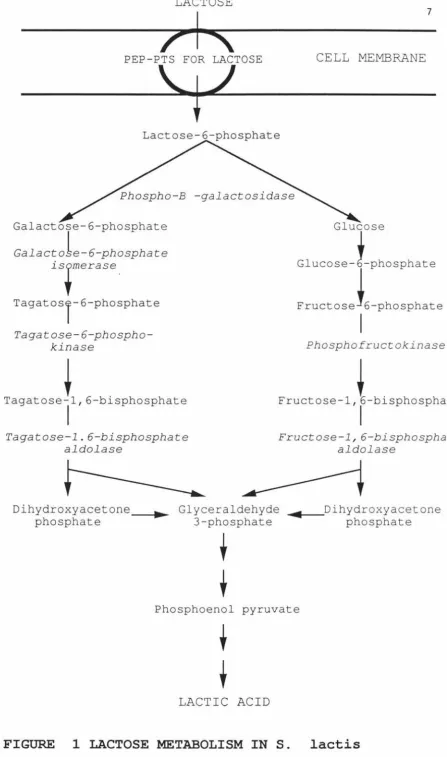
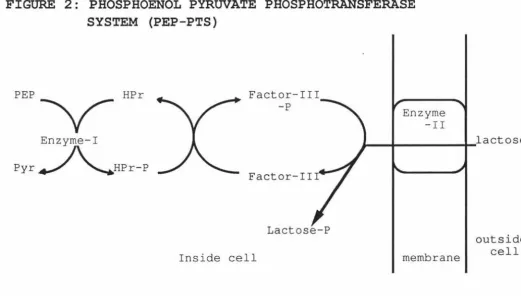
The lactose metabol ic pathways in S. lactis are shown in figure 1. Lactose is transferred into the cell by a specific phosphoenol pyruvate phosphotransferase system (PEP-PTS) (Figure 2). Four kinds of protein are involved in this system, in which enzyme II and factor III are specific for lactose while enzyme I and a small heat stable protein (HPr) are nonspecific. Lactose is phosphorylated at carbon 6 position when i t is
transferred into cells. The lactose-6-phosphate is then cleaved into glucose and galactose-6-phosphate (Gal-6-P) through the reaction catalysed by
phospho-B-galactosidase. Glucose is metabolized to
triose-phosphates through the glycolytic pathway while Gal-6-P produces the same triose-phosphates through the
tagatose-6-phosphate pathway (T6P pathway). The triose-phosphates are then converted to lactic acid through the same pathway.
The glycolytic pathway and the T6P pathway are similar processes. Tagatose-6-phosphokinase (T6PK) and tagatose-1,6-bisphosphate aldolase (Tl,6BP aldolase) are equivalent to PFK and fructose-1,6-bisphosphate aldolase
(Fl, 6BP aldolase) .
LACTOSE
rl,
7PEP-PTS FOR LACTOSE
CELL MEMBRANE
'--iL
Lactose-6-phosphate
Galactose-6-phosphate
Galactole-6-phosphate
is.merase.
Tagatosr-6-phosphate
Tagatose-6-phospho-kinase
Tagatosetl,6-bisphosphate
I
Tagatose-1.6-bisphosphate aldolase
Glucose
Glucose-I-phosphate
Fructoset6-phosphate
I
Phosphofructokinase
Fructose-1, t-bisphosphate
I
Fructose-1, 6-bisphosphate aldolase
Dihydroxyacetone _ _
••
phosphate
Glyceraldehyde
••
- -Dihydroxyacetone3-phosphate phosphate
Phosphoenol pyruvate
[image:26.560.66.513.14.771.2]LACTIC
ACID
FIGURE 2: PHOSPHOENOL PYRUVATE PHOSPHOTRANSFERASE
SYSTEM (PEP-PTS)
P E P ~ HPr Factor-III -P
Enzyme -II Enzyme-I
P y r ~ H P r - P
lactose
.,__
....
_____
_.._
Factor-II
Lactose-P
Inside cell membrane
outside cell
[image:27.831.177.699.130.426.2]The PEP-PTS for lactose and the T6P pathway are induced when S. lactis is grown on lactose or galactose. The genes for enzyme II, factor III of the PEP-PTS;
galactose-6-phosphate isomerase, T6PK, Tl,6BP aldolase of T6P pathway and phospho-galactosidase are on a
plasmid (Crow et al, 1983).
1.3 DETERMINATION OF THE AMINO ACID SEQUENCE OF A PROTEIN
The determination of the amino acid sequence of a pure protein involves several steps.
First, the protein has to be fragmented to get peptides of a suitable size for sequencing because the number of residues which can be sequenced by the current sequencing methods is limited due to the loss of
material or due to the lag reaction during sequencing.
There are enzymic and nonenzymic methods for protein fragmentation. Partial acid hydrolysis is one of the oldest methods used. It is nonspecific and the peptides produced are unpredictable and small. This method is suitable for small proteins being sequenced manually. Because of the random digestion, some
overlapping fragments can occur and this is useful for alignment of the total sequence. But this method
produces many di and tri peptides and this can give ambiguous results for large proteins. The studies of the high specificity of the proteolytic enzyme trypsin by Bergmann et al. (1939) led to the application of proteolytic enzymes in the specific cleavage of
proteins. Trypsin is the most commonly used proteolytic enzyme and it cleaves the peptide chain specifically on the carboxyl side of lysine and arginine. The cleavage can be restricted with the blocking of the £-amino
groups of lysine by carbamylation or acetylation.
Trifluoroacetylation and maleylation may be used to block the£- amino groups of lysine reversibly (Kasper, 1975). Aminoethylation of the cysteine residues with ethyleneimine was introduced to form another site for tryptic cleavage (Raftery and Cole, 1966). There are also some other proteolytic enzymes which can be used to fragment proteins or to further digest the large
peptides obtained by other procedures. Proteins may be cleaved by chyrnotrypsin at the carboxyl side of
tyrosine, phenylalanine, tryptophan or methionine. Leucine is cleaved more slowly. Thermolysin cleaves proteins and peptides on the amino side of isoleucine, leucine, valine, phenylalanine, alanine, methionine and tyrosine. If proline is at the carboxyl side of the thermolysin-sensitive residue, the cleavage will not be successful. Staphylococcus aureus VS protease, a
microbial enzyme, can hydrolyse proteins or peptides on the carboxyl side of glutamic acid specifically (Houmard and Drapeau, 1972). Pepsin can hydrolyse peptide bonds formed by either amino or carboxyl groups of
phenylalanine, glutamic acid, cysteine and cystine. Among the non-enzymic methods of specific cleavage of proteins and peptides, CNBr is the most specific and the most useful reagent. CNBr selectively cleaves the
peptide bond on the carboxyl side of the methionine
residues (Figure 3). The initial reaction is the formation of a methionine cyanosulphonium
derivative(II), which is converted into the transient homoserine iminolactone(III). Then the reaction
spontaneously forms a new amino terminal peptide and a
H
H
I
I
,
R-1\-/GH-~-N-R
H.1C O
-
"'
. ,.CH,-S-CH3
- ~ = N
G,
-
-I II
H
H
I
+ IR-N-CH-C=~H-R
H.,O
---=--+
R-I\-lH-\-
I
,.
c-o
+
I
\
H.1C 0
-
"'
CH/ 2S-CH
I
3CN
III
FIGURE 3: CNBr CLEAVAGE OF PROTEIN I: Protein+ CNBr
H2C~ / 0
CH2
IV
II: methionine cyanosulfonium derivative III: homoserine iminolactone
IV: shortened protein+ homoserinelactone peptide
[image:31.562.83.491.209.545.2]homoserine lactone peptide fragment. Also some other
selective cleavage methods were investigated by a number
of researchers. 2-(2-nitrophenylsulphenyl) -3
-methylindole (BNPS-Skatole) (Ozol and Gerad, 1977;
Mahoney and Hermodson, 1979) were found to be relatively
good reagents for selective cleavage at tryptophan.
After cyanylation, peptides or proteins can be cleaved
at cysteine residues (Degani and Patchornik, 1971) .
Hydroxylamine can be used to cleave the asparagine
-glycine bonds (Bornstein, 1970) . In weak acid
conditions, such as 10% acetic acid or 70% formic acid,
Asparagine-proline bonds can be cleaved (Piszkiewicz,
London and Smith, 1970). Because these methods have
serious side reactions and are less efficient than CNBr,
they are not used as commonly as CNBr.
Since the three dimensional structures of native
proteins limit the exposure of the sensitive peptide
bonds to the proteolytic enzymes or reagents, the
proteins have to be denatured to ensure complete
reaction. The methods include heating and
trichloroacetic acid precipitation. If the proteins are
stabil ized by disulphide bonds, they have to be cleaved
before unfolding. The methods include reduction
followed by S-carboxymethylation of the reduced thiol
groups (Crestfield, Moore and Stein, 1963) and performic
acid oxidation.
The methods used for separation of the peptides
obtained from digestions are paper electrophoresis, gel
14
electrophoresis, gel filtration chromatography, and ion-exchange chromatography. The recent introduction of the Fast Protein Liquid Chromatography (FPLC) and the High Performance Liquid Chromatography with different kinds of columns has improved the separation power greatly enabling small amounts of peptides to be analysed. The Reverse Phase Liquid Chromatography (RPLC) has become the dominant tool for isolation of the peptides
(Shively, 1986). It has hydrophobic organic substances such as open-chain hydrocarbon or aromatic hydrocarbon, covalently linked to the surface of silica beads to bind the hydrophobic peptides. The solvent systems used to elute the peptides consist of an aqueous buffer system containing a water-miscible organic solvent called the organic modifier which can be easily changed to suit the properties of the peptides being separated.
Acetonitrile, propanol and methanol are the most popular organic modifiers.
After the peptides have been purified, they can be subjected to sequence analysis. In the history of
protein sequencing, many methods have been used, but the Edman degradation developed by P. Edman in 1950 is still widely used although the detailed procedures have been modified. The reactions of the Edman degradation
include addition, cleavage and conversion (Figure 4). They are carried out by sequentially adding the reagents and removing the excess reagents and byproducts. The thiazolinone is separated from the shortened peptide
Coupling
PITC
Cleavage
PROT::IN TM~ PTC-?ROT::IN
PTC-PROTEIN TFA
Conversion
ATZ-AA
ATZ-AA TFA
FIGURE 4: EDMAN DEGRADATION MECHANISM PITC: phenyl isothiocyanate
TMA: trimethylarnine
PT:-i-AA
FTC-protein: phenylthiocarbamoyl(PTC)-protein TFA: trifluoroacetic acid
ATZ-M: thiazolinone-amino acid PTH: phenylthiohydantoin
· PROTEIN
[image:34.565.118.466.57.572.2]phenylthiohydantoin (PTH) which can then be analysed by chromatographic methods. The newly exposed amino
terminal amino acid of the peptide can react again with the Edman reagents and the cycle is repeated. Problems that may occur with this procedure include the loss of peptides during extraction and the desulphurization of the coupled amino terminal residue which prevents the cleavage of this residue.
The Edman-degradation mechanism was first used in protein sequencing as a manual method and the major disadvantages of the early procedures were the
difficulties in separating and characterising the PTH derivatives and the replacement of the sulphur atom in the coupled amino terminal with oxygen when air was present during the first extraction step where the excess reagents and byproducts were removed. In the 1960s, Hartley (1969) introduced the dansylation method which enabled the amino terminal derivatives to be
easily detected by thin-layer chromatography and improved the sensitivity of sequencing due to the
fluorescent nature of the dansyl derivatives. Also this method eliminated the first extraction step and so the desulphurization was reduced. The average number of residues which can be sequenced by manual methods is about fifteen and this limitation restricts the use of manual methods on large proteins.
In 1967, the first automatic sequenator was described by Edman and Begg (1967). The coupling and
cleavage reactions took place in a cup which was
spinning to make the reaction mixture form a thin liquid layer on the wall of the cup so that the extraction of the excess reagents and the byproducts was efficient. Some peptides were also extracted during extracting step, but the introduction of polybrene, a
polyquaternary amine with positive charges, reduced the loss of the peptides by keeping the peptides in the cup without being extracted by organic solvent through
forming hydrogen bonds or providing a stable polar environment.
Laursen (1971) introduced a solid phase sequenator where the peptides were covalently attached to a solid support so that the peptides would not be lost during the extraction step. Peptides could be attached to the resin with their carboxyl terminal residues by different methods. They could be coupled with their «-carboxyl groups of the carboxyl terminal residues, with the amino groups of the carboxyl terminal lysine residues, or with the homoserine carboxyl terminus. But these reactions are often not efficient resulting in the loss of the peptides during the coupling procedure.
In early 1980s, the gas phase sequenator (Hewick et al., 1983) was invented which increased the efficiency and the sensitivity of the automated sequencing
procedure. The important feature of this sequenator is that the reagents, which can dissolve the peptides
sitting in the glass fibre disc, are supplied in gas
phase to prevent the loss of the peptides through
extraction. The automatic sequencing procedures prevent the desulphurization by gassing the reagents and the solvent with argon gas.
In contrast to the amino terminal sequencing, the carboxyl terminal sequencing is not as satisfactory. Some carboxyl terminal exopeptidases are used.
Carboxypeptidase A, which hydrolyses most of the amino acids at carboxyl terminus at various rates except for carboxyl terminal of praline and charged amino acids; and carboxyl peptidase B, which cleaves the carboxyl terminal of lysine and arginine, are the most widely used enzymes. These two enzymes are often combined together in practical use. In addition,
carboxypeptidase C which can cleave all the amino acids from carboxyl terminal at a good rate except glycine is now commercially available. Carboxypeptidase Y which can cleave most amino acids except aspartic acid, histidine, arginine, lysine and glycine is the most recent exopeptidase to be used extensively for the
carboxyl terminal sequence analysis because of its good specificity and strong action on substrates.
Entering 1980s, mass spectrometry (MS) has
appeared as an important tool for the determination of the primary structure of proteins. This technique has become possible in protein study because of the
introduction of the Fast Atom Bombardment Mass
Spectrometry (FABMS) by Barber (1981) in which a peptide
is dissolved in a solvent such as HCl treated glycerol and is irradiated with a beam of atoms (Ar or Xe) to form secondary ions. This method has removed the
previous limitation of MS of vapourizing the substrates. The molecular ions can then be separated precisely by their mass to charge ratio in the magnetic sector of the instrument. Since the FABMS can give the molecular
weight of the protonated peptides precisely, it can not only confirm the peptide sequences obtained from Edman-degradation, but also give an indication of the
modification of the peptides which cannot be shown by Edman-degradation. Thus FABMS is a good complement to Edman-degradation. Also FABMS can give the sequence information from the masses of different peptide species formed by fragmentation by bombardment.
In 1980s, the development of the DNA sequencing techniques provides an indirect method for amino acid sequence determination because each amino acid has a specific codon and the specific arrangement of these codons in DNA indicates the amino acid sequence. Although this method is quicker than that acting directly on protein, the protein sequencing is still used widely and cannot be replaced by DNA sequencing. There are some reasons for this phenomenon. First, from DNA to protein, several steps are involved. To form mRNA, DNA information has to be processed including
splicing. Thus the mRNA sequence is not the simple copy of DNA sequence. After translation, the proteins need to be modified such as cutting of some terminal
20
1.4 AIMS
PFK plays an important role in regulating the glycolytic rate so that a suitable energy and metabolic intermediate supply can be obtained. Thus it is
necessary to study its catalytic mechanism and regulatory properties. Since these properties are related to enzyme structure which is coded in the
protein sequence, the study of the primary structure of PFK is especially important in understanding its
properties.
In S. lactis, the lactose metabolism includes two parallel and similar pathways, the T6P pathway to
metabolize galactose-6-phosphate from the cleavage of lactose and the glycolysis pathway to metabolize glucose from the cleavage of lactose. The end products of the two pathways are the same, dihydroxyacetone phosphate and glyceraldehyde-3-phosphate. these two pathways coordinate with each other so that neither glucose nor galactose-6-phosphate accumulate intracellularly. There must be some regulatory mechanisms existing inside cells which adjust the two pathways to operate at equal rates. The study and comparison of the enzymes involved in the two pathways should provide a basis for the
understanding of the regulatory mechanisms.
Interestingly, the PFK and T6PK (Tagatose-6 phosphokinase) in the two pathways catalyse similar phosphorylation reactions and their substrates are
isomers whose only difference is the position of the
hydroxyl group at carbon 4.
Fructose-6-phosphate Tagatose-6-phosphate
Thus a study of PFK and T6PK, comparing their primary and tertiary structures and their catalysing mechanism will help us to understand their catalytic mechanisms and also their specificities.
In this study, the PFK was isolated from S. lactis and digested with trypsin, chymotrypsin, S. aureus V8 protease and CNBr. The peptides obtained were separated by Superose-12 gel filtration on Fast protein liquid chromatography (FPLC), Reverse-phase liquid
chromatography (RPLC) and G-50 Sephadex gel filtration chromatography. The amino terminal sequences of the peptides were deduced using a gas-phase sequencer and then confirmed by amino acid analysis and FABMS in some cases.
Chapter three describes the isolation of PFK from S. lactis. The amino acid sequences of the PFK
peptides, which were obtained from CNBr, trypsin
,chymotrypsin and S. aureus V8 protease digestions are shown in chapter four. Chapter five illustrates the comparison of the PFK primary structures from E. coli, S. lactis and B. stearothermophilus, especially the amino acid sequences around the active site and the
regulatory site.