Statistics
in focus
ECONOMY AND
FINANCE
THEME 2 27/2000
NATIONAL ACCOUNTS
Contents
ANNUAL GDP GROWTH 1
GDP IN EURO 2
GDP IN REAL TERMS 3
GDP MAIN AGGREGATES 6
* * * * * + + * * * * *
■■■■
eure
»stat
Jr
THE GDP OF THE
CANDIDATE COUNTRIES
Annual data for 1999
Silke Stapel
Annual GDP growth
<
CC growth drops below EU15 for first time since 1994
This publication presents GDP data for the European Union Candidate Countries (CCs), introducing 1999 figures for the first time. It focuses on annual data, providing more detailed breakdowns and comparisons with the EU Member States than is shown in the quarterly publications.
It is the first time that Eurostat has presented data in such detail for Malta and Turkey. As before, the CCs Bulgaria, Cyprus, the Czech Republic, Estonia, Hungary, Latvia, Lithuania, Poland, Romania, the Slovak Republic and Slovenia are included, along with comparisons against EU-15 Member States.
A separate publication (Statistics in Focus 17/2000) is available which shows the latest quarterly GDP data, though not broken down into such detailed components.
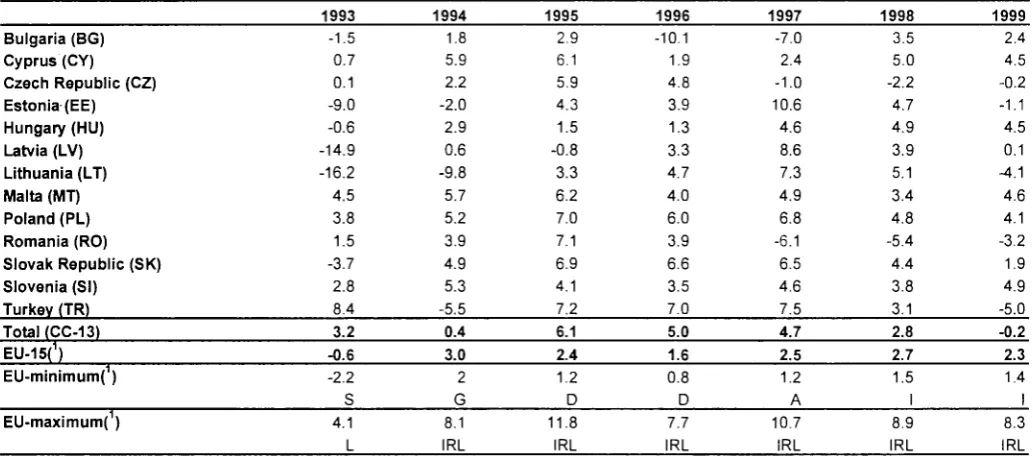
The most prominent feature of the newly released figures is the 1999 annual growth rates, which show the GDP growth of the CC-13 group dropping below that of the EU for the first time since 1994. Growth rates for each CC, which vary greatly, are shown overleaf.
The national accounts data in this Statistics in Focus are presented as follows: First of all, the annual growth in GDP is shown, followed by GDP at current prices in euro ('national total' and 'per head'). To enable better comparisons between countries, data are then shown in Purchasing Power Standards (PPS) (total and 'per head'), before the report turns to expenditure breakdowns and production (Gross Value Added) and investment by branch.
Fig. 1. Annual GDP growth rates, in %
% 7.0
6.0
5.0
4.0
3.0
2.0
1.0
With nine of the CCs experiencing a decline in growth in 1999 and Estonia, Lithuania and Turkey joining Romania and the Czech Republic in negative growth, the CC-13 group as a whole has plummeted from a growth rate of 2.8% in 1998 to -0.2% in 1999. Turkey, because of its economic size, has a high
weighting in the average, and its growth rate of -5.0% is reflected in this. Cyprus, Hungary, Malta, and Slovenia, however, all enjoyed rates of at least 4.5%. Only seven of the thirteen bettered the slowest-growing EU Member State, compared to twelve, ten and eleven countries in the 1996 to 1998 period.
Table 1. Annual GDP growth rates, percentage change on previous vear
1993 1994 1995 1996 1997 1998 1999
Bulgaria (BG) Cyprus (CY) Czech Republic (CZ) Estonia (EE) Hungary (HU) Latvia (LV) Lithuania (LT) Malta (MT) Poland (PL) Romania (RO) Slovak Republic (SK) Slovenia (SI) Turkey (TR)
-1.5 0.7 0.1 -9.0 -0.6 14.9 16.2 4.5 3.8 1.5 -3.7 2.8 8.4
1.8 5.9 2.2 -2.0 2.9 0.6 -9.8 5.7 5.2 3.9 4.9 5.3 -5.5
2.9 6.1 5.9 4.3 1.5 -0.8 3.3 6.2 7.0 7.1 6.9 4.1 7.2
-10.1
1.9 4.8 3.9 1.3 3.3 4.7 4.0 6.0 3.9 6.6 3.5 7.0
-7.0 2.4 -1.0
10.6
4.6 8.6 7.3 4.9 6.8 -6.1 6.5 4.6 7.5
3.5 5.0 -2.2 4.7 4.9 3.9 5.1 3.4 4.8 -5.4 4.4 3.8 3.1
2.4 4.5 -0.2 -1.1 4.5 0.1 -4.1 4.6 4.1 -3.2 1.9 4.9 -5.0
Total (CC-13) EU-15(1)
EU-minimum( )
EU-maximum( )
(') Based on ESA79 up to 1995,
3.2
-0.6 -2.2 S 4.1 L ESA95 from 1996 onwards
0.4 3.0
2 G 8.1 IRL
6.1 2.4
1.2 D 11.8 IRL
5.0 1.6
0.8 D 7.7 IRL
4.7 2.5
1.2 A 10.7 IRL
2.8 2.7
1.5 I 8.9 IRL
-0.2 2.3
1.4 I 8.3 IRL
GDP IN EURO
Total CC-13 GDP almost 7% of EU-15 area as measured in euro
In simple euro terms, the CC-13 group, even with the inclusion of Turkey, amounts to a very small economic area compared to the European Union. The total GDP in euro of the CC-13 represents just 6.6% of EU-15 GDP. Before 1999, this ratio had been increasing, but the downturn of the CCs average in this year reversed this trend.
As in the EU-15, the CC economies are very diverse in size. Turkey is by far the largest CC in euro terms, representing 33% of the CC-13 total. Only the Polish economy is even vaguely comparable in size, with 28% of CC-13 GDP. Malta has the smallest economy with a GDP of only 3.4 Bn euro (51 times smaller than Turkey, 5 times smaller than Luxembourg). Even grouping Malta with the five other smallest CCs gives a total of only 44 Bn euro, or 8% of the CC-13 total, barely 0.5% of the EU-15.
Table 2. GDP at current prices in Bn EURO
BG CY CZ EE HU LV LT MT PL RO SK SI TR
1994
8.2 6.3 34.6 1.9 34.9 3.1 3.6 2.3 82.9 25.2 11.6 12.1 108.9
1995
10.0 6.8 39.8 2.7 34.1 3.4 4.6 2.5 96.6 27.1 13.3 14.3 129.6
and exchange rates,
1996
7.8 7.0 45.6 3.4 35.6 4.0 6.2 2.6 112.6 27.8 14.8 14.9 143.1
1997
9.0 7.5 46.4 4.1 40.4 5.0 8.5 2.9 126.3 31.2 17.2 16.1 167.8
1998
11.0 8.1 49.5 4.7 41.9 5.4 9.6 3.1 140.2 36.9 18.1 17.5 177.8
1999
11.6 8.5 49.8 4.8 45.4 5.7 10 0 3.4 144.7 31.9 17.7 18.7 173.0
CC-13 EU-15 % of EU-15
EU-15 min
335.5 384.8 : 6 578.9 5.8
14.0
425.5 6 906.6 6.2
14.3
482.3 7 269.7 6.6
15.4
523.9 7 593.6 6.9
16.4
525.3 7 965.3 6.6
17.5
Massive differences in per head figures across the CCs
Measured in per head terms, the CC figures are also very wide-ranging, stretching from 1400 euro in Bulgaria (7% of the EU-15 figure) to 12800 euro
Statistics in focus — Theme 2 — 27/2000 ■
in Cyprus (61% of EU-15 figure).
However, countries can be more meaningfully compared using PPS figures which take into consideration the price differences between countries (see next section).
[image:2.595.45.562.155.383.2] [image:2.595.307.553.461.688.2]Table 3. GDP per head at current prices and exchange rates
BG CY CZ EE HU LV LT MT PL RO SK SI TR
CC-13
1994 1 000
9 900
3 400
1 300
3 400
1 200
1 000
6 100
2 200
1 100
2 200
6 100
1 800
2 000
1995 1 200 10 500
3 900
1 800
3 300
1 400
1 200
6 600
2 500
1 200
2 500
7 200
2 100
2 300
E U R O 1996
900
10 800
4 400
2 300
3 500
1 600
1 700
6 900
2 900
1 200
2 800
7 500
2 300
2 500
1997 1 100 11 400
4 500
2 800
4 000
2 000
2 300
7 700
3 300
1 400
3 200
8 100
2 700
2 900
1998 1 300 12 300
4 800
3 200
4 100
2 200
2 600
8 100
3 600
1 600
3 400
8 800
2 800
3 100
1999 1 400 12 800
4 800
3 300
4 500
2 400
2 700
8 800
3 700
1 400
3 300
9 400
2 700
3 100
1995
7 60
22
10
19 8 7
37 14
7
14
41
12
13
EU-15 = 100 1996
5 59
24
13
19 9 9
37
16 7
15
41
13
14
1997
6 59
23 15
21
10
12
40
17
7 16
42
14
15
1998
7 61
24
16
21
11
13
40
18
8
17
44
14
15
1999
7 61
23
16
21
11
13
42
18
7 16
45
13
15 Note: For the calculation of per capita GDP, the data for the total population is taken from the national accounts; it may be different from that obtained via demographic statistics
GDP IN REAL TERMS
Cyprus and Slovenia soar ahead
Figure 2 summarises the current position of the CCs in 1999 using the three key indicators of 'annual growth', 'GDP per head in PPS' and 'size of economy'. Cyprus and Slovenia are performing strongly, being positioned in the top right-hand portion of the graph and therefore exhibiting high growth and GDP per head which is already approaching that of the EU-15.
Looking at the bottom left-hand corner of the graph, we see that Romania, Turkey and the three Baltic states find themselves in a more difficult position, with low GDP per head, and negative growth. Bulgaria has lowest GDP per head, at 22% of the EU-average, but achieved positive growth of 2.4% in 1999.
6
4
S 2
ε
a. o
Q ¿
O
Fig. 2. Growth, size of GDP and GDP per head as % of Ell average, in PPS, in 1999
10
O
SI Oc>
SK
50 70 80 90 100
-4
-6
GDP per head in PPS as % of EU average
[image:3.595.48.573.74.280.2] [image:3.595.49.560.497.746.2]Turkey and Poland among eight largest economies of EU15 and CCs, in real terms
When making comparisons between the GDP of different countries, it is informative to express figures in an artificial currency unit called PPS (Purchasing Power Standard). This makes allowances for the varying price levels in different countries and makes the comparisons of GDP, both in absolute terms and 'per head', more meaningful.
Looking at Table 4 we see that the CC-13 group is not as small compared to the EU-15 as it appeared in euro terms (Table 2). Without Malta, who do not yet provide PPS figures, it amounts to 15.3% of the EU total in 1999, compared to just 6.6% when using the euro figures.
The individual CCs and EU Member States are ranked in the table by their GDP in 1999. Turkey and Poland can be seen to be significant players, both appearing in the eight largest economies above Belgium, Sweden and Austria, with Turkey also eclipsing the Netherlands.
It is still visible, however, that the CCs are generally smaller than the Member States. They occupy ten of the thirteen lowest positions in terms of GDP at PPS, disregarding Malta.
Table 4. GDP at current prices in Bn PPS
D UK F I E TR NL PL Β S A Ρ EL ' DK CZ RO FIN HU IRL SK BG SI LT L LV CY EE MT CC-13(1)
EU-15
1995
1 586.0 988.8 1 088.9 1 046.1 541.4
315.6
298.1
216.5
200.8 159.8 156.9 122.7 121.7 108.9
113.6 127.7
87.4
83.0
58.7
39.2 41.0 22.5 18.0
12.6
10.8 8.9 8.3
1 005.3
6 578.9
1996
1 660.6 1 066.9 1 122.2 1 096.2 575.3
346.8
306.7
238.9
207.3 165.8 166.5 128.0 129.3 115.9
123.9 138.1
90.4
87.6
62.4
43.5 38.4 24.3 19.7
13.1
11.6 9.4 9.0
1 091.1
6 906.6
1997
1 720.2 1 163.8 1 150.0 1 137.0 607.3
382.2
340.4
264.6
219.0 174.5 174.7 140.9 133.8 122.6
127.2 134.5
99.1
94.9
72.3
48.1 36.3 26.3 21.9
14.3
13.1 10.0 10.3
1 169.4
7 269.7
1998
1 788.3 1 215.5 1 203.5 1 176.2 641.4
403.0
357.3
279.7
229.6 181.8 181.2 150.1 140.1 127.4
125.4 128.3
105.5
100.4
80.3
50.6 37.3 27.6 23.2
15.2
13.7 10.6 10.9
1 210.7 7 593.6
1999
1 864.1 1 281.8 1 265.0 1 219.2 682.5
378.3
376.8
299.1
239.7 191.5 190.5 159.2 149.4 133.0
128.5 127.6
109.3
107.8
88.5
53.0 39.0 29.7 22.8
16.9
14.1 11.4 11.1
1 222.4 7 965.3 Source: Eurostat, OECD, ÖSTAT
Not including Malta
(1)
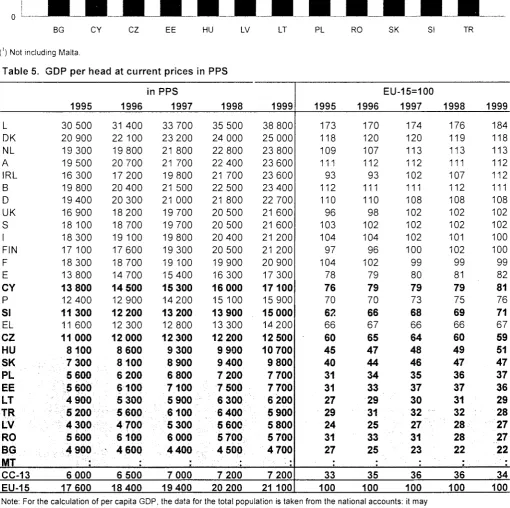
Cyprus and Slovenia moving closest to EU average GDP per head, in PPS
Cyprus have only very recently supplied data in PPS and we are now able to see from Table 5 that their GDP per head is significantly above that of both Portugal and Greece. Furthermore, at 8 1 % of the EU-15 average, they are just one percentage point behind the figure for Spain.
Slovenia has managed, in the last five years, to move from a GDP per head which was 62% of the
EU-15 figure to one of 71%, overtaking Greece in the process. Bulgaria and Romania, on the other hand, fell further behind the EU-15 and the CC-13 group, dropping by 4 to 5 percentage points to GDP per head of just 4700 and 5700 PPS, compared to the EU-15's 21100 and the CC-13 average of 7200. There is a highly visible divide between the Candidate Countries and the EU Member States, with CCs occupying the bottom ten positions, disregarding Malta.
Statistics in focus — Theme 2 — 27/2000 ■
m
25
20
Fig. 3. G D P per head In thousands of PPS, 1999
EU-15
BG CY CZ EE HU LV LT PL RO SK SI TR
(') Not including Malta.
Table 5. GDP per head at current prices in PPS
L DK NL A IRL Β D UK S I FIN F E CY Ρ SI EL CZ HU SK PL EE LT TR LV RO BG MT
CC-13 EU-15
1995
30 500 20 900 19 300 19 500 16 300 19 800 19 400 16 900 18 100 18 300 17 100 18 300 13 800
13 800
12 400
11300
11 600
11000 8100 7 300 5 600 5 600 4 900 6 200 4 300 5 600 4 900
: '';';'
6 000 17 600
in
1996
31 400 22 100 19 800 20 700 17 200 20 400 20 300 18 200 18 700 19 100 17 600 18 700 14 700
14 500
12 900
12 200
12 300
12 000 8 600 8100 6 200 6100 5 300 5 600 4 700 6 100 4 600
•
6 500 18 400
PPS
1997
33 700 23 200 21 800 21 700 19 800 21 500 21 000 19 700 19 700 19 800 19 300 19 100 15 400
15 300
14 200
13 200
12 800
12 300 9 300 8 900 6 800 7100 5 900 6100 5 300 6 000 4 400
■
7 000 19 400
1998
35 500 24 000 22 800 22 400 21 700 22 500 21 800
20 500
20 500 20 400 20 500 19 900 16 300
16 000
15 100
13 900
13 300
12 200 9 900 9 400 7 200 7 500 6 300 6 400 5 600 5 700 4 500
'.;
7 200 20 200
1999
38 800 25 000 23 800 23 600 23 600 23 400 22 700 21 600 21 600 21 200 21 200 20 900 17 300
17100
15 900
15 000
14 200
12 500 10 700 9 800 7 700 7 700 6 200 5 900 5 800 5 700 4 700
7 200 21 100
1995
173 118 109 111 93 112 110 96 103 104 97 104 78 76 70 62 66 60 45 40 31 31 27 29 24 31 27
•
33 100
1996
170 120 107 112 93 111 110 98 102 104 96 102 79 79 70 66 67 65 47 44 34 33 29 31 25 33 25
•
35 100
EU-15=100
1997
174 120 113 112 102 111 108 102 102 102 100 99 80 79 73 68 66 64 48 46 35 37 30 32 27 31 23
•
36 100
1998
176 119 113 111 107 112 108 102 102 101 102 99 81 79 75 69 66 60 49 47 36 37 31 32 28 28 22
'■■■■'
36 100
1999
184 118 113 112 112 111 108 102 102 100 100 99 82 81 76 71 67 59 51 47 37 36 29 28 27 27 22
;
34 100
Note: For the calculation of per capita GDP, the be different from that obtained via demographic
[image:5.595.34.545.248.756.2]GDP MAIN AGGREGATES
Expenditure components
In 1999, the share of GDP accounted for by final consumption of households and NPISH varied amongst the CCs from 51.1% in the Slovak Republic to 74.8% in Bulgaria, Table 6 shows. EU-15 figures, however, are even more wide-ranging, from 44.2% in Luxembourg to 74.1% in Greece. With the exception of Cyprus (whose share rose steeply between 1995 and 1999), there is a tendency for the low-performing countries to use a higher share of their GDP for this component, satisfying basic needs from limited incomes.
[image:6.595.54.581.323.569.2]Concerning Final Consumption of General Government, CC figures range from just 14.1% in Turkey to 23.7% in Estonia. Most of the CCs fall within the EU-range, however, which begins with 14.2% in Ireland and ends with the high Scandinavian rates of 25.8% and 27.0% in Denmark and Sweden.
Table 6. Main GDP aggregates, as a % of total GDP
In terms of GFCF, the Slovak Republic far exceeds the other CCs with 33.0% of its GDP being attributed to this, though this is lower than the 38.6% of 1997. This is far above the highest Member State, Portugal, on 26.9%. At the other end of the scale, Bulgaria records 15.9% compared to the EU-minimum of 16.6% in Sweden.
New data for Malta shows them to be by far the most prolific foreign traders, relative to their economic size. Exports in 1999 were worth 91.9% of their GDP, with imports slightly higher at 96.8%. Turkey's exports, on the other hand, amounted to 21.6% of its GDP, whilst it imports 25.0%. Trade for EU Member States varies even more greatly, with imports ranging from 17.8% to 113.2% of GDP (Greece and Luxembourg) and exports stretching from 23.5% to 95.5% (Italy and Luxembourg). On average, the economies of the CC-13 group are far more foreign trade oriented than the EU-15.
BG CY CZ EE HU LV LT MT PL RO SK SI TR CC-13 EU-15
Final consumption of households
a 95
70.7 63.7 50.8 58.9 53.7 62.6 674 61.1 61.2 67.6 51.4 58.1 68.9 62.4 57.4
nd NPISH 97
70.3 66.1 53.3 59.0 50.3 66.6 65.1 62.4 63.5 74.1 49.7 56.5 68.3 63.2 57.8
99
74.8 66.9 53.4 58.6 51.8 64.5 (1)
64.9 62.8 63.2 72.7 f1)
51.1 55.4 67.6 62.9 58.2
of general government 95
15.3 16.1 19.9 25.4 23.6 22.2 19.7 20.5 16.6 13.7 19.5 20.2 10.6 15.7 20.7
97
12.8 18.8 19.9 22.1 21.9 19.1 19.0 20.5 16.1 12.3 21.9 20.5 12.3 15.9 20.3
99
15.8 18.0 19.7 23.7 21.9 19.0 22.5 18.7 16.5 14.0 (')
20.9 20.6 14.1 16.9 20.0
95
15.3 19.2 32.0 26.0 20.0 15.1 23.0 31.9 18.7 21.4 26.4 21.4 23.3 22.4 19.8
GFCF
97
10.8 19.0 30.8 27.9 22.2 18.7 24.4 25.3 23.6 21.2 38.6 23.5 26.5 25.3 19.5
99
15.9 17.8 26.4 25.1 23.9 25.0 22.5 22.7 26.5 18.5 33.0 26.9 20.3 23.5 20.2
Exports
95
44.7 46.6 53.6 72.4 36.9 46.9 53.0 93.8 25.5 27.6 59.8 55.2 19.5 32.0 29.7
97
61.9 47.0 56.9 78.1 45.5 51.0 54.5 85.1 25.7 29.2 60.7 57.1 24.7 35.1 31.9
99
44.1 44.6 63.6 76.9 52.6 46.7 39.8 91.9 25.7 30.1 64.8 52.7 21.6 34.9 32.0
Imports
95
46.3 49.9 58.4 80.4 38.2 49.3 64.8 107.5 23.2 33.2 58.0 568 19.6 32.9 28.0
97
56.4 52.1 62.9 89.6 45.5 59.5 65.1 93.5 30.0 36.2 71.0 58.3 30.5 40.1 29.7
99
51.9 49.3 65.2 82.6 55.0 57.6 50.1 96.8 32.9 34.3 69.8 56.7 25.0 39.6 30.8
External trade balance
95
-1.6 -3.3 -4.8 -8.0 -1.3 -2.4 -11.8 -13.7 2.3 -5.5 1.8 -1.6 -0.1 -0.9 1.7
97
5.5 -5.1 -6.0 -11.5 0.0 -8.5 -10.6 -8.4 -4.3 -7.0 -10.3 -1.2 -5.8 -5.0 2.2
99
-7.8 -4.7 -1.6 -5.7 -2.4 -10.9 -10.3 -4.9 -7.2 -4.2 -5.0 -4.0 -3.4 -4.7 1.2 ( ) 1998 data
In 1999, all CCs exhibited a trade deficit with Bulgaria and Hungary slipping from positions of surplus and balance in 1997. The Baltic States of Latvia and Lithuania had the highest trade deficits in 1999, exceeding 10% of their GDP.
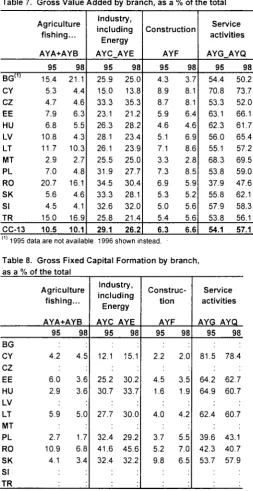
GVA and GFCF by branch
GVA figures broken down by branch (Table 7) are now available for all CCs up to and including 1998.
In 1998, it is in 'Agriculture' where the differences between the CCs are most obvious, ranging from 2.7%
in Malta to 21.1% in Bulgaria. The available EU figures are much smaller, generally around 3-4%, though Greece is by far the highest at 8.1% of GVA.
Concerning differences between 1995 and 1998, Bulgaria's (from 1996) increased 'Agriculture' share of almost 5 percentage points in GVA stands out, while it dropped significantly in Latvia, Poland and Romania. In these three countries this was concurrent with a considerable increase in the share of 'Service activities' in GVA.
Statistics in focus — Theme 2 — 27/2000 ■
ΈΔ
'Service Activities', a broad category taking the largest share of GVA, varies between 62.7% and 78.7% in the EU Member States (Portugal and Luxembourg) and between 47.6% and 73.7% (Romania and Cyprus) in the CCs, with a great deal of overlap. 'Industry and Construction' occupy slightly higher shares in the CCs than in the available EU Member States.
Data availability for GFCF by branch, shown in Table 8, is more limited. The outstanding figures generally reflect the shares shown in Table 7, with Cyprus investing heavily in 'Service Activities' (78%) and Romania only investing 4 1 % of GFCF in this branch. In the case of Romania, most prominently, the fall in investment in agriculture coincides with the lower GVA share for this branch.
>
E S S E N T I A L I N F O R M A T I O N
-M E T H O D O L O G I C A L NOTES
Table 7. Gross Value
Agriculture fishing...
AYA+AYB
95 98
BG(1)
CY CZ EE HU LV LT MT PL RO SK SI TR CC13
15.4 21.1 5.3 4.4 4.7 4.6 7.9 6.3 6.8 5.5 10.8 4.3 11.7 10.3 2.9 2.7 7.0 4.8 20.7 16.1 5.6 4.6 4.5 4.1 15.0 16.9
10.5 10.1
Added by branch, as a
Industry, including Energy
AYC AYE
95 98
25.9 25.0 15.0 13.8 33.3 35.3 23.1 21.2 26.3 28.2 28.1 23.4 26.1 23.9 25.5 25.0 31.9 27.7 34.5 30.4 33.3 28.1 32.6 32.0
25.8 21.4
29.1 26.2
'/„ of the total
Construction
AYF
95
4.3 8.9 8.7 5.9 4.6 5.1 7.1 3.3 7.3 6.9 5.3 5.0 5.4
6.3 98
3.7 8.1 8.1 6.4 4.6 6.9 8.6 2.8 8.5 5.9 5.2 5.6 5.6
6.6
Service activities
AYG
95
54.4 70.8 53.3 63.1 62.3 56.0 55.1 68.3 53.8 37.9 55.8 57.9 53.8
54.1 AYQ
98
50.2 73.7 52.0 66.1 61.7 65.4 57.2 69.5 59.0 47.6 62.1 58.3 56.1
57.1
1995 data are not available. 1996 shown instead.
Table 8. Gross Fixed Capital Formation by branch, as a % of the total
BG CY CZ EE HU LV LT MT PL RO SK SI
Agriculture fishing...
AYA+AYB 95
4.2
6.0 2.9
5.9
2.7 10.9 4.1
98
4.5
3.6 3.6
5.0
1.7 6.8 3.4
Industry, including Energy
AYC AYE
95 98
12.1 15.1
25.2 30.2 30.7 33.7
27.7 30.0
32.4 29.2 41.6 45.6 32.4 32.2
Construc tion
AYF 95
2.2
4.5 1.6
4.0
3.7 5.2 9.8
98
2.0
3.5 1.9
4.2
5.5 7.0 6.5
Service activities
AYG AYQ 95 98
81.5 78.4
64.2 62.7 64.9 60.7
62.4 60.7
39.6 43.1 42.3 40.7 53.7 57.9
The Candidate Countries, with the exception of Turkey, send Eurostat data 4 times per year using the same standardised format as the Member States, though the completeness of the tables varies from country to country. Data for this publication were supplied prior to mid-May 2000, at the latest, and have been validated by Eurostat. There are significant differences in the 1998 GDP estimates for Romania, compared to previous publications, due to the replacement of provisional accounts (based on quarterly data) by semi-final annual accounts.
Other data sources
Since Turkey do not yet participate in the systematic submission of National Accounts data to Eurostat, the data shown in this publication have been drawn from a general statistical questionnaire submitted to Eurostat by the Turkish Statistical Office, in June 2000.
Missing data
The most important of these are the figures in PPS for Malta. Malta has not yet participated in the Price Comparison Round which is essential in order to determine the exchange rate between the Maltese Lira and the Purchasing Power Standard. The first data are expected later in the year 2000.
Some countries have been unable to supply data for Table 8, GFCF broken down by branches. This mainly reflects the state of the basic statistics and the longer delays in the field of investment statistics in the CCs.
Data quality
The NA data of the CCs are not yet compliant with the ESA 95 standard and should therefore continue to be treated with some caution. Comparability with EU Member States cannot be guaranteed. However, the CCs have generally made significant progress in improving the quality of their estimates over the past couple of years. This was supported by a series of EU-sponsored projects and workshops, which helped to improve the sources and methods used to compile National Accounts and heightened the exhaustiveness and consistency of the different national accounting systems. However, not all the changes have yet been implemented in the accounts for all years and the problem of consistent time series, in particular, remains to be solved in most CCs. Therefore, also in future revisions of level and growth rates of GDP might have to be anticipated.
[image:7.595.34.288.279.771.2]Further information.
> Databases
New Cronos, Domain: NA MNAG
To obtain information or to order publications, databases and special sets of data, please contact the Data Shop network:
B E L G I Q U E / B E L G I Ë D A N M A R K D E U T S C H L A N D E S P A N A F R A N C E I T A L I A R o m a
Eurostat Data Shop BruxellesfBrusssI Planista! Belgique 124 Rue du Commerce Handelsstaal 124 Β1000 BRUXELLES / BRUSSEL
Tel. (32-2) 234 67 M
Fax (322) 234 67 51 EMal. datashop@planistat.be
DANMARKS STATISTIK Bibliotek og Information Eurostat Data Shop Sejrøgade 11 DK2100 KØBENHAVN 0 Tel. (4539)17 30 30 Fax (4539) 17 30 03 EMail: bib@dstdk
STATISTISCHES BUNDESAMT Eurostat Data Shop Berlin OttoBraunStraße 7072 D10178 BERLIN Tel. (4930) 23 24 64 27/28 Fax (4930) 23 24 64 30 EMail:
datashop@statistikbund.de
INE Eurostat Data Shop Paseo de la Castellana, 183 Oficina 009
Entrada por Estébanez Calderón E28046 MADRID Tel. (3491)583 9167 Fax (3491) 579 71 20 EMail: datashop.eurostat@ine.es
INSEE Info Service Eurostat Data Shop 195. rue de Bercy Tour Gamma A F75582 PARIS CEDEX 12 Tel. (331)5317 88 44 Fax (331) 53 17 88 22 EMail: datashop@insee.fr
ISTAT
Centro di Informazione Statistica Sede di Roma, Eurostat Data Shop Via Cesare Balbo, 11a 100184 ROMA Tel. (3906) 46 73 31 02/06 Fax (3906) 46 73 31 01/07 EMail: dipdiff@istat.it
I T A L I A Milano LUXEMBOURG NEDERLAND NORGE PORTUGAL S C H W E I Z / S U I S S E / S V I Z Z E R A
ISTAT
Ufficio Regionale per la Lombardia Eurostat Data Shop
Via Fieno 3 120123 MILANO
Tel. (39-02) 8061 32460
Fax (3902) 8061 32304 Email: mileuro@tjn.it
Eurostat Data Shop Luxembourg BP453
L2014 LUXEMBOURG 4, me A Weicker L2721 LUXEMBOURG Tel. (352) 43 35 22 51 Fax (352) 43 35 22 221 EMail: dslux@eurostatdatashop.lu
STATISTICS NETHERLANDS Eurostat Data ShopVoorburg pò box 4000
2270 JM VOORBURG Nederland Tel. (3170) 337 49 00 Fax (3170) 337 59 84 EMail: datashopgcbs ni
Statistics Norway Library and Information Centre Eurostat Data Shop Kongens gate 6 P. b. 8131, dep. N0033OSLO Tel. (4722) 86 46 43 Fax (4722) 86 45 04 EMail: datashop@ssb.no
Eurostat Data Shop Lisboa INEJScrvico de Difusão Av. António José de Almeida, 2 P1000043 LISBOA Tel. (35121)842 6100 Fax (35121) 842 63 64 EMail: data.shop@ine.pt
Statistisches Amt des Kantons Zürich, Eurostat Data Shop Bleicherweg 5 CHS090 Zürich Tel. (411)2251212 Fax (411) 225 12 99 EMail: datashop@zh.ch Internetadresse: http://www.zh.ch/statistik
S U O M I / F I N L A N D S V E R I G E U N I T E D K I N G D O M U N I T E D K I N G D O M U N I T E D S T A T E S O F A M E R I C A
Eurostat Data Shop Helsinki Tilasto kirjasto Postiosoite: PL 2B
Käyntiosoite: Työpajakatu 13 B, 2 krs FIN00022 Tilastokeskus Tel. (3589)17 34 22 21 Fax (3589) 17 34 22 79 Sposti dataslicp Cilastokeskijs@!ilastokeskijs Γι IntemetadBSia:
hüpJ/www blaaokeskus MWkWdatashcp lumi
STATISTICS SWEDEN Information service Eurostat Data Shop Karlavägen 100 Box 24 300 S104 51 STOCKHOLM Tel. (468) 50 69 48 01 Fax (468) 50 69 48 99 EMail: infoservice@scb.se URL: htroJ/www.scb.se/info/datashop/ eudatashop.asp
Eurostat Data Shop Enquiries & advice and publications
Office for National Statistics Customers 4 Electronic Services Unit 1 Drummond GateB1/05 UKLONDON SW1V2QQ
Tel. (44-171) 533 56 76
Fax (441633) 812 762 E.Mai eurostatdatashop@ons.gov.uk
Eurosta! Data Shop Electronic Data Extractions. Enquiries & advice R.CADE Unit 1L Mountjoy Research Centre University of Durham UK DURHAM DH1 3SW Tel: (44191) 374 7350 Fax: (44191) 384 4971 EMail: rcade(5)dur.ac.uk URL: http://wwwrcarje.dur.ac.uk
HAVER ANALYTICS Eurostat Data Shop 60 East 42nd Street Suite 3310
USANEW YORK, NY 10165 Tel. (1212)986 93 00 Fax (1212) 986 58 57 EMail: eurodata@haver.com
Media Support Eurostat (for professional journalists only):
Bech Building Office A3/48 · L2920 Luxembourg · Tel. (352) 4301 33408 · Fax (352) 4301 32649 ■ email: eurostatmediasupport@cec.eu.int
For information o n methodology:
Silke Stapel, EurostatÆ2, L-2920 Luxembourg, Tel.: (352) 4301 32263, Fax: (352) 4301 33879, E-mail: silke.stapel@cec.eu.int ORIGINAL: English
Please visit our web site at www.europa.eu.int/comm/eurostat/ for further information!
A list of worldwide sales outlets is available at the Office for Official Publications of the European Communities.
2 rue Mercier L2985 Luxembourg Tel. (352) 2929 42118 Fax (352) 2929 42709 internet Address http://europ.eu.int/fr/general/sad.htm email: info.info@cec.eu.int
BELGIQUE/BELGIË DANMARK DEUTSCHUND GREECE/ELLADA ESPAÑA FRANCE IRELAND ITALIA LUXEMBOURG NEDERLAND ÖSTERREICH PORTUGAL SUOMI/FINLAND SVERIGE UNITED KINGDOM ISLAND NORGE SCHWEIZ/SUISSE/SVIZZERA BALGARIJA CESKÄ REPUBUKA CYPRUS EESTI HRVATSKA MAGYARORSZÁG MALTA POLSKA ROMANIA RUSSIA SLOVAKIA SLOVENIA TÜRKIYE AUSTRALIA CANADA EGYPT INDIA ISRAËL JAPAN MALAYSIA PHILIPPINES SOUTH KOREA THAILAND UNITED STATES OF AMERICA
Order form
I would like to subscribe to Statistics in focus (from 1.1.2000 to 31.12,2000): (for the Data Shop and sales office addresses see above)
□ Formula 1 : All 9 themes (approximately 140 issues)
Π Paper: EUR 360 □ PDF: EUR 264 □ Paper + PDF: EUR 432
Language required: Π DE O EN D FR
Π Formula 2: One or more of the following seven themes:
D Theme 1 'General statistics'
Π Paper: EUR 42 D PDF: EUR 30 Π Combined: EUR 54 □ Theme 2 'Economy and finance'
□ Theme 3 'Population and social conditions' □ Theme 4'Industry, trade and services Π Theme 5 'Agriculture and fisheries' □ Theme 6 'External trade'
D Theme 8 'Environment and energy
□ Paper: EUR 84 Π PDF: EUR 60 Π Combined: EUR 114 Language required: D DE □ EN □ FR
%£. Q Please send me a free copy of 'Eurostat Mini-Guide' (catalogue
containing a selection of Eurostat products and services) Language required: Π DE □ ÉN □ FR
Q I would like a free subscription to 'Statistical References', the information letter on Eurostat products and services
Language required: Π DE Π EN □ FR □ Mr □ Mrs D Ms
(Please use block capitals)
Surname: Company: Function: Address: Post code: Country: Tel.:
Forename: Department:
Town:
Fax: E-mail:
Payment on receipt of invoice, preferably by: Π Bank transfer
Π Visa □ Eurocard
Card No: Expires on: Please confirm your intra-Community VAT number:
If no number is entered, VAT will be automatically applied. Subsequent reimbursement will not be possible.