[ T i
û
OJ O
o
o
Statistics
on
audiovisua
«■a «"T)
services
Data 1980-1998
E U R O P E A N
Our mission is to provide the European Union
with a highquality statistical information service
Eurostat's collections
are adapted to the needs of all users.
You will find them in each of the nine themes proposed by Eurostat.
m
1 General statistics ffiuJI 2 Economy and finance
3 Population and social conditions 4 Industry, trade and services 5 Agriculture and fisheries
Â
■tfrflt:
6 External trade ¿3L~~ 7 Transport
8 Environment and energy 9 Research and development
M
craP
h fables Comments C o n t e n tPress releases: Eurostat publishes around 100 press releases every year in connection with the release of new data. The press releases include the key figures on the EU, the Member States and their partners. They are provided free of charge. They are also available on the Internet as soon as they are published: www.europa.eu.int/comm/eurostat/
F o r m a t
Paper Html PDF
Statistics in focus: This collection is published regularly by Eurostat and provides uptodate summaries of the main results of statistical surveys, studies and analyses. It covers all themes and consists of about four to eight pages per issue. Eurostat issues around 150 Statistics in Focus per year. Available as single copies or on subscription.
ÜÉB
Paper PDFKey i n d i c a t o r s : This collection provides the main indicators on a theme or subtheme in an easytocarry booklet of up to 100 pages. Available as single copies or on subscription.
Paper Html
Panorama of t h e European Union: This collection highlights the features and trends of a multisectoral theme or a sectoral subtheme. The publications consist of around 200 pages and include analysis as well as tables and graphs. Available as single copies or on subscription.
UH
CDROM PaperMethods and nomenclatures are intended for specialists who want to consult the methodologies and nomenclatures used for a theme, a subtheme or a sector. Available as single copies.
Paper CDROM
Detailed tables are intended for specialists. They present part, or all, of the statistical data compiled on a theme, subtheme or sector. Available as single copies or on subscription.
Paper CDROM
Studies and research summarise the results of European statistical studies and research and are intended for specialists. Available as single copies or on subscription.
Paper CDROM
Catalogues provide rapid access to concise information on Eurostat's products and services. They are free of charge and include the Mini guide, a selection of Eurostat products and services, and Statistical references, the quarterly newsletter on Eurostat's latest products and services.
w
Ui
Statistics
on
audiovisua
services
Data 1980-1998
* * *
E U R O P E A N C O M M I S S I O N
I / /Λ Ι £ λ * * Λ 3 Industry,
m
Immediate access to harmonized statistical data
E u r o s t a t D a t a S h o p s :
A personalised data retrieval service
In order to provide the greatest possible number of people with access to high-quality statistical information, Eurostat has developed an extensive network of Data Shops (')·
Data Shops provide a wide range of tailor-made services:
Ά- immediate information searches undertaken by a team of experts in European statistics;
* rapid and personalised response that takes account of the specified search requirements and intended use;
•k a choice of data carrier depending on the type of information required.
Information can be requested by phone, mail, fax or e-mail.
(') See list of Eurostat Data Shops at the end of the publication.
I n t e r n e t :
Essentials on Community statistical news
•k Euro indicators: more than 100 indicators on the euro-zone; harmonized, comparable, and free of charge;
■*■ About Eurostat: what it does and how it works;
·*■ Products and databases: a detailed description of what Eurostat has to offer; * Indicators on the European Union: convergence criteria; euro yield curve and further
main indicators on the European Union at your disposal; • Press releases: direct access to all Eurostat press releases.
For further information, visit us on the Internet at: W W W . e u r o p a . e U . i n t / C O m m / e u r O S t a t /
A great deal of additional information on the European Union is available on the Internet. It can be accessed through the Europa server (http://europa.eu.int).
Cataloguing data can be found at the end of this publication.
Luxembourg: Office for Official Publications of the European Communities, 2000 ISBN 92-894-0434-5
© European Communities, 2000 Printed in Luxembourg
eurostat
EUROSTAT
L-2920 Luxembourg — Tel. (352) 43 01-1 — Telex COMEUR LU 3423 Rue de la Loi 200, B-1049 Bruxelles — Tel. (32-2) 299 11 11
Eurostat is the Statistical Office of the European Communities. Its task is to provide the European Union with statistics at a European level, that allow comparisons to be made between countries and regions. Eurostat consolidates and harmonizes the data collected by the Member States.
To ensure that the vast quantity of accessible data is made widely available, and to help each user make proper use of the information, Eurostat has set up a publications and services programme.
This programme makes a clear distinction between general and specialist users and particular collections have been developed for these different groups. The collections Press releases, Statistics in focus. Panorama of the European Union, Key indicators and Catalogues ate aimed at general users. They give immediate key information through analyses, tables, graphs and maps.
The collections Methods and nomenclatures, Detailed tables and Studies and research suit the needs of the specialist who is prepared to spend more time analysing and using very detailed information and tables.
All Eurostat products are disseminated through the Data Shop network or the sales agents of the Office for Official Publications of the European Communities. Data Shops are available in 12 of the 15 Member States as well as in Switzerland, Norway and the United States. They provide a wide range of services from simple database extracts to tailor-made investigations. The information is provided on paper and/or in electronic form via e-mail, on diskette or CD-ROM.
As part of the new programme Eurostat has developed its website. It includes a broad range of on-line information on Eurostat products and services, newsletters, catalogues, on-line publications as well as indicators on the euro-zone.
This report was prepared at Eurostat under the responsibility of
François De Geuser, Head of Unit D1 - "Classifications. Methodological coordination. Registers, Information
Society, Tourism and Steel".
General Co-ordination
Douglas Koszerek, Eurostat
Richard Deiss, Eurostat
Production, statistical analysis, methodological description and analysis, data collection & network
co-ordination
Christian Simon-Lacroix (World Systems)
Data base processing, desk top publishing, technical assistance
Josiane Poos (World Systems)
The views expressed in this publication are those of the authors and do not necessarily reflect the official
opinion of the European Commission.
For further information on the statistics in this publication, please contact:
Richard Deiss:
Tel. (+352) - 4301 - 33805
Fax. (+352)- 4301 - 39888
E-mail: richard.deiss(q)cec.eu.int
Christian Simon-Lacroix:
Tel. (+352)-423113-646
Fax. (+352)-434431
Acknowledgements
Eurostat gratefully acknowledges the valuable contributions of all national institutes and other professional
bodies. This comprehensive reference document on audiovisual services for the EU and EFTA Member States
would not have been possible without their data collection and analysis, and continuous advice.
CONTRIBUTORS
Co-ordination with Member States
C.
Simon-Lacroix
Belgium
Institut National de Statistique
Communauté Française de Belgique / Ministère de la Culture et des Affaires Sociales
Denmark
Danmarks Statistik
Germany
Statistisches Bundesamt
Deutsches Institut für Wirtschaftsforschung (DIW)
Greece
National Statistical Service of Greece (NSSG)
Hellenic Audiovisual Institute (lOM)
Spain
Instituto Nacional de Estadística (INE)
France
Direction du Développement des Médias (former Service Juridique et Technique de l'Information et de la
Communication)
Centre National du Cinéma (CNC)
Ireland
Central Statistics Office (CSO)
Italy
Istituto Nazionale di Statistica (ISTAT)
Società Italiana Autori ed Editori (SIAE)
Luxembourg
Service Central de la Statistique et des Etudes Economiques (STATEC)
Ministère d'état (Service des Médias et de l'Audiovisuel)
Netherlands
Centraal Bureau voor de Statistiek (CBS)
Austria
Statistik Österreich (former Österreichisches Statistisches Zentralamt - ÖSTAT )
Österreichischer Rundfunk (ORF)
Portugal
Instituto Nacional de Estatistica (INE)
Instituto da Communicacão Social (ICS)
Finland
Statistics Finland
Sweden
Statistics Sweden
NORDICOM Sweden
United Kingdom
Department for Culture, Media and Sport (DCMS)
British Film Institute (BFI)
Screen Digest (SD)
Iceland
Statistical Bureau of Iceland
Norway
Statistics Norway
Switzerland
Office Fédéral de la Statistique
Others:
Preface
v _ ~ ~ ..<-r - · — - · _ -τ ;s.: :::.::;""" r"-'"-?-■■'■- ' ; «'">:'= """'; . . . . . .
Over the past 20 years the audiovisual sector has changed rapidly. The EU has for many years now, actively
promoted policies to develop and stimulate the European audiovisual sector. The activity of the European Union
has resulted in, among others, Council Decisions on the MEDIA programmes I and II and recently MEDIA Plus
(adopted in December 2000) and the "Television without frontiers" Directive adopted by the European
Parliament and the Council in summer 1997. In addition, the "White Paper on Growth, Competitiveness,
Employment" identified the audiovisual sector as main component of the information society and thus central to
the development of the European economies and societies.
Comprehensive structural data are needed in order to monitor developments in this complex and rapidly
changing sector.
To meet these needs, the Council Decision (1999/297/EC) on audiovisual statistics was adopted on 26 April
1999 with the aim of establishing a Community statistical information infrastructure relating to the industry and
markets of the audiovisual and related sectors.
Over the past few years, the Statistical Office of the European Communities has been elaborating a statistical
information system on Audiovisual Services, called AUVIS (i.e. AUdioVisual Information System). The system is
based on the AUVIS overall methodological manual currently developed in cooperation with the EU and EFTA
Member States, and is used for collecting and disseminating existing statistics. The AUVIS system aims to
include quantitative and qualitative information on 13 AUVIS market segments such as Audiovisual Services
(business statistics), audiovisual production, audiovisual distribution, cinema exhibition, video, television, sound
recordings, radio, cable and satellite, radioandTV signal transmission.
Developing statistics on the Audiovisual sector requires expertise in several fields and takes considerable time.
In 1999 and 2000, the AUVIS data collection has been extended and an AUVIS section has been integrated
progressively in the Eurostat reference dissemination database "New Cronos" covering 10 of the 13 of the
AUVIS market/sections and 22 countries.
This new publication "The Audiovisual sector in the EU (Data 19801998)", which is based on the 1999 AUVIS
questionnaire is divided into 9 parts, which cover the following aspects: audiovisual production and distribution,
cinema exhibition, video, television, cable and satellite, sound recordings, radio, Audiovisual Services (business
statistics). It also includes general information on other domains (including basic indicators and information
technologies). The publication covers 22 countries (i.e. 15 EU countries, Iceland, Norway, Switzerland and 4
nonEuropean countries). The aim of this publication is to provide a statistical overview on the audiovisual
sector based on the statistical work carried out at Eurostat in cooperation with 15 EU and 3 EFTA countries,
the European Audiovisual Observatory and the sectoral organisations.
Contents
...
Introduction to the statistical tables 1
Part 1: Cinema production and distribution market
Overview 5
Total number of cinematographic full-length films produced 7
Number of national cinematographic full-length films produced 8
Number of international co-productions of cinematographic full-length films 9
Number of majority international co-productions 10
Number of cinematographic full-length films produced (including national films and majority
international co-productions 11
Number of cinematographic short length films produced 12
Number of film distributors with at least one first release during the year 13
Variable description, footnotes and sources 14
Part 2: Cinema exhibition market
Overview 23
Number of cinema sites 27
Number of cinema sites with 8 or more screens (multiplexes) 28
Number of screens (cinema halls) 29
Average number of screens per cinema site 30
Cinema income from gross box office receipts (incl. taxes and other duties) 31
Cinema income from gross box office receipts from national cinematographic films 32
Share of gross box office receipts from national cinematographic films 33
Cinema income from gross box office receipts from US cinematographic films 34
Share of gross box office receipts from US cinematographic films 35
Number of new feature films released for the first time 36
Number of new feature films released for the first time of national origin 37
Number of new feature films released for the first time of US origin 38
Number of cinema admissions (cinema audience) 39
Average number of cinema admissions per screen 40
Average price per cinema ticket 41
Number of cinema seats 42
Average number of seats per cinema screen 43
Variable description, footnotes and sources 44
Part 3: Video market
Overview 63
Receipts from sales and rentals of pre-recorded videos (retail level) 67
Receipts from sales of pre-recorded videos (retail level) 68
Receipts from rental of videos (retail level) 69
Share of pre-recorded video sales in total receipts from sales and rental 70
Share of video rental in total receipts of sales and rental 71
Part 3: Video market
(Continued)
Number of video rental transactions (retail level 72
Number of pre-recorded videos sold (retail level 73
Number of VCR households 74
Number of new video titles released for rental 75
Number of new video titles released for sales 76
Variable description, footnotes and sources 77
Part 4: Television market
Overview 89
Turnover of public TV broadcaster of national origin 93
Income from TV licence fees (public broadcasters of national origin 94
Income from TV advertising and sponsorship (public broadcasters of national origin 95
Total number of TV programme services (TV channels 96
Number of public TV programme services with nationwide distribution 97
Number of private TV programme services with nationwide distribution 98
Daily TV viewing time (annual average 99
Number of TV licences (total licence fee accounts 100
Annual price of colour TV licence fee 101
Number of TV households 102
Variable description, footnotes and sources 103
Part 5: Cable operating market and satellite (broadcasting) transmission market
Overview 115
Number of households connected tocable networks 117
Number of households passed by operated cable networks 118
Number of households connected to satellite dishes 119
Variable description, footnotes and sources 120
Part 6: Sound recordings market
Overview 125
Total receipts from sound recordings sales 129
Total number of sound recordings sold 130
Number of singles sold (Vinyl, CDs, MCs 131
Number of LPs sold 132
Number of CDs sold 133
Number of MCs sold 134
Share of singles sold (of total sound recordings sold 135
Share of LPs sold (of total sound recordings sold) 136
Share of CDs sold (of total sound recordings sold) 137
Share of MCs sold (of total sound recordings sold) 138
Average number of sound recordings sold per inhabitant 139
Part 7: Radio market
Overview 153 Total number of radio programme services (radio stations) of national origin 155
Number of radio programme services of national origin with nationwide distribution 156 Number of private radio programme services of national origin with nationwide distribution 157
Daily listening time of adults (annual average 158 Variable description, footnotes and sources 159
Part 8: Audiovisual services (Business statistics)
Overview 165 Number of motion picture and video services enterprises 167
Number of radio and television services enterprises 168 Turnover of motion picture and video services enterprises 169 Turnover of radio and television services enterprises 170 Number of persons employed in motion picture and video services enterprises 171
Number of persons employed in radio and television services enterprises 172 Number of employees in motion picture and video services enterprises 173 Number of employees in radio and television services enterprises 174
Variable description, footnotes and sources 175
Part 9: General information from other domains
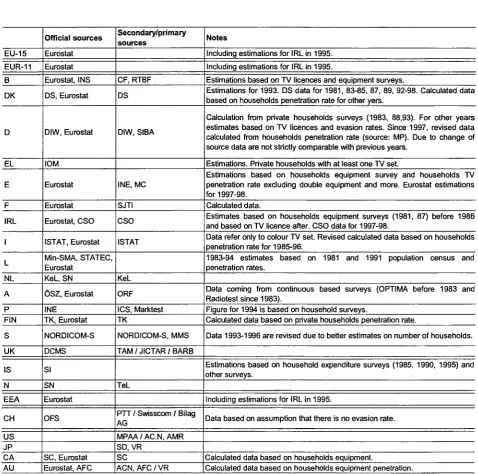
Overview 185 Number of private households 187
Number of inhabitants 188 Total advertising expenditure 189 TV advertising expenditure 190 Radio advertising expenditure 191 Cinema advertising expenditure 192 Number of PCs per 100 inhabitants 193 Number of Internet hosts per 100 inhabitants 193
Variable description, footnotes and sources 194
Annex 1:
General symbols and abbreviations used in this publication 205
Annex 2:
List of abbreviations and acronyms concerning sources used in the publication 209
Annex 3:
ECU exchange rates 221
Introduction to the statistical tables
This publication aims to provide comprehensive statistical information on the audiovisual sector in the EU, EFTA
and some important non-European OECD countries. The 78 statistical tables presented in this publication
include 3 levels of information:
• Statistics covering the period 1980-1998
• Information on the various sources used (official sources, national sources, others)
• Methodological information for each table, including general methodological information describing the
indicator used, information on specific concept(s) and methodological footnotes on data gathered.
In the first part of each of the 9 sections presented, there is a set of detailed tables of statistics for the 15 EU,
3 EFTA and 4 non-European countries, including 3 aggregates (EU-15, EUR-11, EEA). At the end of each
section there is for each statistical table methodological information (description of the variable used, summary
table of sources and footnotes).
The 78 indicators presented are classified according to the audiovisual sector information structure developed
and defined in the overall AUVIS methodology, of which 9 selected sections are presented here:
1) Cinema production and distribution market,
2) Cinema exhibition market,
3) Video market
4) Television market
5) Cable operating market and satellite (broadcasting) transmission market
6) Sound recordings market
7) Radio market
8) Audiovisual services - Business statistics
9) General information from other domains
According to data availability, the presented sets of tables refer to some selected information topics classified in
the AUVIS methodology under the "family of variables" concept developed by Eurostat in co-operation with
Member States. The data presented here cover the following information aspects: economic data, qualitative
and structural data on markets, international trade, volume data relating to the supply side, data on prices, data
on service quality, data on the demand structure, data on technical infrastructure and basic data from other
domains.
PARTI
Cinema production and
distribution market
Cinema production and distribution market
Overview
The compilation of consistent statistics on film production on a national and European level is difficult, as
international coproductions form an integral part of film production in today's Europe. The volume of feature film
production cannot be described accurately without treating international coproductions separately when
analysing total production at national level. When aggregating national results at European level double
counting can occur. In international coproductions difficulties are caused e.g. by the limited availability of data
and by varying criteria and definitions used at national level to assess the production and origin of the film. The
same international coproductions are counted in several countries, however, not at the same time and not in
the same way. For these reasons, in this section, only production of entirely domestic film (national films) and
majority coproductions will be studied (depending on information availability).
Number of cinematographic full-length films produced (including
national films and majority international co-productions)
in the European Union, 1980-98
560 540 520 500 480 460 440 420 400 380 360 340 320 300
■ï
:
*
7
'
—
*
■_ ■ - - ■ - ■ — ■
>- ■ ■--■.,
f
80
84 8586
87
88 89 90 9192
93 94 95 9697
98
♦ National films + majority international coproductions
of which: 100% national
EU15 total includes reunified Germany since 1991.
Concerning national films and majority international coproductions, EU15 total excludes Β (1989) and IRL (1998). Concerning national film productions, EU15 total excludes L (1980), IRL (1984, 1998) and Β (1989, 92).
Source: Eurostat.
The decline and rise of EU feature film production (national and majority co-productions)
In the last two decades the volume of feature film production in the EU saw a general decline until 1994 and a
recovery from the second half of the 1990s. Between 1985 and 1994, the total feature film production in the
European Union decreased from 498 films to 437 films (12.2%). The decline in this period was especially sharp
in Sweden (41.2%) and Greece (39.4%), whereas in Ireland (+200.0%) and Portugal (+100.0%) fulllength film
production grew strongly.
After 1994, the total film production in the EU countries started to increase (19941998: +20.4%). The growth in
the number of feature films produced was the highest in Portugal (+300.0%) and France (+66.3%). A total of
525 films (excluding Ireland) were produced in 1998 in the EU, 88 films more than in 1994. Growth took off in
1996 with an increase of 70 films compared to the previous year.
Cinema production and distribution market
■.■λϊίτ-.-ζζ,^ <<%·■;■.■?.
Comparison with the United States and Japan
Measured in number of full-length films produced the EU output is smaller than the production of the United
States (652 national films in 1998), which had remained relatively stable between 1995 and 1998 (-1.2%). The
US domestic film production has accounted for between 96.0% to 98.5% of total US production in the late
1990s. The US industry, especially the big film studios, is highly international and operates in the global market,
but co-productions occur rarely. Particularly the studios use various forms of co-financing arrangements and
pre-buy deals.
The Japanese film industry produced 241 films in 1998, half the EU volume. It is very rarely engaged in
international co-productions, there are only a couple of international co-productions each year. Between 1980
and 1998, the feature film production in Japan decreased by 23.7%.
National film production (entirely domestic production of feature films)
The share of films in the EU that are made as 100% national production is tending to decline. Over the period
1980 to 1995 the volume of films produced completely by domestic enterprises (national films), decreased from
510 films (excluding Luxembourg) to 325 films (-36.3%). The fall was sharpest in Portugal (-75.0%) and France
(-56.3%), whereas in Austria (+233.3%) the national film production grew considerably between 1980 and 1995.
A recovery commenced in 1996 with a sharp rise in the number of national films produced, i.e. 85 films more
than the previous year. The EU national full-length film production increased between 1995 and 1998 to a total
of 411 films (+26.5%, excluding Ireland).
International majority co-productions
In 1985 majority co-productions accounted for roughly 13.3% of total EU feature film production, in 1991 for
23.0% and in 1995 for 29.4%. Since 1996 their share stabilised to an average of 22.5% of total EU feature film
production. National and supra-national subsidy incentives aimed at advancing film production have contributed
to the increase in co-production activity. Several European Union incentives started around 1990 (e.g.
Eurimages in 1989 and Media I in 1990 followed by Media II in 1996) have helped to stimulate the development
of European co-productions. The second Media programme focuses on three key areas: training, the
development of potentially successful works and international distribution of films and audiovisual programmes.
Diversification of the film distribution system
During the 80s and 90s the diversification of film distribution systems was also important for feature film
production. The growth in the number of television channels (e.g. commercial terrestrial channels and cable and
satellite channels) increased the broadcasting volume dedicated to feature films, as many channels made
cinematographic films one of the central parts of their programme schedules. Some of the new pay-TV theme
channels concentrated entirely or almost entirely on films. Broadcasters also became more interested in
financing feature films. Furthermore, a completely new distribution channel for films emerged at the beginning of
1980s when renting films on videocassettes started. In the 1990s, selling films on videocassette took off and it
quickly became a major film distribution channel. For production enterprises, these changes meant more
potential resources or revenues from their films and increased the value of film rights.
Total number of cinematographic full-length films produced
Cinema production and distribution market
ËÜ-15 EUR-1-Γ Β DK D EL E F IRL I L NL A Ρ FIN S UK IS Ν ÈEA CH US JP CA AU ÈU-15 EÜRTf Β DK D EL E F IRL I L NL A Ρ FIN S UK IS Ν EEA CH US JP CA AU
Source: &
\m
1980 • · ■ 5 13 49 27 118 189 163 6 10 9 10 20 31 3 10 " .222 320 54
1991
S I
. v™.:.:™?".:.::.'-■: 3 12 72 15 64 144 1 129 4 13 13 9 12 30 46 1 10 '. 31 583 230 36 28 ¡rostat. 1984 : ■■· 8 12 75 28 75 161 103 1 11 16 8 19 23 44 4 5 . . 43 365 333 44 1992
:C'::.iL.:r ■
"' ~-13 12 63 14 52 144 4 127 1 18 17 8 10 19 42 6 8
" . ' : * " " > ' ■ - " ■\ : ~ : "■"-'
36 519 240 56 34 1985 . 7 11 64 33 77 151 2 89 1 13 10 3 13 20 47 3 10 - . 44 356 319 58 1993
û ::: $■: ■
yr"~r^iif\\i:·:' '??—"·'■'.
10 19 67 18 56 137 6 106 2 19 17 16 13 19 60 2 14 . 34 605 238 31 25 1986 . ' '. 5 13 60 27 60 134 4 109 1 13 9 5 21 27 35 2 9 -J "'-:'. 36 530 311 26 1994 :.:·
' · ■ : . · ■ '"' . - ■ ■ ■ . .
15 15 60 20 44 111 19 95 3 12 16 9 11 20 70 2 18
■ " ' '·.
37 635 251 44 31 1987 . ..:_ . 12 12 65 26 69 133 4 116 1 19 12 6 13 21 48 1 7 ,.y- .
32 573 286 34 1995 ..· ■ . 10 12 63 26 59 129 20 75 3 18 30 14 8 24 76 7 22 ■; ■. 38 697 289 38 19 1988 . ■ ;'. 15 17 57 15 63 137 5 124 1 11 6 7 10 21 40 2 9 -. 24 617 265 34 1996 • 12 23 64 27 91 131 15 99 5 18 13 8 10 27 111 2 15 :''"'. 41 715 278 53 30 1989 . . 18 68 10 48 136 3 117 4 18 10 7 10 33 27 2 10 ".·!'·.'. · 31 508 255 46 26 1997
JIL
¿LÆTr
8 19 61 20 80 158 16 87 5 15 15 10 10 30 108 4 17. ; ; ■ , : · . ■ >
29 676 278 61 36 1990 '¿
y
12 15 48 13 47 143 '3 119 1 17 20 8 13 16 47 2 10 >:". 32 477 239 42 40 1998Ï, . . ' " : , MÍ
\-.-_.'ii 7 23 50 22 65 180 17 92 10 18 12 19 9 20 87 2 14 .;.=.; 41 661 249 36 41
Cinema production and distribution market
Number of national cinematographic full-length films produced (with 100% of national origin producers)
EU-15 EUR-11 Β DK D EL E F IRL I L NL A Ρ FIN S UK IS Ν ÍEEAS CH US JP CA AU
IIII 3
EÜR-1Ï7 Β DK D EL E F IRL I L NL A Ρ FIN S UK IS Ν ËEA CH US JP CA AU Source: EL 1980 510 425 5 13 37 27 82 144 -130 6 6 8 7 17 28 3 10 523 316 1991¡ g 381»
320 -5 53 11 46 73 1 111 2 11 7 5 11 20 24 -9
:_ : ?f
9.
17 230 20 23 rostat. 1984 479 ,:;:;;;¿383
6 12 62 28 63 120 87 1 10 11 8 15 14 42 3 5 487 25 333 1992
* -" ' 3 1 7
8 53 11 38 72 2 114 1 18 12 2 5 11 29 2 5 7383 19 240 25 28 1985 . 4 3 2
Ζ~.
Γ334_
5 8 46 32 65 106 2 81 1 10 5 2 11 17 41 3 10 24 318 54 1993
ΓΓ3Γ7" **9
WS.
289 1 8 50 10 41 67 1 86 1 11 11 9 11 11 31 1 10 360 18 237 22 21 1986Ι 425
332 4 12 45 26 49 97 3 94 1 13 3 4 19 26 29 2 8
3§;435
26 311 19 1994 ,--327| 254 9 8 46 17 36 61 4 71 -9 10 -8 10 38 -13 340 23 249 24 29 1987 449
'ΖΖΙ::Σ1
Μ
7 10 47 26 62 96 1 106 1 16 6 5 11 13 42 1 6 456 21 286 27 1995 ¿ 3 2 5
Τ~ΖΓ^Ί?42
-9 37 19 37 63 5 60 -11 20 2 7 15 40 -16 341 22 660 286 27 17 1988 413 331 4 15 49 14 54 93 2 103 -8 4 5 9 15 38 -9 422 14 265 25 1996 ^ 7 410;JZ?97
2 15 42 21 66 74 1 77 -13 12 2 8 18 59 -10 420 19 672 275 37 25 1989 377 -\_, .303 16 53 8 43 66 1 102 2 14 9 6 7 28 22 1 9 ^ Ζ 387Cinema production and distribution market
Number of international co-productions of cinematographic full-length films with national origin producers
τ . ~ :. n : =_J=_
EU-15 EUR-11J Β DK D EL E F IRL I L NL A Ρ FIN S UK IS Ν
SEmry
CH US JP CA AU È\Ì-Ì5~~ EUR-11; Β DK D EL E F IRL I L NL A Ρ FIN S UK IS Ν ËEA77 CH US JP CA AUSource: Ει
14M
„....■ "tzræ»
1980
[. . ' j l:._C ..„*.
12 36 45 -33 ■ 4 1 3 3 3
-.-. - Ί t._ .j." u;:."-^¿i^V'H.".
4
1991
-, ..
1 : 3 7 19 4 18 71 -18 2 2 6 4 1 10 22 1 1
:IS...;7 '. :'■·
14
16 5
¡rostat.
— ^λ— " 7 ■ ■ '■■
1984 2 13 12 41 16 -1 5 4 9 2 1 18 1992 ^-■^¡gSpSÖ; 4 10 3 14 72 2 13 5 6 5 8 13 4 3 17 31
e
1985- - ™ 7 ~! V— ■
-2 3 18 1 12 45 -8 -3 5 1 2 3 6 ■ 20 1 4 1993
" ' — ■ —
9 11 17 5 15 70 5 20 1 8 6 7 2 8 29 1 4 16 1 9 4
~ . _ a i _ . i r i ^ ■ '
1986 : ¿ · 1 1 15 1 11 37 1 15 -6 1 2 1 6 ■ 1 . 10 7 1994
.":. WÈ3ÊEË
6 7 14 3 8 50 24 3 3 6 9 3 10 32 2 5 . ' _ . ■ 14 2 20 2— ; ? * ; : _ . : „ _ . , ^ „ : ; r
1987
7 áfeiiüi:
5 2 18 -7 37 3 10 -3 6 1 2 8 6 -1 11 7 1995. -. : I ■··
8 3 26 7 22 66 15 3 7 10 12 1 9 36 7 6 J - - -_„-■■■*-_ 16 37 3 11 2 r_.,~.:.r 1988
„::.".:■ . . . A : i :
11 2 8 1 9 44 3 21 1 3 2 2 1 6 2 2 10 9 1996 . ·
ilPieii
68 22 6 25 57 22 5 5 1 6 2 9 52 2 5
'7
22 43 3 16 5: „ « . . _ i . . l
1989
,. ,„ , r. ^ .
IISI
2 15 2 5 70 2 15 2 4 1 1 3 5 5 1 1 12 11 5 1997 5 8 14 4 25 72 16 5 7 3 6 2 11 40 4 9 ·, ~ ■ 13 13 3 19 4 1990 ^-_. ^- -„ ;.— iiir'.Tli' ΛE J
9 -10 1 10 62 '1 21 -4 5 3 3 6 8 2 1: " _ . ' ■ ·:
10 17 10 1998 ·'
111D3&
6 8 11 6 20 78 13 10 5 5 7 5 7 2 5. : . . . . ■ . . ■ · . . . t_:·
22 9 8 15 4
Cinema production and distribution market
Number of majority international co-productions (international co-productions of cinematographic full-length films with national origin producers as majority producers)
1980 1984 1985 1986 1987 1988 1989 1990
EU-15 Β DK D EL E F IRL I L NL A Ρ FIN S UK IS Ν 12 24 16 33 2 13 6 16 16
7777SI: 7'
. : '-■. :,._..,.: 2 1 18 1 7 25::.-. SÊ·
. 7 7.7. J
1 1 15 1 6 15 15 2 2 18 5 17 10 5 2 8 1 5 22 21 2 15 2 4 35 2 15 10 1 5 25 21 ΕΕΑ CH US JP CA AU
:'■.-·■
-'TF^TTZiS'-..::..iî.'i 'MME
11 7
; 3
1991 1992 1993 1994 1995 1996 1997 1998
É u v f r E Ü R T Í Í
Β DK D EL E F IRL I L NL A Ρ FIN S UK IS Ν ΕΕΑ" CH US JP CA AU ΐ-14
im
1 5 19 4 11 35 18 3 2 1 15 1 7977 85 5 3 10 3 8 41 2 13 1 5 6 4 2 103 4 5 3 17 5 34 1 20 1 2 2 19 1 3 2 4 14 3 28 2 24 1 6 4 3 17 2¡SU
TÏ7
3 2 26 7 19 34 3 15 10 6 1 11 7 6 150 3 7123 95 1 4 22 6 10 30 5 22 1 2 2 18 2 3 Í28 2 5 14 4 13 39 2 16 4 2 20 4 4 4 3 11 6 9 46 13 2 10 1Source: Eurostat.
Cinema production and distribution market
Number of cinematographic full-length films produced (including national films and majority international co-productions)
— "-'" '~
IV
_ —— .— — i _ 1980 15 5 > · : 7 r-ËÉrà
l U R ^ L l · :
1 1
Β DK
D 49
EL E 106 F 160 IRL I 163 L
NL 6
A Ρ
FIN 10
S 17
UK 28
IS 3
Ν
ΕΕΑ >.;■ ■■·;.■.... ..t.: CH US JP 316 CA AU 17 JÜ-15~ ÎEUJ 1991 495
M l
- 4 1 *
Β 1
DK 10
D 72
EL 15
E 57
F 108
IRL 1
I 129
L 2
NL 12
A 10
Ρ 7
FIN 12
S 20
UK 39
IS 1
Ν
ΕΕΑ 505
CH 20
US
JP 230
CA 20
AU 27
Source: E
-
'r
urostat.
—^ — ..·.--1984 , . ., , „.
, ί ; · ' / . ' . ' ; * ! y ■ ' I,"' ' ".
8 75 69 136 103 1 11 19 14 42 4
jri'¿¿;7í:—'"■'"."■ ■ ■ ■ ;.,""■ :
333 21 1992
477 ^ ^ , ^ 4 0 6
11 63 14 46 113 4 127 1 18 13 2 10 11 35 6 7 777490 23 240 25 30
L L ^ T T . É i m — r . _
1985
1498
7777Z39?
7 9 64 33 72 131 2 89 1 12 2 13 17 41 3. 511 35 318 54 34 1993
" 4 6 5 375 6 11 67 18 101 2 106 2 15 13 9 13 11 50 2 13 480 20 237 22 23 ———————-1986 400 5 13 60 27 55 112 4 109 1 13 6 5 21 26 29 2 8 496 31 311 19 42 1994
~ 4 3 7 "340 11 12 60 20 89 6 95 1 11 16 4 11 10 55 2 15 454 24 249 24 29
—~·— " '"'—■ "
1987
7 7
r„ 5 l 4
¿421 9 12 65 26 67 113 4 116 1 18 9 6 13 13 42 1 7 p 522 27 286 27 30 1995 7466 " 3 6 3 3 11 63 26 56 97 8 75 -15 30 8 8 15 51 7 22 : 495 25 660 286 27 18
^ „ . ¿ τ : * s-^z-rr-z· .—,·=. _ ™ " _ ' .
1988 486
WSõf
9 17 57 15 59 115 5 124 -10 5 7 10 15 38 2 497 21 265 25 40 1996 "536 395 3 19 64 27 76 104 6 99 -16 13 4 10 18 77 2 13 "551 672 275 37 25~ i· " ' " * —' ■ — · -
-1989 459 381 18 68 10 47 101 3 117 2 16 10 7 10 28 22 2 10
7 471
24 255 35 21 1997 5337 7 39Õ
3 16 61 20 68 125 4 87 12 8 10 19 88 4 12
ffifeSìi54?
662 275 42 34 1990 454 "777377; 7 15 48 13 42 106 •3 119 1 15 16 7 13 10 39 2 -.:'_465j 25 239 25 34 1998 5257390
5 18 50 22 54 148 92 2 16 16 8 13 74 2 536 652 241 31 38Cinema production and distribution market
Number of cinematographic short length films produced
1980 1984 1985 1986 1987 1988 1989 1990
EU-15 ËUR-11 Β DK D EL E F IRL L NL A Ρ FIN S UK IS Ν
IfPiîlîII,
CHus
JP CA AU -: - ~- ' :7-7 7. ..7,7 '■' l 64 43 164 258 429 227 46 122 11 1 85 62 48 244 81 572 658 43 78 9 1 58 29 51 216 90 162 476 160 385 28 121 10 1 77 58 41 148 84 90 540 188 41 45 168 87 86 484 152
22 20
270 26 76 10 0 56
:
260 24 77 12 1 68ÉÜÜIPa
■ Γ" '■■■ 'γ
kkk, ,
-7
85 41 145 106 61 443 160 298 59 11 4 59■'■·' ': '''~:i--V.' ·
7v7.
:κ.\
7
„... _.. 12 60 122 115 85 346 138 1 80 10 1 99
:
■;57J
':e¿3.
37 76 156 130 98 366 146 2 6 57 8 1 83ι
26 33 41 41 34
24
1991 1992 1993 1994 1995 1996 1997 1998
EU-15 ; TÊÜR-117 Β DK D EL E F IRL I L NL A Ρ FIN S UK IS Ν ΕΕΑ CH US JP CA AU
Source: Eurostat. 77 66 151 61 83 346 117 0 9 65 10 1 202 ;7".7^F.;'-i*T^ 58 8 47 122 65 110 415 72 4 10 389 2 35 12 60 159 76 65 366 64 0 12 261 6 35 7 21 142 59 76 456 59 1 16 346 6 35 5
17 17
20 26 52 140 94 415 27 1 271 2 25 3 150 18 33 10 110 65 87 423
7.7
:
7 Œ
■; ', ■.:.■.■' i.1.1.- :::.rzi.r¿zr*Γ?'.·."ΙΙ*.Ί2Χ.Ί.™."'.'"Ι
--"- 7 ; *■:■ ·--. .-·*';
Cinema production and distribution market
Number of film distributors with at least one first release during the year
1980 1984 1985 1986 1987 1988 1989 1990
EU-15 ËÜR-Ï1 Β DK D EL E F IRL I L NL A Ρ FIN S UK IS Ν EEA|7S CH US JP CA AU 180 23 25 22 63 186 24 30 24 53 186 25 32 27 61 176 23 32 21 168 25 24 27 54 167 23 26
v.,: .ι::. .:■ 7 Í Í - V --'■
25 22 60 164 27 13 26 20 20 27 21 47 162 26 13 20 15 21
1991 1992 1993 1994 1995 1996 1997 1998
EÜJ57¿
Β DK D EL E F IRL I L NL A Ρ FIN S UK IS Ν ΕΕΑ CH US JP CA AU 25 19 55 164 27 13 19 7 19 18 25 16 48 55 163 23 16 20 7 19 21 16 23 19 56 26 163 25 14 20 7 15 7 12 387 28 19 58 8 28 155 20 1 15 19 7 11 18 7 11 405 40 18 409 360: 28 17 46 6 50 164 8 20 1 14 20 7 10 18 7 12428
42 20 411 366_: 30 20 45 9 42 163 6 22 1 17 17 12 11 16 10 12 433 33 43 168 23 409366
33
18
51
g
45
156
9
23
18
17
13
16
7
14
43Ö
36
43
24
-~:. *. · -:'27
53
161
23
23
16
12
19
8
13
5£^:7~"-7 '- \™7**:
40
27
Source: Eurostat.
Cinema production and distribution market
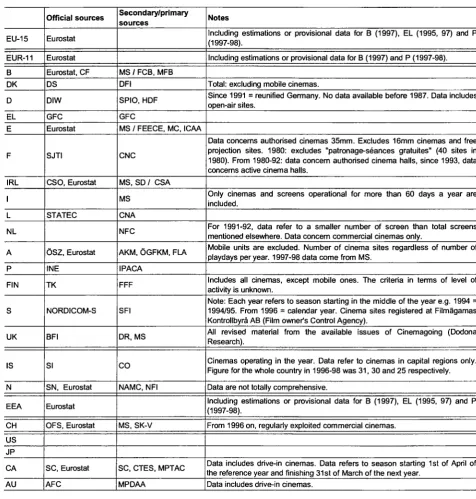
Total number of cinematographic full-length films produced:
Production of new fulllength fiction and animated films produced (with duration of 60 minutes and over), primarily intended for theatrical release, finished during the reference year. This category includes 100% national films and international coproductions (i.e. films coproduced by national producers with foreign producers, whether national producers are majority producers or minority producers). Excludes documentaries (if possible). Excludes domestic production of entirely foreign films etc.
EU15
EUR11
Β
DK
D
EL
E
F
IRL
I
L NL A Ρ
FIN
S
UK
IS
Ν
ΕΕΑ
CH US JP
CA
AU
Official sources
Eurostat
Eurostat
CF
StBA, Eurostat
NSSG, Eurostat, UNESCO INE, MC, Eurostat
SJTI
CSO, Eurostat
STATEC SN
ÖSZ, Eurostat ICAM
TK
SFI, NORDICOMS
DCMS
SI
SN, Eurostat
Eurostat
OFS, OFC
SJ, Eurostat
SC, TC, Eurostat
AFC, Eurostat
Secondary/primary sources
MAEc, CIRECC
DFI
SPIO
PIGD, MS / GFC, MDH
ICAA
CNC
MAC, IFI, MS
ANICA
CNA, MinSMA NFf, NFC ÖSZ, ÖGFKM
FFF
BFI / SD
IFF
NFI
OFC
SD, Variety, MPAA SJ / EIREN
SC, SODEC
AFC / NSWFC, SAFC, VFC, AFFC
Notes
Not applicable because of double counting concerning international co productions.
Not applicable because of double counting concerning international co productions.
Data include only French Community films since 1998.
Includes all films (100% national, international coproductions including off shore coproductions); count of all films (documentary and fiction) of minimum 60 min given a theatrical premiere in DK.
Since 1991 = reunified Germany. Only new longlength feature films produced and released. Excludes documentary long films (1994: 19; 1995: 24; 1996: 25). Since 1998, data refer to films released during the year.
198081 approved by censor for public showing in the year indicated. Provisional data for 1998.
Data concerns films that have received an investment certification with a subsidy in view during the reference year. Since 1990, excluding foreign films which received subsidies in the framework of selective support (ECO fund and SUD fund).
Data refer only to films which have been passed the Censorship Commission. Data refer to feature films with duration > 60 min (fictions or documentaries). Data refer to national and majority international co productions only.
Provisional data for 1998.
Includes fiction and animations excludes documentaries. Before 1998 includes national films and majority international coproductions only. Data concern films produced and released during the reference year. 1980 98: each year refers to season starting in the middle of the year e.g. 1984= 1984/85. From 1996 = calendar year.
Data exclude foreign films produced in UK (e.g. US films) when information available.
Premiered fiction and animated films. Assessment for nationality of films which is used here as follows: nationality of main producer, nationality of director and language used.
Films produced and/or released during the year. Provisional data for 1998.
Not applicable because of double counting concerning international co productions.
For recent years, data concern feature films of 60 min and over. Data includes films never released on cinema screens. New films released.
Data refers to season starting 1st of April of the reference year and finishing 31st of March of the next year. For 1998, data refer to Quebec production only.
Data refer to films which have commenced principal photography in the reference season starting 1st of July of the year x1 and finishing 30th of June of the year x.
Cinema production and distribution market
Number of national cinematographic full-length films produced (with 100% national origin producers):
New fulllength fiction and animated films produced entirely by one or several producers of national origin without foreign producers involved as producers or without foreign investments from foreign companies sharing investments and rights of the film.
EU15
EUR11
Β DK
D
EL
E F IRL
I
L
NL A Ρ FIN
S
UK
IS
Ν
ΕΕΑ
CH
US
JP
CA
AU
Official sources
Eurostat
Eurostat
Eurostat, CF
StBA, Eurostat
NSSG, Eurostat, UNESCO INE, MC, Eurostat SJTI
Eurostat, OBS
STATEC
SN
ÖSZ, Eurostat ICAM TK
SFI, NORDICOMS
DCMS
SI
SN, Eurostat
Eurostat
OFS, OFC
SJ, Eurostat
SC, TC, Eurostat
AFC, Eurostat
Secondary/primary sources
MAEc, CIRECC DFI
SPIO
PIGD, MS / GFC, MDH
ICAA CNC SD, OBS, IFB
AN ICA
CNA, MinSMA
NFf, NFC OSZ, OGFKM
FFF
BFI/SD
IFF
NFI
OFC
SD, MPAA
SJ / EIREN
SD, Variety, VR
AFC
Notes
Excluding L (1980), IRL (1984, 98) and Β (1989, 92).
Excluding L (1980), IRL (1984, 98) and Β (1989, 92).
. ■
Data include only French Community films since 1995.
Since 1991 = reunified Germany. Excludes documentary long films. Since 1998, data refer to films released during the year.
Figures include coproductions for 198081, 8384.
Figures based on Irish filmography since 1993.
Data refer only to films which have been passed the Censorship Commission. Data refer to feature films with duration > 60 min (fictions or documentaries).
Films produced under the "Audiovisual Certificate" Programme and benefiting from national support fund.
Provisional data for 1998.
For 198095: each year refers to season starting in the middle of the year e.g. 1984= 1984/85. From 1996 = calendar year. Includes films having a Swedish producer and significant participation of Swedish artists.
Includes coproductions for 198085 and 1988. Provisional data for 1998.
Excluding L (1980), IRL (1984, 98) and Β (1989, 92).
New films released. For 198184 and 198692, data includes also international coproductions since only a couple of them are made yearly. Estimates. For 1998, data refer to Quebec production only.
Data refer to films which have commenced principal photography in the reference season starting 1st of July of the year x1 and finishing 30th of June of the year x. National production according to AFC.
Cinema production and distribution market
Number of international co-productions of cinematographic full-length films with national origin producers:
New long length fiction and animated films produced by one or several producers of national origin (acting as majority or minority producers) with foreign enterprises as producer sharing investments and rights of the films. Excludes entirely foreign films produced or shot within the national territory.
For some years, international coproductions do not cover all the components described above. (E.g. in some countries, minority international coproductions may not be included in the statistics).
EU15
EUR11
Β DK
D
EL
E
F
IRL
I
L
NL A Ρ
FIN
S
UK
IS Ν
ΕΕΑ
CH
US JP CA
AU
Official sources
Eurostat
Eurostat
Eurostat, CF
StBA, Eurostat
Eurostat, UNESCO
INE, MC, Eurostat
SJTI
Eurostat
STATEC
SN
OSZ, Eurostat ICAM
TK
SFI, NORDICOMS
DCMS
SI
SN, Eurostat
Eurostat
OFS, OFC
SC, TC, Eurostat
AFC, Eurostat
Secondary/primary sources
MAEc, CIRECC DFI
SPIO
GFC, MDH
ICAA
CNC
SD, OBS, IFB
ANICA
CNA, MinSMA
NFf, NFC ÖSZ, ÖGFKM
SOFC, FFA
BFI / SD
IFF NFI
■ .
OFC
SD, MPAA SD, EIREN SD, Variety, VR
AFC
Notes
Not applicable because of double counting concerning international co productions.
Not applicable because of double counting concerning international co productions.
Data include only French Community films since 1995.
Since 1991 = reunified Germany. Excludes documentan/ long films. Since 1998, data refer to films released during the year.
For 199091, 93, 95: International coproductions have been estimated from GFC filmography.
Since 1990, excluding foreign films which received subsidies in the framework of selective support (ECO fund and SUD fund).
Data refer only to films which have been passed the Censorship Commission. Data refer to feature films with duration > 60 min (fictions or documentaries). Data refer to majority international coproductions only. Films produced under the "Audiovisual Certificate" Programme and benefiting from national support fund.
Provisional data for 1998.
Before 1990: estimates based on Finnish film archive statistics and Finnish national filmography. It may be that for some films the date of release does not corresponds exactly with the production year. Before 1998 includes majority international coproductions only.
For 198085: each year refers to season starting in the middle of the year e.g. 1984= 1984/85. From 1996 = calendar year. Includes films having a nonSwedish producer, but at least 20 per cent of the investment capital is of Swedish origin and the contribution of Swedish artists is significant.
Provisional data for 1998.
Not applicable because of double counting concerning international co productions.
New films released.
Estimates. For 1998, data refer to Quebec production only.
Data refer to films which have commenced principal photography in the reference season starting 1st of July of the year x1 and finishing 30th of June of the year x.
Cinema production and distribution market
Number of majority international co-productions (international co-productions of cinematographic full-length films with national origin producers as majority producers):
International coproductions in which national producer(s) have the highest investment share of all participating coprod ucer(s).
Note: Includes 50/50 coproductions (equally shared coproductions) for countries, where information are available.
EU15
EUR11
Β
DK
D
EL E F IRL
I
L NL A Ρ FIN S
UK
IS Ν
ΕΕΑ
CH
US JP CA
AU
Official sources
Eurostat
Eurostat
Eurostat, CF
StBA, Eurostat
Eurostat, NSSG INE, MC, Eurostat SJTI
Eurostat
MinSMA, CNA
ÖSZ ICAM TK
DCMS
SI Eurostat
Eurostat
OFC
SC
AFC, Eurostat
Secondary/primary sources
'-:■: ' . . ■
MAEc, CIRECC
DFI
SPIO
GFC, MDH ICAA CNC SD, OBS, IFB
AN ICA
OSZ, OGFKM
BFI
IFF OBS / NFI
SODEC
AFC
Notes
Excluding NL and S.
.
Excluding NL.
Data include only French Community films since 1995. 198290: estimated based on the origin of the investments as a percentage of total investments.
Estimates. No data exist about majority German coproductions. Since 1998, data refer to films released during the year.
Assuming that all coproductions are majority coproductions. Including equally shared international coproductions.
Figures based on Irish filmography since 1993.
Data refer only to films which have been passed the Censorship Commission. Data refer to feature films with duration > 60 min (fictions or documentaries).
Data refer to films with financed participation of national origin >20%.
Majority coproductions are films in which, although there are foreign partners, there is a UK cultural content and a significant amount of British finance and personnel. Data includes equally shared coproductions when available.
Excluding NL and S.
.
For 1998, data refer to Quebec production only.
Data refer to films which have commenced principal photography in the reference season starting 1st of July of the year x1 and finishing 30th of June of the year x. Data refer to official coproductions in which the Australian involvment is considered as substantial.