QUARTERLY
ECONOMIC
COMMENTARY
SUMMER 201
9
KIERAN MCQUINN,
CONOR O'TOOLE
, MATTHEW ALLEN-COGHLAN
AND PHILIP ECONOMIDES
ECONOMIC
FORECASTING
June
2019
QUARTERLY ECONOMIC COMMENTARY
Kieran McQuinn
Conor O’Toole
Matthew Allen-Coghlan
Philip Economides
Summer 2019
The forecasts in this Commentary are based on data available by 13 June 2019
Draft completed on 14 June 2019
A subscription to the Quarterly Economic Commentary costs €327 per year, including VAT and postage.
© The Economic and Social Research Institute, Whitaker Square, Sir John Rogerson’s Quay, Dublin 2.
ISBN 978-0-7070-0495-2 ISSN 0376-7191
DOI https://doi.org/10.26504/qec2019sum
The Economic and Social Research Institute is an independent research institute working towards a vision of ‘Informed policy for a better Ireland’. The ESRI seeks to support sustainable economic growth and social progress in Ireland by providing a robust knowledge base capable of providing effective solutions to public policy challenges.
The Institute was founded in 1960 by a group of senior civil servants, led by Dr T.K. Whitaker, who identified the need for independent and in-depth research to support the policymaking process in Ireland. Since then, the Institute has remained committed to independent research and its work is free of any expressed ideology or political position. The Institute publishes all research reaching the appropriate academic standard, irrespective of its findings or who funds the research.
The ESRI brings together leading experts from a variety of disciplines who work together to break new ground across a number of research initiatives. The expertise of its researchers is recognised in public life and researchers are represented on the boards and advisory committees of several national and international organisations.
ESRI researchers uphold the highest academic standards. The quality of the Institute’s research output is guaranteed by a rigorous peer review process. Research is published only when it meets the required standards and practices. Research quality has also been assessed as part of two peer reviews of the Institute, in 2010 and 2016.
ESRI research findings are disseminated widely in books, journal articles and reports. Reports published by the ESRI are available to download, free of charge, from its website. ESRI staff members communicate research findings at regular conferences and seminars, which provide a platform for representatives from government, civil society and academia to discuss key findings from recently published studies and ongoing research.
The Commentary is edited by Kieran McQuinn and Conor O’Toole. Kieran McQuinn is Research Professor and Conor O’Toole is a Senior Research Officer at the Economic and Social Research Institute (ESRI). Matthew Allen-Coghlan and Philip Economides are Research Assistants at the ESRI.
Special Articles are published in the QEC in order to foster high-quality debate on various aspects of the Irish economy and Irish economic policy. They are subject to refereeing prior to publication.
TABLE OF CONTENTS
Summary Table ... ii
National Accounts 2018, 2019, 2020 ... iii
CHAPTERS The Irish Economy – Forecast Overview ... 1
The International Economy ... 2
The Domestic Economy ... 20
General Assessment ... 59
Detailed Forecast Tables ... 63
SUMMARY TABLE
2016 2017 2018 2019 2020 Output (Real Annual Growth %)
Private Consumer Expenditure 4.0 1.6 3.0 2.5 2.3
Public Net Current Expenditure 3.5 3.9 6.4 7.0 5.3
Investment 51.7 -31.0 9.8 7.1 7.6
Exports 4.4 7.8 8.9 4.2 4.3
Imports 18.5 -9.4 7.0 6.0 5.9
Gross Domestic Product (GDP) 5.0 7.2 6.7 4.0 3.2
Gross National Product (GNP) 11.5 4.4 5.9 3.4 2.6
Prices (Annual Growth %)
Consumer Price Index (CPI) 0.0 0.3 0.5 1.4 1.7
Growth in Average Hourly Earnings 2.5 1.5 4.2 4.4 4.6
Labour Market
Employment Levels (ILO basis (‘000)) 2,133 2,195 2,250 2,324 2,375
Unemployment Levels (ILO basis (‘000)) 195 158 145 110 102
Unemployment Rate (as % of Labour Force) 8.4 6.7 5.7 4.5 4.1
Public Finance
General Government Balance (€bn) -1.8 -0.8 0.0 -0.7 -1.2
General Government Balance (% of GDP) -0.7 -0.3 0.0 -0.2 -0.3
General Government Debt (% of GDP) 73.5 68.5 64.8 62.8 58.0
External Trade
Balance of Payments Current Account (€bn) -11.4 24.9 29.0 23.2 18.5
Current Account (% of GNP) -5.1 10.7 11.5 8.8 6.7
Note: Detailed forecast tables are contained in an Appendix to this Commentary.
NATIONAL ACCOUNTS 2018
A: EXPENDITURE ON GROSS NATIONAL PRODUCT
2017 2018 Change in 2018
€ bn € bn Value Price Volume
Private Consumer Expenditure 99.9 104.3 4.4 1.4 3.0
Public Net Current Expenditure 29.6 32.0 8.1 1.5 6.4
Gross Fixed Capital Formation 69.0 79.4 15.1 4.8 9.8
Exports of Goods and Services 352.6 383.8 8.9 0.0 8.9
Physical Changes in Stocks 3.5 1.6
Final Demand 554.6 601.1 8.4 0.9 7.4 less:
Imports of Goods and Services 263.3 284.4 8.7 1.0 7.7
Statistical Discrepancy 2.8 1.8
GDP at Market Prices 294.1 318.5 8.3 1.5 6.7 Net Factor Payments -61.0 -66.6
GNP at Market Prices 233.1 251.8 8.0 1.9 5.9
B: GROSS NATIONAL PRODUCT BY ORIGIN
2017 2018 Change in 2018
€ bn € bn € bn %
Agriculture, Self Employed Income 3.5 3.8 0.3 9.4
Agriculture, Employee Remunerations 0.7 0.7 0.0 0.0
Non-Agriculture, Employee Remunerations 85.7 91.8 6.1 7.1
Other 113.3 117.3 4.0 3.5
Adjustments: Stock Appreciation 0.0 0.2
Statistical Discrepancy -2.8 -3.0
Net Domestic Product 250.6 271.7 21.1 8.4 Net Factor Payments -61.0 -66.6 -5.7 9.3
National Income 189.6 205.1 15.4 8.1
Depreciation 72.0 74.8 2.8 3.9
GNP at Factor Cost 261.6 279.8 18.3 7.0 Taxes less Subsidies -28.4 -28.0 0.4 -1.5
GNP at Market Prices 233.1 251.8 18.7 8.0
C: BALANCE OF PAYMENTS ON CURRENT ACCOUNT
2017 2018 Change in 2018
€ bn € bn € bn
X – M 89.3 99.5 10.2
F -59.8 -65.4 -5.6
Net Transfers -4.6 -5.1 -0.5
Balance on Current Account 24.9 29.0 4.1
as % of GNP 10.7 11.5
1
NATIONAL ACCOUNTS 2019
A: EXPENDITURE ON GROSS NATIONAL PRODUCT
2018 2019 Change in 2019
€ bn € bn Value Price Volume
Private Consumer Expenditure 104.3 108.7 4.2 1.7 2.5
Public Net Current Expenditure 32.0 35.1 9.7 2.5 7.0
Gross Fixed Capital Formation 79.4 87.7 10.3 3.0 7.1
Exports of Goods and Services 383.8 405.2 5.6 1.3 4.2
Physical Changes in Stocks 1.6 3.0
Final Demand 601.1 639.6 6.4 1.8 4.6 less:
Imports of Goods and Services 284.4 305.9 7.6 1.5 6.0
Statistical Discrepancy 1.8 -0.1
GDP at Market Prices 318.5 333.5 4.7 0.7 4.0 Net Factor Payments -66.6 -70.4
GNP at Market Prices 251.8 263.2 4.5 1.1 3.3
B: GROSS NATIONAL PRODUCT BY ORIGIN
2018 2019 Change in 2019
€ bn € bn € bn %
Agriculture, Self Employed Income 3.8 3.9 0.1 2.6
Agriculture, Employee Remunerations 0.7 0.7 0.0 0.0
Non-Agriculture, Employee Remunerations 91.8 99.2 7.4 8.1
Other 117.3 120.3 3.0 2.6
Adjustments: Stock Appreciation 0.2 0.2
Statistical Discrepancy -3.0 -3.0
Net Domestic Product 271.7 285.1 13.4 4.9 Net Factor Payments -66.6 -70.4 -3.7 5.6
National Income 205.1 214.8 9.7 4.7
Depreciation 74.8 77.5 2.7 3.6
GNP at Factor Cost 279.8 292.2 12.4 4.4 Taxes less Subsidies -28.0 -29.0 -1.0 3.6
GNP at Market Prices 251.8 263.2 11.4 4.5
C: BALANCE OF PAYMENTS ON CURRENT ACCOUNT
2018 2019 Change in 2019
€ bn € bn € bn
X – M 99.5 99.2 -0.3
F -65.4 -70.4 -5.0
Net Transfers -5.1 -5.6 -0.6
Balance on Current Account 29.0 23.2 -5.8
NATIONAL ACCOUNTS 2020
A: EXPENDITURE ON GROSS NATIONAL PRODUCT
2019 2020 Change in 2020
€ bn € bn Value Price Volume
Private Consumer Expenditure 108.7 113.3 4.2 1.9 2.3
Public Net Current Expenditure 35.1 37.4 6.5 1.1 5.3
Gross Fixed Capital Formation 87.7 97.4 11.1 2.5 7.6
Exports of Goods and Services 405.2 428.7 5.8 1.5 4.3
Physical Changes in Stocks 3.0 3.0
Final Demand 639.6 679.8 6.3 2.0 4.5
less:
Imports of Goods and Services 305.9 329.1 7.6 1.7 5.9
Statistical Discrepancy -0.1 -0.1
GDP at Market Prices 333.5 350.5 5.1 1.9 3.2 Net Factor Payments -70.4 -74.9
GNP at Market Prices 263.2 275.7 4.7 1.6 2.6
B: GROSS NATIONAL PRODUCT BY ORIGIN
2019 2020 Change in 2020
€ bn € bn € bn %
Agriculture, Self Employed Income 3.9 4.0 0.1 2.6
Agriculture, Employee Remunerations 0.7 0.7 0.0 0.0
Non-Agriculture, Employee Remunerations 99.2 106.1 6.9 6.9
Other 120.3 123.9 3.6 3.0
Adjustments: Stock Appreciation 0.2 0.2
Statistical Discrepancy -3.0 -3.0
Net Domestic Product 285.1 300.3 15.2 5.3 Net Factor Payments -70.4 -74.9 -4.5 6.4
National Income 214.8 225.4 10.7 5.0
Depreciation 77.5 80.1 2.6 3.4
GNP at Factor Cost 292.2 305.5 13.3 4.6 Taxes less Subsidies -29.0 -29.9 -0.8 2.9
GNP at Market Prices 263.2 275.7 12.5 4.7
C: BALANCE OF PAYMENTS ON CURRENT ACCOUNT
2019 2020 Change in 2020
€ bn € bn € bn
X – M 99.2 99.5 0.3
F -70.4 -74.9 -4.5
Net Transfers -5.6 -6.1 -0.5
Balance on Current Account 23.2 18.5 -4.7
The Irish Economy – Forecast Overview
While a number of international concerns continue to cast a shadow on the domestic economy, both taxation receipts and labour market indicators suggest that the Irish economy continues to perform strongly in 2019. Output is still forecast to grow by 4.0 per cent in 2019 before moderating somewhat at 3.2 per cent in 2020. Unemployment is set to fall to 4.5 per cent by the end of the present year and to 4.1 per cent at the end of the next year. All forecasts, unless otherwise stated, maintain the Commentary’s baseline assumption that the trading status of the United Kingdom remains equivalent to that of a full European Union Member State.
The Irish economy appears to be operating at its full potential level. The continued strong performance of the labour market has resulted in a significant increase in both nominal and real wages in recent years. While wage increases due to productivity are warranted, care must be exercised to ensure that the competitiveness of the domestic economy is maintained. Fiscal policy will be important in tempering the degree of demand-side pressures in the domestic economy in that regard.
Greater vigilance will also be required to ensure that large infrastructural projects, which are essential for sustainable growth, are delivered on an efficient basis. A number of high profile cases have emerged recently where the final costs of certain projects seems to be significantly different from initial estimates. Given the pace of growth in the economy at present, increases in expenditure must focus on capital projects that increase the productive capacity of the economy.
While the performance of the economy continues to exceed that of most other European countries, it is subject to heightened levels of uncertainty. Consumer and producer sentiment indices have all reported significant declines in investor confidence about future prospects for the Irish economy. Inevitably, much of this uncertainty reflects the ongoing process of the UK withdrawal from the European Union. While analysis of the impacts of the UK withdrawal has inevitably focussed on the future impacts on the domestic economy, it is clear that Brexit has already had a materially negative impact on the Irish economy. Ongoing trade frictions between the United States and China are also potentially contributing to lower investment due to global uncertainties.
The International Economy
The international economy section has now been amended to also include a section on international financial developments. This has previously been in the Monetary and Financial section. Therefore, the section now deals initially with the overall performance of the domestic economy’s main trading partners, then international financial developments, and finally the implications for the traded sector of the domestic economy.
The increase in trade tensions and in particular the adoption of new tariffs rates between the world’s two largest economies, the US and China, has had an adverse impact on global economic activity. While importers of Irish goods have largely been exempt from protectionist measures, the indirect effects of the resulting slowdown in multilateral trade activity could limit the growth potential for the Irish economy. This slowdown has also been observed in a European context. These uncertainties have been incorporated into the IMF’s World Economic Outlook as of April 2019, which revised world output growth down yet
again, declining from 3.5 in the January issue to 3.3 per cent for 2019.1
According to flash estimates of year-on-year real GDP growth, economic activity for the EU28 remained at 1.5 per cent while the Euro Area grew by 1.2 per cent. France, Germany, Spain and Italy experienced a 1.1, 0.7, 2.4 and 0.1 per cent annual increase in real GDP, respectively. These remain broadly similar to annual growth rates exhibited in Q4 2018. As highlighted in Figure 1, the moderation in economic activity appears to be largely driven by weaker private consumption and poor export performance. As of March 2019, EU28 unemployment fell to 6.4 per cent. Inflation in the Euro Area averaged 1.4 per cent in Q1 2019, rising to 1.7 per cent in April.
FIGURE 1 EU28 – CONTRIBUTIONS TO YEAR-ON-YEAR GDP GROWTH (PERCENTAGE POINT CONTRIBUTIONS)
Sources: Eurostat, GDP and main components.
As of April 2019, the EU began trade negotiations with the US, aiming to address both a product conformity assessment (which seeks to enable firms to more easily prove products meet technical requirements) and a reciprocal elimination of tariffs on industrial products. A recent analysis of the proposed tariff change estimates that EU and US exports would grow by 8 per cent and 9 per cent,
respectively, after the policy change.2 Given the EU’s recent difficulty in
maintaining trade competitiveness as well as increased frictions in US-China trade, these negotiations do present opportunities for global economic development and trade liberalisation.
Real GDP growth in the United Kingdom improved significantly in Q1 2019, driven largely by high levels of stockpile accumulation and strong production sector performance relative to services (Figure 2). Gross value added indices for both the production and manufacturing sectors yielded moderate annual growth for the quarter, following a sizeable decline in 2018. Unemployment has fallen to 3.8 per cent in Q1 2019, its lowest rate since the 1970s. As vacancies grow and labour supply shortages manifest, competitive pressures are likely to fuel further increases to nominal incomes. In Q1 2019, average weekly earnings grew year-on-year by 3.2 per cent (+1.3 per cent in real terms). As seen in 2017, real earnings growth can be quite sensitive to currency depreciation. Given that the
2 European Commission (2019). ‘Liberalization of tariffs on industrial goods between the United States of America and
the European Union: An economic analysis’, Brussels: European Commission.
-4 -3 -2 -1 0 1 2 3 4 5 6 20 14Q1 20 14Q2 20 14Q3 20 14Q4 20 15Q1 20 15Q2 20 15Q3 20 15Q4 20 16Q1 20 16Q2 20 16Q3 20 16Q4 20 17Q1 20 17Q2 20 17Q3 20 17Q4 20 18Q1 20 18Q2 20 18Q3 20 18Q4
Imports of goods and services Exports of goods and services Gross fixed capital formation Public Consumption
UK has a high import dependency ratio for items such as food and medicine, any shift in the value of the pound results in significant inflationary pressure and undermines real earnings growth.
FIGURE 2 KEY UK ECONOMIC INDICATORS, YEAR-ON-YEAR CHANGE (%)
Sources: ONS,gross domestic product, latest quarter on corresponding quarter of previous year (LHS); ONS,GDP output approach – low-level aggregates, GVA chained volume index (constant prices), latest quarter on corresponding quarter of previous year (RHS).
A No-Deal Brexit outcome was narrowly avoided in March, following an extension of the withdrawal date to 31 October 2019. With a new Conservative leader due to be selected before the end of July, uncertainty regarding the UK government’s anticipated stance on Brexit will likely intensify over the coming weeks. The main opposition party, the Labour Party, has suggested a potential Customs Union relationship between the UK and the EU. A Customs Union implies no tariffs or quotas for multilateral goods trade, however the trade of services would face greater frictions, particularly for financial markets, and a lack of freedom of movement would further undermine competitiveness. A recent National Institute of Economic and Social Research (NIESR) study assesses the long-run impact of such a deal on the UK. Hantzsche and Young (2019) estimate that under a Customs Union deal, the UK economy would be 3.1 per cent smaller after ten years relative to the UK remaining in the EU. Reduced migration contributes to 1.3 percentage points of this loss, while greater frictions in the trade of services results in a 1.5 percentage point contribution. Goods are softly impacted,
contributing to 0.3 percentage points of the overall GDP loss.3
The US economy grew at an annual rate of 3.2 per cent in Q1 2019. This was driven largely by a 3.7 per cent reduction in imports. Similar to the first quarter of last year, consumption made a lacklustre contribution to overall growth. As of
3 Hantzsche, A. and G. Young (2019). The Economic Impact on the United Kingdom of a Customs Union Deal with the
European Union, London: National Institute of Economic and Social Research.
March 2019, the US unemployment rate declined to 3.6 per cent; as with the UK, this rate is a historically low rate, which has not been observed since the late 1960s. While there has been some debate about the quality of jobs in the labour market, it is important to note that the percentage of multiple job holders in the US has remained stable at approximately 5 per cent of total employment since 2005 and that the share of those employed working part time remains at a ten-year low of 17 per cent.
[image:16.595.73.528.360.611.2]The US trade balance for goods improved slightly in Q1 2019 relative to the same period last year, following a 2.4 per cent year-on-year increase in goods exports while imports of goods only grew by a modest 0.6 per cent. Figure 3 highlights a significant decline in bilateral trade between the US and China. The introduction of new tariffs throughout 2018 and the increase in tariff rates following failed US-China trade negotiations in the first half of 2019 are likely to lead to a further deterioration in overall US trade activity.
FIGURE 3 US-CHINA SEASONALLY-ADJUSTED IMPORTS AND EXPORTS, Y-O-Y GROWTH (%)
Source: United States Census Bureau, US Export and Import data for goods.
Real GDP in China increased by 6.4 per cent in Q1 2019, year-on-year. Though the widely expected slowdown in economic activity has yet to occur, policymakers are taking precautionary measures to dampen any future shocks to the domestic economy. In particular, the difficulties in the Chinese economy are related to the ongoing trade dispute with the US, a tightening of financial market regulations and various measures put into action to curb speculative bubbles forming in the real estate sector. The recent introduction of the government’s fiscal stimulus programme aims to prop up the relatively weakened economy. Given the
-120 -90 -60 -30 0 30 60 90 120 150 -40 -30 -20 -10 0 10 20 30 40 50 2 0 0 8 Q1 20 08 Q 3 2 0 0 9 Q1 2 0 0 9 Q3 2 0 1 0 Q1 2 0 1 0 Q3 2 0 1 1 Q1 2 0 1 1 Q3 2 0 1 2 Q1 2 0 1 2 Q3 2 0 1 3 Q1 20 13 Q 3 2 0 1 4 Q1 2 0 1 4 Q3 2 0 1 5 Q1 2 0 1 5 Q3 2 0 1 6 Q1 2 0 1 6 Q3 2 0 1 7 Q1 2 0 1 7 Q3 2 0 1 8 Q1 2 0 1 8 Q3 2 0 1 9 Q1
increase in US tariff rates in May, further action may be required to maintain the government’s GDP growth target of between 6.0 to 6.5 per cent.
Strong public investment and an improvement in Japan’s trade balance resulted in real GDP growth of 2.1 per cent in Q1 2019, year-on-year. Similarl to developments among other strong global players, overall trade activity declined. The improvement in the trade balance came about due to a decline in imports which were larger than the decline seen in exports. As of December 2018, final estimates suggest there has been an 8.9 per cent decline in the size of the working population over the past ten years. Job vacancy ratios remain at record levels while unemployment rose slightly to 2.5 per cent in March. Fiscal pressures continue to accumulate as Japan faces ever growing challenges from growth in public debt and an ageing population. Unpopular sales tax hikes are likely to continue being imposed in 2019 in order to address such challenges. Sales tax receipts are expected to account for roughly a third of total tax revenue relative to 18 per cent in the late 1980s.
Figure 4 summarises the forecasts for GDP growth produced by the major institutions of their respective economies. Each forecast signals minimum and maximum forecasts with point values identifying the median of forecasts. These forecasts suggest a broad-based expectation of a moderation in economic growth across the majority of developed economies.
FIGURE 4 REAL GDP GROWTH (% CHANGE, YEAR-ON-YEAR)
Euro Area United States United Kingdom
Sources: FocusEconomics, IMF, OECD, HM Treasury and Federal Reserve.
Recent Trade Tariffs
According to a recent analysis by the Peterson Institute for International Economics, prior to the US administration’s imposition of various tariffs, the
-2 -1 0 1 2 3 4
-2 -1 0 1 2 3 4
average tariff rate on US imports from China was 3.1 per cent, reflective of WTO
‘Most Favoured Nations’ tariff rates.4 As of September 2018, US elevated tariffs
applied directly on Chinese goods resulted in the average tariff rate climbing to 12.4 per cent. Following failed trade negotiations up until May 2019, the US administration raised tariff rates on $200 billion worth of Chinese products from 10 to 25 per cent, leading to the overall tariff rate now averaging 18.3 per cent. The study finds this rate may rise further, should threats of imposing these 25 per cent tariff rates to nearly all US imports of Chinese goods be acted upon. Coupled with high tariffs on the remainder of Chinese imports, this would cause the overall average tariff rate to increase to 27.8 per cent. Such a broad imposition of high tariffs between the world’s two largest economies would have a significantly adverse impact on global growth. Should global trade activity diminish, opportunities for small open economies like Ireland become increasingly limited.
Possibly expecting the next phase of the trade war to proceed, the IMF published a brief analysis which models how a 25 per cent tariff rate on all US imports of
Chinese goods would affect the global economy.5 In the case of China and the US,
bilateral trade falls by 25 to 30 per cent after a year, ranging further from 30 to 70 per cent in the long run across various models. Both economies would face real GDP losses, ranging from 0.3 to 0.6 percentage points for the US and 0.5 to 1.5 percentage points for China. For third countries, the net effect on exports is positive, particularly in the cases of Canada and Mexico, though this will involve reduced exports to China and large increases in exports to the US. Overall, the IMF analysis estimates a global reduction in real GDP of just under 0.25 percentage points, should the US proceed with threats of further tariff extensions.
International Financial Developments
As a result of Ireland’s openness to international trade and capital flows, fluctuations in international financial markets can have a significant impact on the domestic economy. Escalating international trade tensions, primarily between the United States and China, pose a threat to both global economic growth and financial markets in the latter half of 2019. Other downside risks such as slowing growth in Europe and uncertainty around Brexit could also have a significant negative impact on financial markets going forward.
4 Brown, P. and E.Y. Zhang (2019). ‘Trump’s 2019 Protection Could Push China Back to Smoot-Hawley Tariff Levels’,
Washington D.C.: Peterson Institute for International Economics.
5 Caceres, C., D. Cerdeiro, R. Mano, R. Portillo and M. Santoro (2019). ‘The Global Macro and Micro Effects of a
Following a period of relative tranquillity through much of 2019, the VIX Volatility Index increased sharply in May. This measure of investor fear had been relatively low in the preceding months as investors had been optimistic about the prospect of the United States and China agreeing a bilateral trade deal. However, following the unexpected escalation in trade tensions between the two countries the Index spiked again in May. In light of these trade tensions and the general decline in optimism for the global economy, central banks remain accommodative with policy rates in the Federal Reserve, European Central Bank, the Bank of England and the Bank of Japan unlikely to increase through the second half of the year.
FIGURE 5 VIX VOLATILITY INDEX (%)
Source: St Louis Fed Database, from Chicago Board Options Exchange.
As the outlook for the Eurozone remains weak in the face of growing international instability, the ECB continues to provide a stimulus to the monetary union through its accommodative monetary policy stance. The Eonia rate, which is the rate at which banks can lend to each other overnight, stood at just above -0.4 per cent in May, which is in line with the negative policy rates set by the ECB. With the ECB signalling an intent to keep rates on hold until at least the middle of 2020, this accommodative stance looks set to remain in place for the foreseeable future.
FIGURE 6 EURO OVERNIGHT INDEX AVERAGE, EONIA (%)
Source: European Central Bank, Statistical Data Warehouse.
Due to the low inflation environment that persisted over the last decade, the ECB and other central banks turned to unconventional monetary policy in order to provide monetary stimulus. This stimulus came in the form of Quantitative Easing (QE) whereby Central Banks purchased large amounts of sovereign and corporate debt in financial markets in order to increase the money supply, lower the cost of credit, increase liquidity and loosen the credit supply.
Figure 7 illustrates the significant growth in assets on central bank balance sheets over the past decade. Following the initiation of QE by the Federal Reserve and then the BOE, the ECB introduced its own QE programme in 2015. Over the next three years the number of assets purchased by the ECB increased significantly, reaching a peak of value of nearly €4.7 trillion in January 2019. Having been credited with boosting economic growth and preventing deflation, the ECB announced in December 2018 that it would begin unwinding its asset purchase programme. However, with policy rates still negative and inflation still below the desired rate the ECB has hinted at a possible return of unconventional monetary policy should the need arise.
FIGURE 7 CENTRAL BANK BALANCE SHEETS ($MILLION)
Source: European Central Bank, Federal Reserve, Bank of England, Bank of Japan.
Accommodative monetary policy through low policy rates and QE has kept government bond yields low into 2019. Further downward pressure is also being exerted on sovereign yields as investor concerns about the near term prospects for the global economy grow, increasing the demand for developed country sovereign bonds which are generally considered to be safe assets. Ten-year government bond yields for a select group of advanced countries are presented in Figure 8. The ten-year yield for Ireland fell to 0.56 per cent in March, the lowest level since 2016. This is particularly beneficial due to the large level of outstanding debt currently being repaid by the Irish Exchequer.
2,000,000 4,000,000 6,000,000 8,000,000 10,000,000 12,000,000 14,000,000 16,000,000
FIGURE 8 TEN-YEAR GOVERNMENT BOND YIELDS (%)
Source: St. Louis Fed database.
Figure 9 shows the level of credit loaned to the private non-financial sector (PNFS) for both emerging and advanced economies. While credit to the PNFS has remained relatively stable in advanced economies, there has been a significant increase in the level of borrowing in emerging economies following the financial crisis. Whereas credit to the PNFS in emerging economies was worth just 76 per cent of GDP in Q4 2008, as of Q1 2018 it has grown to over 144 per cent of GDP.
Despite the fall in credit to emerging economies in Q3 and Q4 of 2018, the level of leverage remains high by historical standards. This increase in leverage comes during a period of persistently low interest rates in advanced economies with
investors looking for greater yields elsewhere.6 One possible risk faced by
corporations in emerging economies is the possibility of monetary policy normalisation in advanced economies, incentivising investors away from lending to corporations in emerging markets. A sudden withdrawal of credit would likely have a significant destabilising impact on the domestic markets of emerging economies with the potential for cross-border contagion effects. This in turn could negatively impact development and trade in these regions and potentially weaken the global outlook for trade even further.
6 See Bräuning, Falk and Victoria Ivashina (forthcoming). ‘US Monetary Policy and Emerging Market Credit Cycles’.
Journal of Monetary Economics.
-2 0 2 4 6 8 10 12 14 20 04M0 1 20 04M0 8 20 05M0 3 20 05M1 0 20 06 M0 5 20 06M1 2 20 07M0 7 20 08M0 2 20 08M0 9 20 09M0 4 20 09M1 1 20 10M0 6 20 11M0 1 20 11M0 8 20 12M0 3 20 12M1 0 20 13M0 5 20 13M1 2 20 14M0 7 20 15M0 2 20 15M0 9 20 16M0 4 20 16M1 1 20 17 M0 6 20 18M0 1 20 18M0 8 20 19M0 3
FIGURE 9 CREDIT TO PRIVATE NON-FINANCIAL SECTOR BY DEVELOPMENT CATEGORY
Source: Bank for International Settlements.
Note: Credit as a percentage of GDP featured on LHS and USD value ($ billion) on RHS.
Figure 10 displays exchange rates of the Euro (EUR) to the US Dollar (USD), the British Pound Sterling (GBP), the Swiss Franc (CHF) and the Chinese Renminbi (CNY). These are the currencies of Ireland’s largest trading partners outside the Eurozone and their values against the EUR impact on the competitiveness of Irish companies in the international market. Since the onset of Brexit there has been a substantial strengthening of the EUR/GBP rate. On 24 June 2016, the day after the Brexit referendum, the EUR/GBP appreciated by over 6 per cent and by the end of the year was nearly 16 per cent higher than it had been 12 months earlier. As fears of a No-Deal Brexit temporarily subsided in Q2 2019, GBP has strengthened relative to EUR but remains significantly weaker than it was at the start of 2016.
Meanwhile, the EUR/USD rate has been weakening since the first quarter of 2018. This is likely due to strong growth in the US economy in comparison to the Euro Area over this period. With Euro Area interest rates set to remain constant, a rate hike by the Federal Reserve in 2019 would likely lead to further depreciation of the EUR/USD rate. Though the EUR/CNY rate had been trending downwards since Q3 2018 there was a sharp increase in the exchange rate in May. This was likely due to capital leaving China as investors fear the negative impact an escalated trade war with the US could have on the Chinese economy.
0 20000 40000 60000 80000 100000 120000 140000 0 20 40 60 80 100 120 140 160 180 200 20 04Q1 20 04Q3 20 05Q1 20 05Q3 20 06Q1 20 06Q3 20 07Q1 20 07Q3 20 08Q1 20 08Q3 20 09Q1 20 09Q3 20 10Q1 20 10Q3 20 11Q1 20 11Q3 20 12Q1 20 12 Q3 20 13Q1 20 13Q3 20 14Q1 20 14Q3 20 15Q1 20 15Q3 20 16Q1 20 16Q3 20 17Q1 20 17Q3 20 18 Q1 20 18Q3
FIGURE 10 EUR EXCHANGE RATE TO USD, GBP, CHF (JANUARY 2016, BASE=100)
Source: Yahoo Finance.
I
MPLICATIONS FORI
RISHE
XPORTS,
I
MPORTS AND THEB
ALANCE OFP
AYMENTSGoods
As with the observed slowdown in global trade activity, growth of Irish imports and exports weakened in Q1 2019. As displayed in Figure 11, seasonally-adjusted cross-border goods exports increased by 11.7 per cent in Q1 2019 relative to the same period last year. Much like the opening quarter of the previous year, imports changed modestly, increasing by 1 per cent year-on-year. This resulted in a net contribution to the overall trade balance of €3.7 billion, given that import growth has slowed far more sharply.
90 95 100 105 110 115 120 125 130 01 /201 6 03 /201 6 05 /201 6 07 /201 6 09 /201 6 11 /201 6 01 /201 7 03 /201 7 05 /201 7 07 /201 7 09 /201 7 11 /201 7 01 /201 8 03 /201 8 05 /201 8 07 /201 8 09 /201 8 11 /201 8 01 /201 9 03 /201 9 05 /201 9
FIGURE 11 ANNUAL GROWTH RATE (%) IN CROSS-BORDER IRISH EXPORTS AND IMPORTS
Source: Central Statistics Office.
Cross-border trade excludes the trade of ownership goods (e.g. contract
manufacturing, merchanting)7 hence the final growth rates for Quarterly National
Account goods trade will differ compared to these figures. While these traded goods are owned by Irish resident firms, some of these goods may never physically cross the Irish border nor are they produced domestically. Cross-border trade therefore functions somewhat more accurately as an indicator of domestic
exporter performance.8 When examining the trade of goods, foreign-owned Irish
resident firm activities such as processing and merchanting must be taken into account.
The 11.7 per cent increase in cross-border exports was largely driven by chemical and machinery products, as displayed in Table 1. Of a €4.2 billion increase in exports, chemical products contributed €2.3 billion while machinery contributed €1.2 billion. Though Irish trade is highly influenced by the pharmaceutical industry, excluding chemical products still results in export growth of 15 per cent due to significant improvements in the exports of electricity, electrical machinery
7 ‘Goods for processing’ is dominated by ‘Contract Manufacturing’, a process in which multinational companies
residing in Ireland issue contracts to foreign firms to produce goods. Although these goods never enter the Irish economy, due to ownership of these goods pertaining to Irish resident firms, sales are recorded as an Irish export. ‘Merchanting’ consists of the buying and selling of completed goods abroad which at no stage enter or leave Ireland.
8 For further details on ownership trade, see CSO document ‘Explaining Goods Exports and Imports 2012-2016’.
-2,400 -1,600 -800 800 1,600 2,400 3,200 4,000 4,800 5,600
-15 -10 -5 0 5 10 15 20 25 30 35
and transport equipment.9 For the same period, trade in machinery and chemicals products represented 60 per cent of total imports. Machinery imports increased year-on-year by 8.8 per cent while imports of chemicals declined by 23.6 per cent. The significant decline in chemicals is mostly attributed to reduced imports of medicinal and pharmaceutical products from Germany and Italy, down 69 and 78 per cent respectively, relative to Q1 2018.
TABLE 1 JANUARY-MARCH CHANGE IN IRISH EXPORTS BY COMMODITY (€ BILLION)
Q1 2018 Q1 2019 €Change % Change Cross Border Goods 33.8 38.0 4.2 12
Food and live animals 2.6 2.7 0.1 4 Beverages and tobacco 0.3 0.4 0.1 24 Crude materials, inedible, except fuels 0.5 0.5 0.0 -4 Mineral fuels, lubricants and related materials 0.2 0.5 0.3 135 Animal and vegetable oils, fats and waxes 0.0 0.0 0.0 -15
Chemicals and related products 21.4 23.8 2.3 11
Manufactured goods classified chiefly by material 0.6 0.6 0.0 2 Machinery and transport equipment 4.2 5.4 1.2 29 Miscellaneous manufactured articles 3.8 4.0 0.1 3 Other items 0.2 0.3 0.1 30
Exports less Chemical Products 12.4 14.3 1.8 15
Source: Central Statistics Office and QEC author calculations.
Given the vulnerability of the domestic agricultural sector to Brexit, it is important to monitor food exports closely. Figure 12 splits food trade into two major sub-components. In general, food exports have improved somewhat, largely driven by dairy products and eggs. The UK and EU were the main contributors to the 5.1 per cent growth in Irish food exports whereas the remainder of the world’s demand for Irish food exports continued to decline, down by 0.8 per cent in Q1 2019 relative to the same period last year.
9 Electricity is registered under ‘Mineral fuels, lubricants and related materials’. With the launch of the Integrated
FIGURE 12 ANNUAL GROWTH RATE (%) OF CROSS-BORDER FOOD EXPORTS
Source: Central Statistics Office.
Services
In 2018, service exports increased annually by 10 per cent. Computer services accounted for half of total service exports for the year, up from a share of 43 per cent in 2017. It is worth noting that exports of computer services have been experiencing consecutive quarters of double digit growth since mid-2014. As highlighted in Figure 13, business services have recently been exhibiting similar improvements. As stated by the Central Statistics Office (CSO) in their recent data release, this is mainly observed through greater advertising and inter-affiliate management charges.
-20 -10 0 10 20 30 40 50 60 70
FIGURE 13 EXPORTS OF SERVICES BY COMPONENT (€MILLION)
Source: Central Statistics Office.
Imports of services increased annually by 4 per cent. Royalties & licences and business services accounted for 78 per cent of service imports both in 2017 and 2018. As a component of ‘business services’, imports of research and development services experienced the largest annual increase in Q4 2018, rising annually by 120 per cent.
FIGURE 14 IMPORTS OF SERVICES BY COMPONENT (€MILLION)
Source: Central Statistics Office.
5,000 10,000 15,000 20,000 25,000 30,000 20 12Q1 20 12 Q2 20 12Q3 20 12Q4 20 13Q1 20 13Q2 20 13Q3 20 13Q4 20 14Q1 20 14Q2 20 14Q3 20 14Q4 20 15Q1 20 15Q2 20 15Q3 20 15Q4 20 16Q1 20 16Q2 20 16 Q3 20 16Q4 20 17Q1 20 17Q2 20 17Q3 20 17Q4 20 18Q1 20 18 Q2 20 18Q3 20 18Q4
Financial services Computer services Royalties/licences All business services
5,000 10,000 15,000 20,000 25,000 30,000 35,000 20 12 Q1 20 12Q2 20 12Q3 20 12 Q4 20 13Q1 20 13Q2 20 13Q3 20 13Q4 20 14Q1 20 14Q2 20 14Q3 20 14Q4 20 15Q1 20 15Q2 20 15Q3 20 15Q4 20 16Q1 20 16Q2 20 16Q3 20 16Q4 20 17Q1 20 17Q2 20 17Q3 20 17Q4 20 18Q1 20 18 Q2 20 18Q3 20 18Q4
Current Account
Similarly to the previous year, the low trade balance for services in 2018 resulted in a significant current account surplus of €29 billion (12 per cent of gross national product). As seen in Figure 15, this surplus could have been far larger, roughly 15 per cent of GNP, had recent developments in service trade stayed on course. A sudden increase in R&D related imports led to the relatively low current account contribution of €178 million in Q4 2018.
FIGURE 15 CURRENT ACCOUNT BALANCE (€MILLION)
Source: Central Statistics Office.
Given the influence that a small number of particularly large multinational firms have had on the current account from 2015 onwards, the Central Statistics Office proceeded to release a modified measure of the current account balance, with the aim of excluding transactions that were not reflective of the underlying conditions of the domestic economy and its relationship with the wider global markets. These adjustments include the exclusion of trade in R&D related intellectual property services and imports of aircraft related to leasing. Furthermore, to address distortions to primary income outflows, the modified balance also excludes the contribution of depreciation on R&D service imports and trade in IP, depreciation attributed to aircraft leasing and redomiciled income. -40,000 -30,000 -20,000 -10,000 10,000 20,000 30,000 40,000 20 13Q2 20 13Q3 20 13Q4 20 14Q1 20 14Q2 20 14Q3 20 14Q4 20 15Q1 20 15 Q2 20 15Q3 20 15Q4 20 16Q1 20 16Q2 20 16Q3 20 16Q4 20 17Q1 20 17Q2 20 17Q3 20 17Q4 20 18Q1 20 18Q2 20 18Q3 20 18Q4
While these various changes reduce the current account balance, it is still positive from 2014 onward. From Figure 16 it can be seen that depreciation and service trade related to R&D activities has had the most distortionary impact on the current account balance, while aircraft leasing has played a relatively minor role since 2015. As seen in the figure, the Commentary forecasts a current account surplus of €29 billion in 2018.
FIGURE 16 MODIFIED CURRENT ACCOUNT BALANCE (€MILLION)
Source: Central Statistics Office.
Due to the volatile nature of ownership trade in goods as well as services, forecasts in the Commentary continue to be based on trends in trade patterns linked to underlying Irish economic activity. Given the persistent signs of slowdowns in bilateral trade flows across major economies and recent data on Irish trade performance in the initial quarter of 2019, underlying growth forecasts have been moderated slightly. We expect export growth of 4.2 per cent and 4.3 per cent in 2019 and 2020 respectively. Imports are expected to increase by 6.0 per cent in 2019 and 5.9 per cent the following year. The year-end current account is expected to reach €17.9 billion (6.8 per cent of GNP) in 2019 before falling somewhat to €14 billion (5.1 per cent of GNP) in 2020.
-80,000 -60,000 -40,000 -20,000 0 20,000 40,000 60,000
2007 2008 2009 2010 2011 2012 2013 2014 2015 2016 2017
R&D service imports R&D related IP exports R&D related IP imports Net aircraft related to Leasing
Redomiciled Income Aircraft Leasing depreciation
Depreciation on R&D service imports and trade in IP
The Domestic Economy
O
UTPUTThe domestic section of the Commentary is organised as follows; we initially review the outlook for output growth before discussing developments in the Irish monetary and financial sectors and the outlook for inflation. This is followed by a review of demand-side factors such as consumption and housing market issues. On the supply side, we then examine developments in investment and the labour market before concluding with an analysis of the public finances.
In Figure 17 the actual and forecast performance of the Irish economy is placed within a European context – the actual growth rate of the domestic economy in
2015 of 25 per cent is replaced by an estimated growth rate of 5.5 per cent.10
From 2014 onwards, the significant relative performance of the Irish economy is apparent. According to the most recent forecasts, this performance looks set to continue over the next two years.
FIGURE 17 ACTUAL (2011-2018) AND FORECAST (2019-2020) ANNUAL GDP GROWTH RATES (%)
Source: St Louis Fed Database, from Chicago Board Options Exchange.
10 Most commentators accept that the official 25 per cent growth rate in 2015 did not accurately reflect the rate of
underlying growth in the Irish economy for that year. Following calculations in the Autumn 2016 Quarterly Economic
Commentary (QEC), we estimate the rate of GDP growth at 5.5 per cent for 2015.
-4 -2 0 2 4 6 8 10
M
ONETARY ANDF
INANCIAL ANDI
NFLATIONO
UTLOOKHousehold Credit and Mortgage Market
Due to the potential financial instability risks that can emerge from high levels of credit in the economy, the growth rates of household lending must be monitored closely. Figure 18 presents the growth rates of credit to households from Irish
resident credit institutions.11 The data are split by loans for house purchase and
other personal loans (auto finance, credit cards, student loans etc.). The annual growth rate of mortgage lending was 1.4 per cent in Q4 2018 which was a slight increase on the 1 per cent growth rate in Q3 2018. There was also an expansion in the growth rate of non-mortgage credit, up to 2.7 per cent in Q4 2018. While the growth rates in lending for house purchase and other personal credit were positive in each quarter of 2018, they remain significantly below their pre-crisis peak level.
FIGURE 18 GROWTH RATES OF CREDIT TO HOUSEHOLDS (%)
Source: Central Bank of Ireland, Credit, Money and Banking Statistics.
Notes: Data are taken from Central Bank of Ireland data release A.18, Growth rates series codes 777 and 1,252.
Looking at new mortgage lending, in Q1 2019 the total volume of drawdowns increased by 8.9 per cent annually while the total value of drawdowns increased by 10.6 per cent. These are the lowest rates of new mortgage growth in both
11 See CBI, Credit, Money and Banking Statistics: Private Household Credit and Deposits A.18 for details.
-20 -10 0 10 20 30 40
volume and value terms since Q1 2016 when annual growth rates were negative. It is likely that the deceleration in the growth rate of new mortgages is related to affordability issues in the housing market with fewer people able to access the higher levels of credit required due to the persistent increase in house prices. However, it should be noted that despite the deceleration in growth rates the total amount of new mortgage drawdowns in Q1 2019 was still at its highest level in the first quarter of any year since 2009.
FIGURE 19 TOTAL NEW MORTGAGE LENDING (%)
Source: Banking and Payments Federation Ireland.
Trends in SME Credit Market
The allocation of credit to SMEs provides a gauge of both the willingness of credit providers to take on risk and the views of indigenous businesses to the suitability of market conditions for future investment. Figure 20 presents new lending to SMEs over the period 2011 to 2018. From 2013 onwards it can be seen that the volume of new lending to SMEs has been increasing annually. However, the rate of growth has declined in 2017 and 2018 and now stands at just over 6 per cent which is the lowest rate of growth in SME lending since 2013. The slowdown in the rate of lending may be related to uncertainty among domestic businesses with regards to the outcome of Brexit as well as the reduced growth outlook across Europe. However, these data only include lending by the traditional banking sector. If it is the case that SMEs are using increasing amounts of non-bank financing, the overall financing level may be higher than documented in the official statistics.
-80.0 -60.0 -40.0 -20.0 0.0 20.0 40.0 60.0 80.0 100.0
FIGURE 20 NEW LENDING TO SMES – TOTAL PER ANNUM
Source: Central Bank of Ireland, SME Credit Series, Table A.14.1.
Examining SME lending by sector (Figure 21), there were significant increases in lending to both the construction and business services sector in 2018. However, in areas such as manufacturing and wholesale and retail there was a fall in new lending relative to the previous year. Wholesale and retail firms may be tempering investment due to declining consumer sentiment which is reflective of the growing uncertainty around Brexit. Investment may also be curtailed due to the growth of e-commerce, with consumers switching away from traditional retail and purchasing more goods online.
-40% -30% -20% -10% 0% 10% 20% 30% 40%
0 1,000 2,000 3,000 4,000 5,000 6,000
FIGURE 21 NEW LENDING TO SMES – BY SECTOR PER ANNUM (€ MILLION)
Source: Central Bank of Ireland, SME Credit Series, Table A.14.1.
Interest Rates and the Cost of Finance
Since 2014, the interest rate on mortgages in Ireland has been falling steadily and as of March 2019 it stood at 2.98 per cent. Nevertheless, the borrowing rate on Irish loans remains the highest in the Euro Area, as has been the case since Q3 2014. As of March 2019, interest rates on mortgages were nearly 100 basis points higher than the Euro Area average. Given the affordability issues in the Irish housing market, the comparatively high borrowing rates exacerbate the challenges faced by Irish homeowners.
0 200 400 600 800 1,000 1,200 1,400 1,600 1,800 2,000
Primary Industries
Manufacturing, Transport &
Utilities
Construction and Real Estate
Wholesale & Retail
Hotels & Restaurants
Business Services incl ICT
FIGURE 22 INTEREST RATES ON NEW HOUSE PURCHASE LOANS TO HOUSEHOLDS – EUROPEAN COMPARISON
Source: Central Bank of Ireland, SME Credit Series, Table A.14.1.
Notes: Countries included are: AT, BE, EE, ES, FI, FR, IE, IT, LT, NL, PT, SI. These countries are selected due to data availability. Data differ between this chart presented and the text as the ECB comparison data include restructured mortgages whereas the new business SVR is only for new drawdowns.
Like interest rates on mortgages, rates on corporate loans in Ireland are also higher than the Eurozone average. Figure 23 presents the interest rates on new business loans for Non-Financial Corporations in Ireland as well as the mean rate for the Eurozone. Two series are shown: 1) covering all loans and 2) covering loans worth less than €250,000, the latter of which is used as a proxy for loans to SMEs. While the interest rate on all corporate loans in Ireland was 3.03 per cent in March 2019, the average rate in the Euro Area was just 1.64 per cent. The difference is even starker for small loans with the rate in Ireland 5.33 per cent compared to 2.25 per cent in the Eurozone.
There are a number of factors in the Irish credit market that may be contributing to these interest rate differentials. One such factor which has been cited by the
Central Bank12 among others is the lack of competition among retail banks. In the
aftermath of the financial crisis a number of banks collapsed, increasing the concentration of retail banks in the Irish market. This has reduced the level of competition in the banking sector. More broadly, differences in firm behaviour, risk appetites and national regulation, particularly with regard to repossessions,
12 Nevin, Ciarán (2018). ‘Irish retail bank profitability 2003-2018’, Financial Stability Notes, Vol. 2018, No. 10, Central
Bank of Ireland.
0 1 2 3 4 5 6 7 8 20 03J u n 20 04Mar 20 04De c 20 05S e p 20 06J u n 20 07Mar 20 07De c 20 08S e p 20 09J u n 20 10Mar 20 10De c 20 11S e p 20 12J u n 20 13Mar 20 13De c 20 14 Se p 20 15J u n 20 16Mar 20 16De c 20 17S e p 20 18J u n 20 19Mar
are amongst the main reasons for the difference in interest rates between the Irish and European markets.
FIGURE 23 INTEREST RATES ON NEW CORPORATE LOANS – EUROPEAN COMPARISON
Sources: ECB MFI data. Small loans refer to loans worth less than €250,000.
Inflation Outlook
Figure 24 presents the inflation rate in Ireland using CPI, the CPI excluding energy and unprocessed foods (core inflation), and HICP. All three measures of price growth have increased considerably throughout 2019. In May 2019, the 12-month inflation rate was 1.0 per cent for CPI and HICP. With energy prices rising by 5 per cent, core inflation remains below headline CPI at 0.6 per cent. Other sectors in which there was an annual increase in prices were restaurants
and hotels
(+ 3.2 per cent), alcohol and tobacco (+ 2.7 per cent), and education costs (+ 1.7 per cent). Elsewhere, sectors which experienced deflation over the 12-month period were furnishings, household equipment and routine household maintenance (-3.9 per cent), communications (-6.1 per cent), clothing and footwear (-1.3 per cent) and food and non-alcoholic beverages (-0.2 per cent).
0 1 2 3 4 5 6 7 8
FIGURE 24 ANNUAL GROWTH IN INFLATION (%)
Source: Central Statistics Office.
Figure 25 highlights a noticeable difference in the price trends between goods and services. While the annual price growth of services reached 1.2 per cent in May, the prices of goods fell by 0.2 per cent over the same period. Though the rate of deflation for goods has been slowing since the start of the year, negative or low price growth for goods has been persistent since 2013.
FIGURE 25 DECOMPOSITION OF ANNUAL (%) CPI GROWTH INTO GOODS AND SERVICES GROWTH
Source: Central Statistics Office.
-1 -0.5 0 0.5 1 1.5 2 2.5 3
CPI - All items CPI - ExcL Energy & Unprocessed Food HICP - All items
-2.5 -2 -1.5 -1 -0.5 0 0.5 1 1.5 2 2.5
[image:38.595.73.527.501.763.2]In light of the Commentary’s forecast for strong domestic demand and further tightening in the labour market, price growth is expected to accelerate over the next two years. Consumer prices are expected to increase by 1.4 per cent in 2019, rising to 1.7 per cent in 2020.
D
EMANDHousehold sector consumption
[image:39.595.73.527.447.728.2]According to the latest quarterly National Accounts, personal consumption expenditure increased by 2.6 per cent year-on-year in Q4 2018. The continued strong growth in household spending has likely been driven by lower unemployment rates and increasing disposable incomes. However, despite this, the past two quarters have shown a moderation in the rate of growth. Given the international uncertainties around Brexit, tariff and trade policy, it would not be surprising if households were lowering consumption levels to build up savings buffers in case adverse scenarios materialise. Nevertheless, the fast pace of domestic economic expansion, coupled with the tightness in the labour market may outweigh or offset these factors as household resources increase. Understanding which of these factors will dominate is critical to charting the path for consumption over the coming period.
FIGURE 26 QUARTERLY PERSONAL CONSUMPTION ON GOODS AND SERVICES – CONSTANT MARKET PRICES AND SEASONALLY-ADJUSTED
Source: Central Statistics Office.
To get an insight into what is driving household spending patterns we draw on detailed retail sales data. Retail sales is an important input into understanding
19,000 20,000 21,000 22,000 23,000 24,000 25,000 26,000 -5% -4% -3% -2% -1% 0% 1% 2% 3% 4% 5% 6% 20 10Q2 20 10Q4 20 11Q2 20 11Q4 20 12Q2 20 12Q4 20 13Q2 20 13Q4 20 14Q2 20 14Q4 20 15Q2 20 15Q4 20 16Q2 20 16Q4 20 17Q2 20 17Q4 20 18Q2 20 18Q4
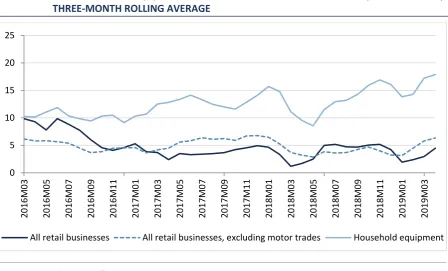
household behaviour as it measures actual spending and is available in a timely manner. Table 2 presents the annual growth in retail sales volume for select items for the three months to April 2019. Across all sectors, retail sales are up on the same three months in the previous year. Overall retail business increased by 4.5 per cent or 6.3 per cent when sales of motor vehicles were excluded. Sales of furniture and lighting goods were considerable, up 12.4 per cent, which is likely due to the strong growth in housing market activity. Since the last Commentary, which considered data up to end 2018, there has been a pick-up in retail sales with the annualised growth rates accelerating. This is likely due to the strong improvement in the labour market (in terms of employment and wage growth) observed during this period.
TABLE 2 GROWTH IN SELECT RETAIL SALES (VOLUME) ITEMS (THREE MONTHS TO APRIL 2019)
Retail Business – NACE Rev. 2 Volume of Sales Annual % change
Motor Trades 0.9
Non-specialised stores (excluding department stores) 5.1
Department stores 1.7
Clothing, Footwear and Textiles 9.2
Furniture and lighting 15.2
All retail businesses 4.5
All retail businesses, excluding motor trades 6.3
Source: Central Statistics Office.
FIGURE 27 ANNUAL GROWTH (%) IN RETAIL SALES INDEX VOLUME ADJUSTED (BASE 2005=100), THREE-MONTH ROLLING AVERAGE
Source: Central Statistics Office.
Another important indicator which provides insight into household spending is consumer sentiment. Figure 28 presents an index developed using the European Commission data on consumer sentiment. The figure presents data for Ireland, the UK and the rest of the EU to provide context.
FIGURE 28 CONSUMER SENTIMENT INDICATORS – IRELAND, UK AND REST OF EU
Source: European Commission data and ESRI calculation.
Note: The positive/negative balances from the EU confidence series are transformed by adding 100. We then set the base to 100 in January 2010 with growth relative to this point i.e. ((Yt/YJan2010) -1)*100.
0 5 10 15 20 25 20 16M0 3 20 16M0 5 20 16M0 7 20 16M0 9 20 16M1 1 20 17M0 1 20 17M0 3 20 17 M0 5 20 17M0 7 20 17M0 9 20 17M1 1 20 18M0 1 20 18M0 3 20 18M0 5 20 18 M0 7 20 18M0 9 20 18M1 1 20 19M0 1 20 19M0 3
All retail businesses All retail businesses, excluding motor trades Household equipment
80 90 100 110 120 130 140 150 Jan -10 Ju n -10 N o v-10 Ap r-11 Se p -11 Fe b -12 Ju l-12 De c-1 2 Ma y-1 3 Oct-13 Mar-14 Au g-14 Jan -15 Ju n -15 N o v-15 Ap r-16 Se p -16 Fe b -17 Ju l-17 De c-1 7 Ma y-1 8 Oct-18 Ma r-19
[image:41.595.76.525.84.355.2] [image:41.595.72.524.494.754.2]While consumer sentiment grew much more strongly in Ireland than elsewhere in the period 2014-2017, it is clear that mid- to late-2018 consumer sentiment has been falling. This suggests that Irish consumers became more fearful as the Brexit deadline drew to a close without a deal. A similar pattern is also evident in the UK. The most recent data point for May 2019 provides some respite with a pick-up in sentiment occurring in Ireland, the UK and EU. This may be driven by the postponement of the Brexit deadline to October 2019 giving time for negotiations to continue.
FIGURE 29 SCATTER PLOT OF RETAIL SALES AND CONSUMER SENTIMENT
Source: ESRI analysis.
Note: Trendline is a cubic polynomial.
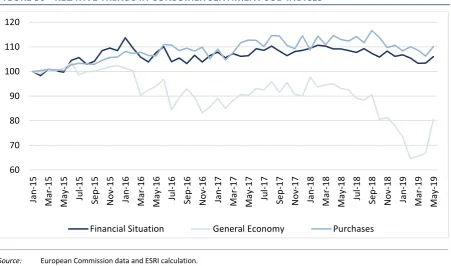
The fact that retail sales are continuing to rise into 2019 despite the moderation in consumer sentiment makes charting the path for consumption more difficult. Both of these indicators normally move in tandem (See Figure 29). However this relationship appears to have broken down coming into late 2018, as displayed in Figure 29 where the past nine months have shown a negative correlation between sentiment and retail sales. Box 1 by McQuinn provides evidence to suggest that actual consumer sentiment levels has departed from that level suggested by economic fundamentals such as unemployment and inflation. Part of this can be explained by looking at the subcomponents of consumer sentiment in Figure 30. It can be seen that households have become much more pessimistic regarding their views on the broader economy but are more positive about their own finances and spending plans. This likely explains why we see a continued pick-up in retail sales despite a moderation in consumer sentiment.
122 124 126 128 130 132 134 136 138 140 142 144
95 100 105 110 115 120 125
Co
n
sume
r
sentim
ent
Retail sales
2019
Q3, Q4 2018
Q1,Q2 2018
FIGURE 30 RELATIVE TRENDS IN CONSUMER SENTIMENT SUB-INDICES
Source: European Commission data and ESRI calculation.
Note: The positive/negative balances from the EU confidence series are transformed by adding 100. We then set the base to 100 in January 2010 with growth relative to this point i.e. ((Yt/YJan2010) -1)*100.
Looking forward, and considering both factors, we expect household consumption to continue growing positively over the next two years. Given the expected increase in employment and the continued increase in earnings, this should support higher consumer spending. The current data suggest these factors are outweighing any decline in consumer sentiment driven by the uncertain outlook. In 2019 we expect consumption expenditure to grow by 2.5 per cent and at a slightly slower pace of 2.3 per cent in 2020.
BOX 1 MODELLING IRISH CONSUMER SENTIMENT – THE POTENTIAL IMPACT OF BREXIT
There is general agreement that Brexit constitutes one of the greatest challenges to the Irish economy over the short to medium term with a range of studies highlighting the adverse impact of the UK’s departure from the European Union (EU) on headline Irish economic variables. However, has Brexit already had a negative impact ex ante on Irish economic performance? From October 2018 onwards Irish consumer sentiment as captured by the Consumer Sentiment Index estimated by the ESRI and KBC Bank has shown a sharp downturn. This is despite the fact that most key Irish economic variables such as labour market data and taxation receipts have shown robust growth over the period. However, since this period there has been a significant increase in the amount of media attention devoted to Brexit with political developments in the UK particularly receiving heightened levels of coverage in Ireland. Therefore, in this box, we attempt to see if there is evidence to suggest that Brexit is adversely impacting Irish consumer sentiment. Figure A plots Irish consumer sentiment as per the KBC/ESRI index. From this, the deterioration in sentiment since Q4 2018 can be observed.
60 70 80 90 100 110 120 Jan -15 Ma r-15 Ma y-1 5 Ju l-15 Se p -15 N o v-15 Jan -16 Ma r-16 Ma y-1 6 Ju l-16 Se p -16 N o v-16 Jan -17 Ma r-17 Ma y-1 7 Ju l-17 Se p -17 N o v-17 Jan -18 Ma r-18 Ma y-1 8 Ju l-18 Se p -18 N o v-18 Jan -19 Ma r-19 Ma y-1 9
To gauge the potential impact of Brexit on consumer sentiment, we specify and estimate a model of Irish consumer sentiment. If, using standard determinants of consumer sentiment, the model is unable to explain recent trends in consumer sentiment, this could provide a priori evidence that Brexit maybe impacting Irish consumer attitudes.
In general, there is a relative dearth of such models, however, one exception is that specified in Lovell and Tien (2000). In modelling US consumer sentiment, Lovell and Tien (2000) specifically assess the value of an Economic Discomfort Index (EDI) as devised by the noted economist Arthur Okun. The index consists of the following.
EDI = |𝑝̇𝑡| + 𝑢𝑡 (1)
where |𝑝̇𝑡| is the absolute rate of inflation and 𝑢𝑡 is the unemployment rate. The Wall
Street Journal (1971) summarised the index in the following way.
The higher this index, the greater the discomfort – we’re less pained by inflation if the job market is jumping, and less sensitive to others’ unemployment if a placed price level is widely enjoyed ....
Based on their model, Lovell and Tien (2000) state that, in a US context, the Economic Discomfort Index provides a reasonable first approximation in summarising the impact of adverse economic conditions on the consumer.
Therefore, we now apply the index in assessing Irish consumer sentiment. The following model is specified and estimated:
log(𝐶𝑃𝐼𝑡) = 𝛼0 + 𝛼1log(𝐸𝐷𝐼𝑡) (2)
CPI is the Irish Consumer Sentiment Index.
The model is run on monthly data over the period January 1998 to February 2019. The regression results are summarised in Table A. Over the period in question, the EDI variable is significant and has the correctly hypothesised sign.
A number of studies point to the close relationship between consumer sentiment and consumption. Carroll, Fuhrer and Wilcox (1994) and Ludvigson (2004) find that after controlling for economic fundamentals – measured by labour income growth, stock prices and short-term interest rates – sentiment contains some small but statistically significant independent information about future consumption growth. Using Australian data, Gillitzer and Prasad (2016) argue that changes in consumer sentiment have a direct effect on consumption. Therefore, if Brexit has had an adverse impact on consumer sentiment, it has already had a materially negative impact on the Irish economy via lower rates of consumption than would otherwise be the case.
TABLE A REGRESSION ESTIMATE RESULTS
Dependent Variable log(𝑪𝑷𝑰𝒕)
Coefficient T-Stat
log(𝐸𝐷𝐼𝑡) -0.615 -14.42
𝑅2 = 0.452
Source: QEC Authors’ Analysis.
FIGURE A IRISH CONSUMER SENTIMENT
Source: KBC Bank/ESRI Consumer Sentiment Index.