DIFFUSION AND THERMODYNAMIC STUDIES IN
AMIDE SOLUTIONS
Atusaye Kayana Sichali
A Thesis Submitted for the Degree of PhD
at the
University of St Andrews
1973
Full metadata for this item is available in
St Andrews Research Repository
at:
http://research-repository.st-andrews.ac.uk/
Please use this identifier to cite or link to this item:
http://hdl.handle.net/10023/15494
DIFFUSION AND TIÎERMOD^^LAMIC STODIES IN
AMIDE SOLUTIONS
A THESIS
Submitted to the University of St. Andrews
for the degree of DOCTOR OF PHILOSOPHY
by
Atusaye Kayana Sichali B.Sc.
Supervisor
ProQuest Number: 10167399
All rights reserved
INFORMATION TO ALL USERS
The qua lity of this reproduction is d e p e n d e n t upon the qua lity of the copy subm itted.
In the unlikely e v e n t that the author did not send a c o m p le te m anuscript
and there are missing pages, these will be noted. Also, if m aterial had to be rem oved,
a n o te will in d ica te the deletion.
uest
ProQuest 10167399
Published by ProQuest LLC (2017). C o pyright of the Dissertation is held by the Author.
All rights reserved.
This work is protected against unauthorized copying under Title 17, United States C o d e
M icroform Edition © ProQuest LLC.
ProQuest LLC.
789 East Eisenhower Parkway
P.O. Box 1346
(il)
Atusaye K. Sichali
1
DECLARATION
. I declare that this thesis is my own composition,
that the work therein has been carried out by me and
that it has not been submitted in any previous application
for a Higher degree.
The thesis describes results of research carried out
at the Department of Chemistry, United College of
St, Salvator and St. Leonard, University of St. Andrews,
under the supervision of Dr. C.A. Vincent from
1st October, 1970 to 30th September, 1973.
1
(iii)
CERTIFICATE
I hereby certify that Atusaye Kayana Sichali has spent eleven
terms of research work under my supervision, has fulfilled
the conditions of ordinance No, 12 (St* Andrews), and is
qualified to submit the accompanying thesis in application
for the degree of Doctor of Philosophy,
(iv)
ACKNOWLEDGEMENTS
I must thank first and foremost niy supervisor
Dr. C.A, Vincent whose kind and patient supervision was
of very great help to me.
I am also very grateful to Professor J.A, Leisten
(Malawi) and Professor P.A.H. Wyatt (St, Andrews) who made
it possible for me to study at the University of
St, Andrews.
My thanks are also due to Dr. A.R, Butler for
offering me space in his Radiochemical Laboratory; to
all the technicians in the Chemistry Laboratory and to
Mrs. Pat Cooper for typing the thesis.
Finally I thank the Commonwealth Scholarship Commission
in the United Kingdom for offering me the Scholarship
for my study.
CONTENTS
Page SUMMARY
(A) Diffusion Section
Diffusion of Ferrocene in Pure Formamide and in
Formamlde Solutions of Selected Halide Salts
INTRODUCTION 1
Diffusion 2
(a) Chronoamperonietry and the Cottrell Equation 8
(b) The Diaphragm-Cell Method 11
SOLUTION THEORY - THE ION SOLVENT INTERACTION 20
EXPERIMENTAL PROCEDURE 24
(a) Determination of Diffusion Coefficients by
Electrochemical Semi-Infinite Linear Diffusion
Technique - The Chronoamperometric Method, 25
Experiments 27
(b) METHOD OF ANALYSIS OF FERROCENE IN FORMAMIDE 40
1 Redox Method 40
(a) Direct Visual Titration 40
(b) The Potentiometric Titration Method 41
(c) Amperometric Titrations • 43
Results 51
2 Spectrophotometry and Spectrophotometric
Titration 54
Absorbance of Ferrocene 56
3 The Radiometric Method 58
Radioactive Ferrocene 58
Extraction of Ferrocene from Formamide by the
Efficiency of Extraction. 60
Stability of Radioactivity in Ferrocene in
Formamide 62
Conclusion on Methods of Analysis of Ferrocene
in Formamide 62.
(c) MEASUREMENTS OF DIFFUSION COEFFICIENT'S OF
FERROCENE IN PLAIN FORMAMIDE AND IN SELECTED
HALIDE SALTS SOLUTIONS IN FORMAMIDE USING THE
DIAPHRAGM-CELL METHOD 63
The Diaphragm-Cell Method with Rotated Magnetic
Stirrers 63
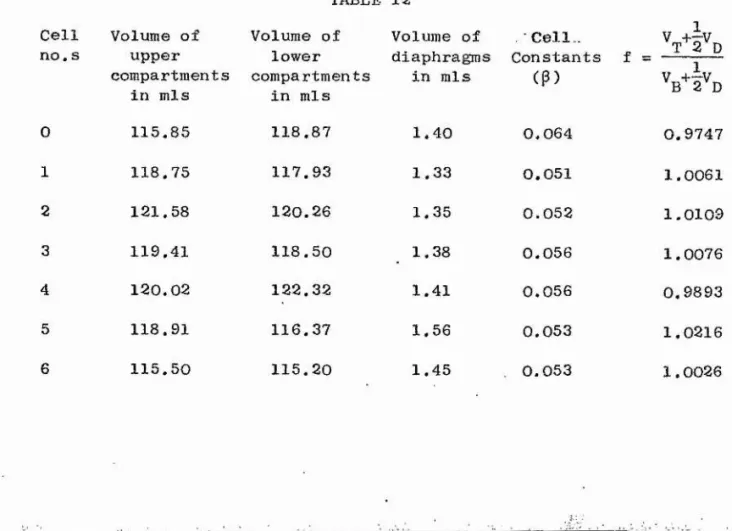
Measurement^ of Volumes of Cell Compartments
and Diaphragm 66
Calibration of the Diaphragm 69
Diffusion of Ferrocene in Formamide and in
Formamide Salts Solutions 71
Formamide 71
Diffusion Experiments 72
Problems with the Diaphragm-Cells Apparatus 74
Diaphragm-Cells without Stirrers 76
Diffusion Experiments 78
(a) Upward Diffusion of Radioactive Ferrocene,
in Formamide and Salt Solutions of Formamide 78
(b) Simultaneous Diffusion of both Ferrocene
and Salt in Formamide 79
RESULTS ‘81
(B) THERMODYNAMICS SECTION
MEASUREMENTS .OF VAPOUR PRESSURES OF THE SYSTEMS;
FORMAMIDE-WATER, N-METHYLFORMA.MIDE-WATER AND
DIMETHYLFORMAMIDE-WATER - BINARY MIXTURES
INTRODUCTION
EXPERIMENTS
RESULTS
1, F^rmamide-Water
123
2, N-Methylformamide-Water
3. Diinethylformainide-Water
DISCUSSION
BIBLIOGRAPHY
123
124
127
129
129
133
136
139
143
I-;-. ÿ. ;.'X:- ■? ■•.- -' ?
'
SUMMARY
A study has been made on the effects of some selected halide
salts on the structure of formamide by measuring molecular diffusion
coefficients. A neutral molecule, ferrocene was allowed to
diffuse in pure formamide and in halide salts solutions of
formamide and its diffusion coefficients were determined. A test
molecule was chosen rather than a test ion in order to avoid
electrostatic effects due to ion-ion and ion-dipole interactions.
Graphs of diffusion coefficient versus concentration of salts were
drawn and the shapes of these curves have been discussed in terms
of the "microscopic" and "macroscopic" effects of these salts on
formamide structure.
Use of two diffusion techniques was made - (i) an electrochemical
diffusion method based on the Cottrell equation and (ii) a diaphragm
cell method based on steady-state diffusion. Only the latter was
successful.
A number of experimental methods were investigated in order to
find a suitable analytical method for determining ferrocene
(necessary for the diaphragm-cell measurements), A method for
preparing radioactive ferrocene and a successful radiometric
analytical technique were developed.
( B ) Thermodynamics Studies
In this section the vapour pressures of binary mixtures of
water-formamide, water-N-methylformamide and water-dimethylfonnamide
were measured using a Zimmerli manometric gauge over several
temperatures. The graphs of partial pressures of water (determined
(A) Diffusion Studies j
I
;
Ii
by a transpiration technique) versus mole fractions of water are
given and explained in terras of the nature of interactions of
water and the amides. By means of the Clausius-Clapeyron equation
the enthalpies of vaporization of water were calculated and the
results versus water mole fractions are shown in graphs. In the
case of water-formamide, the enthalpies of vaporization and the
(A) DIFFUSION SECTION
DIFFUSION OF FERROCENE IN PURE FORÏ\lAMIDE
AND IN FORMAMIDE SOLUTIONS OF SELECTED
HALIDE SALTS.
INTRODUCTION
With the development of better methods of measurement, the
study of diffusion in solution has been considerably advanced in
the last thirty years, Much has been done to use the diffusion
properties of ions or molecules in the liquid phase to understand
their general behaviour in solution and their effects on the
structure of solvents, and to test theories, of the liquid state.
However the majority of diffusion work in electrochemistry has
been confi-wed to electrolytes in aqueous or mixed-aqueous media.
It was the aim in the present work to use diffusion
measurements to study the effects of some selected halide salts
on the structural properties of formamide. The technique was to
measure the diffusion coefficient of a neutral (uncharged)
molecule, ferrocene in this solvent and in salt solutions in
formamide. The uncharged molecule was used in order to avoid
the electrostatic effects; that is the electrophoretic and
relaxation effects which occur in ionic diffusion due to the
ionic atmosphere around the ion. This would enable the
investigation of microscopic viscosity.
Experiments were also planned to investigate the effect
of mutual diffusion of a salt and ferrocene in order to
evaluate any drag effects,
Formamide with the high dielectric constant of approximately
109 ^ ^ is a good solvent for many inorganic aqd organic salts
It also has a low freezing point 2,51°C ^ and a high boiling
.
'
I
I
although its instability particularly at high temperature is u
an inhibiting factor. While a great deal of work has been
'Î
undertaken on the conductances, mobilities and transport \
6 7 8 9 '
numbers of electrolytes in formamide ' ' ' very little has 4
1
been done so far on the diffusion of electrolytes or molecular
solutes in formamide.
DIFFUSION
It should be stated that discussion of diffusion in this
work shall only refer to the liquid phase. Diffusion at its
simplest, can be described as the decrease of a difference in
concentration by mass transport due to molecular motion. It
is a spontaneous and irreversible, entropy driven process which
leads to an equilibration of concentration within a single phase.
Like conductance and viscosity to which it is related the
coefficient of diffusion is a significant property of substances
in solutions.
Eyring and his c o - w o r k e r s ^ ^ ' h a v e treated diffusion in
liquids as a rate process. The pure liquid at rest is considered
to be continually undergoing rearrangements in which one
molecule at a time escapes from its "cage" into an adjoining
empty "hole" and that the molecules thus move in each of the
cartesian coordinate directions in jumps over energy barriers.
If a solute is then allowed to diffuse under influence of
gradient of concentration in this liquid it is easy to visualize
from the above conception that the process of flow will be by
these jumps over energy barriers, and that the direction of
flow will be determined by the frequency of probability of the
forward and backward jumps,
J, the diffusional flow or flux of a substance in a mixture
with other substances may be defined as the amount of this
substance passing perpendicularly through a reference surface of
unit area during unit time. Pick’s first law states that the
flux is proportional to the concentration gradient, that is,that
' ■ u
where c is the concentration of the substance, x is the c)c
distance in the direction of diffusion and :r— is the concentration d x
gradient. This means that the amount of flow of a substance 4
is inversely proportional to the distance from the source of the
substance and directly proportional to the amount of the
substance per unit volume. The concentration gradient,
is the rate of increase of concentration with distance measured
in the direction of the flow. It is usual in diffusion
experimental work to confine diffusion in one dimension in
the positive direction of x and until the present time to use
c,g,s, units of measurement.
Two situations are generally defined in diffusion;
(a) steady-state and (b) non-steady state diffusion. A steady
state is assumed to exist when is considered not to change v
with time, t , and is defined as
where D is the "diffusion coefficient" for the ^substance under
consideration. The negative sign indicates that the flow
measurement is in the positive x-direction from the region of
1
positive value. Partial differentials are used because in general
C is dependent on time as well as distance.
The non-steady state situation takes into account the
variation of c with both time and distance. In such cases the
flux J =: “D ^ is converted into a second order partial ^
3C-differential equation connecting c, x and time t,
J (x,t) = s f e î i =dt
i.e. rate of diffusion at position x and time t is proportional
to the concentration gradient existing at x at time t. The
two quantities J(x,t) and c(x,t) are functions of two variables.
At time t - o the concentration is uniform throughout the
solution. Thus t is taken to be the time elapsed since the
beginning of the diffusion or electrolysis»^ is the distance
normal to the diffusion column or electrode surface.
Consider the section of solution between x and (x + dx)
Let the area of cross-section normal to the tube be unity,
^ C (* X t ^— ' * can be seen to be equivalent to the excess of material
o t
diffusing into the ’’box" over that diffusing out, divided by
the volume of the box.
Therefore y— --- = D — ... 2 This is Pick's second law.
To solve differential equations of this nature one must define
initial and boundary conditions in order to obtain explicit
solutions, that is expressions for the flux at any time t and
any position x.
If c,g,s, units for measurement of length and time are used
“ 2 "1
and J, the flux is expressed in moles cm sec and x in cm;
c will be expressed in moles cm The diffusion coefficient D
can then be recognised as the amount of solute that diffuses
a cross a one square cm area in one second under the influence c
of a concentration gradient The diffusion coefficient may
vary with the concentration of the solute in a solvent and it
is a measure of the diffusing tendency of the solute for a
given solvent at a given temperature. It is these characteristics
which make the diffusion coefficient an important tool in
understanding the interactions of electrolytes and solvents in
electrochemistry.
Perhaps one of the most important ways in which measured
diffusion coefficient values of large, uncharged molecules
have been used has been to test Stokes law and the Einstein
equation. When a molecule diffuses through a medium, a frictional
force sets into balance this diffusion force when some
constant velocity is reached. The frictional force exerted
by a viscous fluid of viscosity ^ was derived for a macroscopic
sphere of radius r by Stokes as;
k. 7”
The Einstein equation D - where D is the diffusion
coefficient, k the Boltzmann Constant and T the absolute
temperature^ is a direct result of Stokes law. Although
Einstein's equation applies only to uncharged colloidal
particles and large spheres the relationship is important
12
both in electrolyte and non-electrolyte solutions. Edward
has pointed out that it is possible to produce an empirical |
correction factor for the Stokes-Einstein equation to enable
one to apply it to small molecules down to 2^ in radius.
A number of workers^^'^^'^^'^^'^^ have tried to explain some
diffusion properties of ions and molecules in terms of viscosity.
The general theme among these workers has been that although
the diffusion coefficients of solutes increase with decreasing
viscosity of the solution the extent to which this happens is
not as great as represented by the Einstein equation. In
their study of diffusion of electrolytes, non-electrolytes and,
colloidal electrolytes McBain and Liu^^ in 1931 combined the
Nernst equation (D ~ where u and v are ionic mobilities at
— 4-—
infinite dilutiqp), ^ ^ which applies to the diffusion of
electrolytes at extreme dilution, and the Einstein equation
into one equation which they stated held good for all
concentrations, even for such a complex case as solutions of
soap. They were also able to calculate from their equations,
the size of the sucrose molecule from its diffusion coefficients
in 0,05 N solution, by assuming it to be a spherical particle
with the density of solid sucrose and found the molecular
weight to be 388 as compared with its formula weight of 342.
r u v'.' '
of about two molecules of water. Another serious attempt at
studying this hydration and shape of molecules was that of
Wang^^ in 1954. He tried a new method of studying the
hydration and shape of protein molecules by measuring the self
diffusion of water in protein solutions, .
lon-pair formation and complex formation of species in
solutions Ûbft an important occurence in solution chemistry. In
their study of diffusion of zinc and magnesium sulphates in aqueous
2o
solutions Harned and Hudson found that their diffusion
coefficients were not only abnormally high but deviated from
theory. After correcting for ion-pair formation the results
led to constant values for the mobility of the ion-pair. Stokes
21
and Reilly have tried to explain the diffusion of cadmium
chloride in aqueous medium in terms of the complexes formed
in the solution.
More recently numerous papers have appeared on diffusion 22 23 24 25
and self-diffusion ’ ' ’ of substances in liquid media.
These workers have measured diffusion coefficients of a number
of substances in different solutions and have tried to use them
to test some theories of the liquid state and to try to improve
on them.
While the interpretation of diffusion coefficients from
diffusion measurements in different solvents and solutions is
no simple problem a great deal of useful scientific information
has emerged from them and more useful information will come
out as the methods of studying the diffusive properties of
substances improve and new theories of explaining them are
developed.
i
The problems to determine diffusion coefficients as •
contained in Pick's laws, experimentally were no mean task
and it took many years to develop reliable methods for
measuring diffusion coefficients in both the steady state
and the non-steady state. There are several modern methods
for accurate determination of diffusion coefficients. These
are the conductimetric method developed by Harned and his 26 27
collaborators ’ in the 1940* s; the GoKy* Interference method.
28
as described by Kegeles and Costing in 1947; the
diaphragm-29
cell method originated by Northrop and Anson ' in 1928 and the
electrochemical method based on the Cottrell equation. The
first two and the last methods are based on Pick's second law
(that is non-steady state conditions) and the diaphragm-cell
method is based on Pick’s first law (steady state conditions).
In the work done here experiments were undertaken to measure
diffusion coefficients under (a) the electrochemical method
and ^b) under conditions as expressed by Pick’s first law.
Only these two methods will be considered below.
(a) Chronoamperometry and the Cottrell Equation
If the redox potential of a system is known,use of the Nernst
equation enables;one to select a potential at which the equilibrium
concentration of one of the components of the couple can be
reduced virtually to zero. If the kinetics of the electron
transfer are rapid then any electroactive molecule or ion
reaching the solution layer in the immediate neighbourhood of
the electrode will be electrolysed instantaneously.
Consider the reaction
- +
and let c(x,t) be the concentration of A at x and t in mol cm
and C be the bulk concentration of A.
Boundary Conditions
(i) At t = o, c(x,o) ~ C that is at any position, the concentration -3
of A is C mol cm prior to electrolysis.
(ii) Assuming that immediate depletion of A occurs when the
potential is switched on, we have C(o,t) = o for t. > o
(iii) Assuming that the experiment is short enough for there
to be negligible change in the concentration of A at distances
far from the electrode surface,
C( o o it)
30
The solution of this as given by Delahay is
C(x,t) = C erf (— T— r 2D^ t"
where erf 0
-■
? J
exp, (~Z )dZ
The error function is a finite integral having zero as the
lower limit and has the form
( O
10
that is erf 0 --- ■•> 1 as 0 ^ 2
This solution, tb •' Pick's second law gives the concentration
of A at all times and positions. Because the diffusing molecule A
is electrolysed as soon as it reaches the electrode surface,
the current flowing at time t is given by
i ^ = nFAJ(o ,t ) = nFJ(o ,t )
since the area of the electrode is equal to the area of the cross
section of the diffusing layer ^c(x,t>
Now J(x,t) = D.
But C(x,t) =s C erf ( -— )
dx
Therefore J(x,t) = —3— (exp ( — r-T ) )
2D*t*
2DC
_ , -X ^2^
1
D ^ Therefore J(o,t) - (-
let
7") Cand hence
t
i, = nFAC(— ) ^ = nFAD^C -~r--r~M
3This equation is known as the Cottrell Equation
(b) In this method the steady state or quasi-steady, state was
established in the apparatus. Quasi-steady state because it is
not experimentally very feasible to establish really steady
state conditions but a condition whereby the concentration
%
!
I
gradient, changes only very slowly with time. Ï
Almost the only really steady state results obtained are y
■: 31
those of Clack , and presented in his article in 1924. Clack
established his steady state by maintaining the concentration
at the lower end of his diffusion column at saturation by means |
»i
11
of a reservoir of solid, salt while at the upper end was
maintained effectively at zero by means of a slow flow of
water. While by using this method the diffusion coefficients
could be directly calculated from Fick's steady state equation
thus simplifying the mathematics the experimental difficulties
of establishing and maintaining the steady state were too great.
A quasi-steady state was reached in the present work by using
the diaphragm-cell method for measuring diffusion coefficients.
The Diaphragm-Cell Method
The difficulty in measuring diffusional flows is that
mass transfer in liquids across any plain of reference can take
place not only by diffusion but also by convection currents or
bulk flow. The fundamental idea of the diaphragm method is to
eliminate these disturbing effects (often due to mechanical
vibrations or small temperature fluctuations) by confining the
diffusion process to the capillary pores of a sintered glass
diaphragm. There are a number of factors which have to be
considered in using the diaphragm-cell. The first is that an
approximate steady state is established at all times during an
experiment. This is accomplished by performing a "prediffusion"
prior to an experimental run. This is a procedure in v/hich
material is allowed to diffuse for some length of time until
a concentration gradient which does not change markedly with time
is established before an actual diffusion run is timed. The
establishment of a steady state can also be greatly helped if
the volumes of liquid in contact with the sinter are large
12
Secondly since the overall area and ' length of the
diffusion path have to be known in order to measure the diffusion
coefficients and these in a sinter cannot be measured directly
the diaphragm-cell has to be standardized against absolute
diffusion methods such as the conductimetric or the Gouy
Interference method. Since the geometry of the sinter is constant
this may be done by calibration with a system with known
diffusion coefficients in order to obtain a cell constant, ÿ
A third problem is the existence of stagnant layers on
€
the diaphragm. It is a paramount condition in accurate diffusion
1
work that the diffusion process be confined entirely to the pores
of the diaphragm. This condition is achieved by stirring the
solution to maintain a uniform concentration in each compartment
right up to the surface of the diaphragm. If relative rather
than absolute diffusion coefficients are the aim of the diffusion
experiments this condition can be relaxeti if there is negligible
density gradient between the solutions in the diaphragm cell.
This situation is explained later on,
finally it is important to choose pores of a diaphragm
which are not too coarse to allow transport to occur by bulk
streaming through the diaphragm as well as by diffusion; a
condition which is more likely to occur if the denser liqui^et is 32
above the diaphragm
It was the desire to prevent convection currents which
were inherent in the classical diffusion methods and to accelerate 29
the diffusion process that first led Northrop and Anson , the
originators of the diaphragm method, to confine diffusion across
porous diaphragm. The diffusion apparatus which they assembled
13
is shown in Figure I. Tho cell contained 2u cc of solution
and the external solution would be 10 to 50 cc depending on rate
of diffusion. The cell was calibrated with hydrochloric acid
lactose or ■ - salts whose diffusion coefficient were known.
Stirring of the solution to maintain uniformity was done by
putting the denser solution in the top part of the apparatus
and thus induc/nja density gradient streaming of the solution.
SoLyJC.n't
U roW ersal
Tomtit
I
' 2 0 c c
14
%
••I
I
The experimental run was timed alter a steady-state condition was
reached. The existence of a steady state was proved by taking
samples of the bottom solution and analysing them, A steady
state was established when the amount of solute passing through the
membrane per equal time interval was the same. With this
apparatus Northrop and Anson were able to measure the diffusion
coefficients of the haemoglobin molecule and use them to calculate
its molecular weight.
In the following decade a number of workers suggested
modifications to the Northrop and Anson cell and developed the
diaphragm-cell as is known to-day with two glass compartments >“
divided by a sintered glass diaphragm. In the middle 1930s 33
McBain and Dawson used a double-ended cell with two compartments
of almost equal volumes separated by a sealed-in membrane of
sintered glass to measure the diffusion coefficients of potassium
chloride. This was an improvement in that after a preliminary
diffusion*solutions on both sides of the diaphragm would be
emptied without disturbing the established diffusion columns in the
sinter and filled with fresh solutions of accurately known
composition. They still used density stirring. But later,
Mouquin and Cathcart^^ and Hartley and Runnicles^^ showed that
density stirring was insufficient particularly when density differences
between solutions are small and in their cells they used 34
mechanical stirring. Mouquin and Cathcart used balls which
fell through the solutions as the cell was inverted end over end
35 «
while Hartley and Runnicles used glass balls which rolled on the
diaphragm as it rotated in a slanting position.
With the use of diaphragm-cells it was no longer easy to
15
29
established before timing the experiment as Northrop and Anson 36
had done. A rough but safo procedure was suggested by Gordon' J
2
using what is now known as the "Gordon inequality", ÎJ77X- > 1.2,
2 "1 «
where D is the diffusion coefficient in cm sec and m is the
"apparent thickness" of the frit 1 , 6 x actual thickness)
and GT is the prediffusion time in seconds. For the usual type .g
37 Î
of frit t, ÇS- 0.4 cm . Although it has been shown lately that j
sÀ
the Gordon inequality overestimates the time required to i
37 38
establish a linear concentration distribution ' it still
remains a useful guiding principle to a difficult problem.
But the most important contributions to the development of
the diaphragm-cell as an accurate method of determining diffusion
■ÿ
39 4
coefficients were those of Stokes . After a thorough investigation %
1
of the diaphragm-cell Stokes made several recommendations and
tabulated the guiding procedures which have now become standard.
Stokes showed that neither density gradient stirring nor ball rolling
was sufficient to remove stagnant layers off the diaphragm. He
used a rotating magnet to rotate the stirrers both on top and
bottom of the diaphragm. The stirrers were sealed glass tubes
enclostP^ Qtrix iron wire. He also recommended diaphragm-cells of
number 4 porosity. Stokes calibrated his cell with aqueous
potassium chloride whose diffusion coefficient values had been
carefullj^measured by the conductimetric absolute method by
Hart^ed and Natta 11 An authoritative review of the diaphragm-cell
38
has been carried by Mills and and Woolf who have also made
important Innovations. But generally the Stokes cell is now
universally used.
However for all the advantages that the diaphragm-cell has
over the classical, m e t hods, it has a serious limitation. It has
16
been shown that the diaphragm-cell measurements on dilute
electrolyte solutions below about 0.05 M, when compared with
absolute measurements give higher results. The effect seems to arise
through an enhancement of mobility in the electrical double layer 41 on the pore walls. This has been confirmed by Mysels and McBain
by conductivity measurements in a cell in which a porous diaphragm
was interposed between the electrodes. Although to a great extent
in the present work the above limitation was not important since
a non-electrolyte was used it became important in a mutual
diffusion experiments of the non-electrolyte and the electrolyte.
Despite the experimental advantages of the diaphragm-cell
it is not simple to derive the actual differential diffusion
coefficient D from the diffusion measurements. What is easily
derived mathematically from Pick's first law is a quantity D,
a complicated double average known as the diaphragm-cell integral 32
coefficient, Robinson and Stokes have given a mathematical
procedure for deriving the diffusion coefficient, D^values in
diffusing electrolytes. Let it be assumed that diffusion of
the solute is from bottom of the diaphragm-cell to the top. Let
the volume of the lower compartment of the diaphragm-cell be
the volume of the upper compartment be and the volume of
the diaphragm be V^. The concentrations of the diffusing solute
at the beginning and end of the experimental run should be denoted
by C^, Cg and where is the initial concentration of
the bottom compartment; is the initial concentration of the
top compartment; is the final concentration of the bottom
compartment after the run and is the final concentration of
the top compartment. The total effective cross-section of the if
:
i
S"-— r '
- G" J e "
Then D(t) = — -t - -- ^ D de = 7 ) D(~^) dx
G *^X" 0
lJ(t) c ' - c'
17
diaphragm pores should be written as A and their effective average
length along the diffusion path as 1. The diaphragm is ^
4
assumed to be in a steady state during the experiment. The '|
-I
flux J will however vary slowly with time, decreasing as the
process of diffusion reduces the concentration~diffei'ence. To
emphasize this the flux shall be written as J(t),
If the concentrations of the upper and lower compartments
are denoted by c" and
o'
respectively, the rates of change ofthese concentrations are related to the flux t) by;
g ' - - Ï,
I
Subtracting the top rate of change from the bottom rate of change *
4 of concentration with time gives
— ...4
An average value of the diffusion coefficient D with respect
to concentration over the concentration range c ' to c" prevailing
at the time consti<iered is now introduced^this quantity D is
also a function of time and is denoted as D(t);
Since J(t) - - D is a constant for all points within the
diaphragm at time t, x being the distance of the plane considered
from the lower surface of the diaphragm. Combining equations
4 and 5 gives
■' . . : .J
38
d In (c* - c")
dt t 4 + V ) 5(dt)
1 ^2 •
Intergrating between the initial and final concentration
conditions give
In “ c
\
t=t
t"0
D(t) dt
D is defined as tïie time-average of DCt) (which is itself
already a concentration-average) that is •t
D(t)
If (A/1) (~ -J- — ) the cell constant is denoted by j3, then
1
2
= - F . ‘ " è 4 ÿ
The problem is now to convert D, the diaphragm-cell integral
coefficient into the required differential coefficient D, 36
Gordon has however demonstrated that a negligible error is
introduced in all ordinary cases of D is related to D by : ^cm*
1
\
D D dc
cm cm
where cm* = c^ + c^ and cm"
-cm
If the diffusing solute is an electrolyte and if its Nernst
limiting value is known (i.e. that accurate limiting ionic
conductivities are available) D at various values of c from
a set of D values obtained in experiments using various
concentrations can be obtained by a method of simple graphical
approximations. On the other hand ij- the solute is non-electrolyte
or an electrolyte whose Nernst limiting value is unknown a
39 certain mathematical assumption has to he made, Stokes
42
and Stokes and Hammond assumed a suitable analytical expression
with arbitrary coefficients for D as a function of c and the
coefficients determined so that equation 7 will fit the
observed D values,
A quantity D°(c) is defined as the average D with respect to
concentration over the range o to c
DG(c) = — \ D dc
'
J o
43
This quantity has been computed by Stokes for potassium
chloride at 25^0 from D values of Harned and Nuttall^^ and of 44
Costing
D = r5G(cm') - ^ 7 5 G(cm")]/(l-^")
g
The cell constant (j3) of the diaphragm-cell used in the
present work was determined by a calibration with aqueous potassium
chloride. The D°(cm) values at various concentration, c, are
tabulated by Stokes^^. A graph of D°(c) versus c was drawn and
from it the 0^(0111) values at different concentrations at the
end of the aqueous potassium chloride diffusion run were
determined. Once the values of D°(cm) were known e q u a t i o n ^
was used to calculate 5, D is related to (P ) as shown in
20
Solution Theory - The Ion-Solvent Interaction
The study of ion-solvent interaction has come a long way
since the days of Arrhenius who in 1887 made the then radical
postulate that many solutes exist wholly or in part as ions
when in solution. In 1920 Born formulated an approximate model for
ion-solvent interactions. In the Born model, an ion is viewed as
a rigid sphere (of radius r^) bearing a charge (1^ is the
electronic charge) and the solvent is taken to be a structureless
continuum. The model thus suggests a simple method for calculating
the free energy of ion-solvent interactions, that is the work of
transfering an ion from va'cuujTi into the solvent. In the 192o's
Debye and Hückel put forward their ionic interaction theory in
dilute solutions. The basic point of this theory is the idea of
an "ion atmosphere", that is a cation has in its neighbourhood an
excess distribution of anions while an anion is surrounded by an
excess of cations. All ions are considered to be surrounded by
solvent molecules and the extent of this solvation depends on the
polarity (that is, in the main on dipole moment) of the molecules of
the solvent. Thus ionization of the solute will be determined by
this shielding effect on ions by solvent molecules. This prevents
the ions of unlike charges of the solute from recombining to form
neutral or uncharged entities.
The weakness of the Born model was to assume the structure
of the solvent to be a continuum. The best way to look at the
problem of ion-solvent interactions is to understand the structure
of the solvent and how this structure affects the behaviour of ions
21
solutes. An acceptable way of looking at this for aqueous solutions
was that presented by Frank and. Wen^^' in 1957, Apart from the
direct action of the ionic charge on water as a dielectric medium,
they also considered how ions may exert an influence on the equilibrium
between the ice-like and non-ice like forms which are present in
roora-temperature water. This provided a way of accounting for experi
mental results in a variety of areas, including diffusion, viscosity
and ionic mobility. In this model a small ion is pictured as being
surrounded by three different layers of solvent (water) molecules.
Since water is a polar, structured solvent it is a forgone
conclusion that its structure will be affected by the presence of
ions due to ion-dipole interactions. If an individual ion is singled
out in an aqueous medium it is easy to visualize that the ion-dipole
interactions will be strongest nearest the ion and will diminish
a s the distance away from the ion is increased until a region where
there will be no electrostatic interactions. It is generally
agreed that in aqueous solutions of ions not larger than the caesium
cation (Cs^) and the iodide ion (I ), the nearest neighbour water
molecules are always essentially immobilized by direct ion-dipole
interactions. These molecules can be said to be trapped and
oriented in the field of the ion. This is the first layer. The
second layer around the first one is an area where there is less
but sufficient ion-dipole interaction to disrupt the normal structure
of water. The structure of the solvent in this region will be a
compromise structure between the tetrahedrally bonded networks
characteristic of normal water and that of the first layer. The
third layer is that where there are no or practically no ion-dipole
interactions and will be Just the ordinary structure of water.
"i
I
j’:
22
!
.î
I
The immobilized water molecules in the vicinity of the ion ceases
■' !
to associate with other water molecules to form the network
characteristic of water. If the ion moves, these immobilized water
molecules move with it. Immobilization thus enhances the structure %
of the solvent in this region. In the intermediate region
(that is, second layer) between the inner-most region and that of
bulk water the structure is partly broken down.
Prom this picture an ionic solute can thus be described as
a structure maker (that is, one which enhances the structure of
the solvent) and a structure breaker depending upon its effects
according to these three visualized layers or degree of solvation.
Structure makers are those ions which manage to immobilize a lot
of solvent molecules around them; that is in which the first layer
is predominant over the second layer or stabilize the amount of
structured solvent at a distance from the ion. Structure breakers
are those ions which are incapable of immobilizingmiany solvent
molecules around them but substantially disorganize the solvent
structure. In this case the second region is predominant over
the first. Certain solutes, particularly the hydrogen-bonding solutes /
or groups like -NHg or -OH, do not seem to alter the structure
of water very much, if at all. This may be so because these solutes
or groups are able to enter the water structure with only slight #
distortion, and to transmit both forming and
structure-disrupting tendencies. On the other hand small ions or highly
charged ions which are strongly solvated, that is, they have
immobilized many water molecules around them are known to be
structure makers and large ions or ions of less charge are
23
rnoro highly charged than potassium ion (K ) are net structure
makers or formers and become moio strongly so the smaller and the
more highly charged. K is slightly structure breaking on
balance and this tendency increases. through rubidium ion (lib*^)
+
-and caesium ion (Cs ). The fluoride ion (F ) is a structure-former
and other halide anions are structure breakers increasing in
tendency with size.
The structure of solid formamide has been determined by 46
X-ray diffraction analysis and it appears from this that the
high dielectric constant 109,5 ± 0.2 at 25^0 ^ in the liquid is 3 probably due to the formation of "flickering" chain structures ,
It is thus reasonable to consider extending the general theories
developed for aqueous solutions to electrolytic solutions in
formamide.
1
24
EXPERIMENTAL PROCEDURE
' 1
i
25
(a) Determination of Diffusion Coefficients by Electrochemical
Semi-Infinite Linear Diffusion Technique ^ The Chronoainperometric
Method.
Three modes of mass-transfer are normally encountered in
electrode reactions. These are migration, convection and diffusion.
Mass-transfer by migration is a result of the force exerted on
charged particles by an electric field. Convection arises from
thermal, mechanical or other disturbances of the solution.
Diffusion exists whenever concentration differences are established
as discussed in the Introduction under "Diffusion". During an
electrode reaction a concentration gradient develops as soon
as electrolysis starts. If migration of the electroactive
species to the electrode is minimized to negligible proportions
(in the case of ionic species by addition to the solution of excess
background electrolyte) and the cell is free of mechanical and
thermal disturbances; that is, migration and convection of the
electroactive species are absent, one can restrict its
mass-transfer to the electrode to diffusion alone. By in turn
restricting diffusion to one direction only linear diffusion can
be obtained. One can make the dimensions of the cell very large
with respect to the electrode and fix the electrode firmly to
the cell walls in such a way that diffusion is exactly in one
direction without any peripheral contributions. In addition to that,
if the concentration of the diffusing material is maintained at
a value of practically zero at the electrode surface by maintaining
a potential at the electrode such that the diffusing material is
immediately oxidized or reduced upon reaching the electrode
26
established. Under these conditions the current is
experimentally found to be proportional to the concentration
(Co^^) of the diffusing substance in the bulk of the solution
and proportional to the area (A) of the electrode. Also, the
current decreases with time of electrolysis, A derivation
using' the linear diffusion technique . measured with great
precision diffusion coefficients of a number of substances in a
number of background electrolytes. Since the geometric area of
the electrode is normally different from the electrochemical
area, it is important that the latter be determined. It is
recommended^^ that all electrochemical electrode area measurements 1
be calculated from an it determination on potassium ferrocyanide
i
which connects^current and time is the Cottrell Equation; nFAC
i . = — r— i as outlined above in the Introduction which
*
J t i
allows the diffusion coefficient to be determined.
If current during electrolysis can be followed with time at
a constant potential, one then has a "chronoamperometric" method
for the determination of diffusion coefficients of substances in
solution. An experimental evaluation of linear diffusion is usually
made by checking the constancy of the product it^ with time.
Precise studies of linear diffusion to solid electrodes were first
made by Laitinen and Kolthoff^^'^ who showed that unless the f
direction of the diffusion is such that the less dense solution
(either the diffusing material or the electrode reaction product)
lies above the denser solution, convection currents due to density
gradients cause greater supply of diffusing material to the
electrode than by diffusion alone and consequently the measured 49
27
in aqueous 2M potassium chloride as supporting electrolyte using 49 the diffusion coefficient results of von Stackelberg et al
The linear diffusion technique was used in the present work
to try to measure the diffusion coefficients of ferrocene in
formamide at 25°C in a number of halide salts. The cell used was a
three electrode assembly constructed from a block of Teflon, as
shown in Figure 2 below. The three electrodes were a flat, polished 4
s
platinum disc as test or working electrode; another plqti'hOR, sheet as
‘.i-counter-electrode and a saturated calomel electrode as reference.
Holes were bored through the body of the Teflon block through which
water from a thermostated bath was circulated. This maintained the
temperature of the cell and solutions at the 25°c working
temperature. The potential was controlled by a Heath polarography
module (Model EUA-19-2) and associated operational amplifiers,
(Model EUA-19-4), The whole apparatus is shown below in Figure 3. 4
EXPERIMENTS
The Teflon cell was washed in Teepol in an ultrasonic bath
and then with distilled water. The platinum electrodes were cleaned
by dipping them in strong chromic acid for about two minutes and
thoroughly rinsed with distilled water. This electrode cleaning 50 procedure was done at least every day the electrodes were used
The calomel electrode was periodically refilled with fresh, saturated
potassium chloride aqueous solution.
The method of pretreatment of the test electrode as recommended 50
by Adams was tried but was not successful, Th.is method
demands that after washing the electrode as explained above a
■ '', f- <>'■; v.‘r ■ ■
Wfvre.^
WfvT^ O'OTLB.-r
#
n
COVNTE:<2L eLe:cr«^Tai>(<
r'
.■ÿ ■#.
' \ t'/.", T. r;
29
ST£P PoreHTtfiL
P o T G N T l 05T/1T
i
F i %
3
B LOCK.
Q çECECTKOCHCMtC/K.
D i F F U & l O N A P P A R A T U S
I
30
be applied to it to reduce its surface oxides until the cathodic
current decays to zero. Then the potential is moved slightly
anodic (about +0.05 V versus SCE) to reoxidize any sorbed hydrogen
now on the electrode surface until the anodic current for hydrogen
dissolution decays to close to zero. In-the present work pretreatment
was done by filling the cell with appropriate solution of the
background electrolyte. The apparatus was then set at the working
constant potential of the diffusing substance until current fell
almost to zero. The effectiveness of this pretreatmont method
was checked by upward diffusion experiments on aqueous potassium
ferrocyanide with potassium chloride as background electrolyte at
0,7 V constant potential. The graphs of i t “ versus time (t)
gave straight lines as are required if the test electrode was in
perfect working condition. In these and all subsequent
experiments the background current caused by (a) charging current
and (b) small impurity Faradaic currents, of each respective
background electrolyte in appropriate solvent at constant potential
of the diffusing material was noted for as long as the actual
experiments would take and the results were subtracted from the
a ctual experimental diffusion currents.
Measurement of the electrochemical area of the test electrode
was undertaken with aqueous 5 x 10 M potassium ferrocyanide in
aqueous 2 M potassium chloride. The it^ obtained was then used to
calculate the area using the appropriate von Stackelberg diffusion
coefficient value. The area of the electrode so determined was
confirmed by doing a number of upward diffusion experiments
on different concentrations of potassium ferrocyanide with
aqueous 0.1 M potassium chloride. Downward diffusion
experiments were also done on silver nitrate with
aqueous 0.1 M potassium nitrate as supporting electrolyte
%
31
as a further check on the method. A straight line was drawn by
Computer through the points of it^ with time. The line was 1
extrapolated to zero time and that it^ was used to calculate
diffusion coefficients from the Cottrell Equation. The diffusion
coefficients so obtained were used to recalculate the currents
at different times for each respective case, A perfect
fitting curve through the points of currents versus time was
a measure on the accuracy of the diffusion coefficient. This
is shown by graphs Figures 4 and 5. The other results are also
shown below,
RESULTS
1, The electrochemical area (A) of the test electrode was 0,7073 cm"
2
This is compared with the geometric area of 0.535 cm measured by a
travelling microscope,
2, Diffusion coefficients of potassium ferrocyanide at different
concentrations in aqueous 0.1 M potassium chloride at 0,7 V
constant potential at 25°,
-4
(a) 2 X 10 M potassium ferrocyanide diffusion coefficient was
0,629 X 10 ^ cra^ sec ^ , The experimental parameters are shown in
Table 1.
■I
-Î
'I
32 •
4
TABLE 1
4
4
a
Background Total Faradaic it^
"
1
Time (t) current current current Paradaic current
in secs. microamps.in microamps.in microamps,in X time -i
1
1 2 3.46 1.4 6 . 8 5.4 18.68
Î
16 4.0 1.3 6 . 2 4.9 19.6
1
2 0 4.47 1 . 2 5.5 4.3 19.2
.
1
24 4.90 1 . 1 5.2 4.1 2 0 . 0
-
i
28 4.29 1.05 4.8 3.75 19.8
J
ji:
32 5.65 1 . 0 4.5 3.4 19.2
1
26 6 . 0 1 . 0 4.3 3.3 19.8
40 6.32 0.95 4.1 3.15 19.9
1
44 6.63 0 . 8 3.9 3.1 20.5
48 6.93 0 . 8 3.7 2.9 2 0 . 1
52 7.14 0 . 8 3.5 2.7 19.3
56 7.48 0 . 8 3.45 2.55 19.1 ’■'1
6 0 7.74 0.75 3.3 2,55 19.7
64 8 . 0 0.75 3.2 2.45 19.6
68 8.24 0.75 3.1 2.35 19.4
72 8.48 0.75 3.0 2.25 19.1
76 8.72 0.75 2.85 2 . 1 18.3
80 8.94 0.75 2 . 8 2.05 18.3
84 9.16 0.65 2.75 • 2 . 1 19.2
8 8 9.38 0.65 2.7 2.05 19.2
92 9.59 0.65 2 . 6 1.95 18.7
V
96 9.8 0.65 2.5 1.85 18.1
o
A-R
LT O
Cl O
L'1
O s Cl m
o :
co o
33
CURRFM: lîÜCRGRMPS!
O
i h
V
Cn
f
S
'cP
>!
g
c
■>
I
>i
6m/
o
Cl
o
Cl
\A 1/1
€
34
CUkRPHT (MICRGRMPS!
6 i
o Ll
O I.)? ru ruwi w Ü7
Ü1
if
o7: 2: t?
if %
o
o
CL O
VJ
O
r-o
Ll O
CD
C
•NJ o
CÜ o
U3
CD
cn r’ o CD
CiT