Effects of the topology of social networks
on information transmission
Jason Noble, Simon Davy, and Daniel W. Franks
School of Computing, University of Leeds, Leeds LS2 9JT, UK
[jasonn|wavy|dwfranks]@comp.leeds.ac.uk
Abstract
Social behaviours cannot be fully understood without considering the network structures that underlie them. Developments in network theory provide us with relevant modelling tools. The topology of social networks may be due to selec-tion for informaselec-tion transmission. To investigate this, we generated network topologies with vary-ing proportions of random connections and de-grees of preferential attachment. We simulated two social tasks on these networks: a spreading-innovation model and a simple market. Results indicated that non-zero levels of random connec-tions and low levels of preferential attachment led to more efficient information transmission. The-oretical and practical implications are discussed.
1.
Introduction
The origin of social behaviour was a major transition in evolutionary history. Sociality opens up a wide range of new strategies for doing well in the world, and many of these strategies involve sharing information. Social animals have evolved elaborate communication systems, such as the dance used by a honeybee to tell others about the location of a food source (von Frisch, 1967). Social behaviour combined with the ability to learn means that animals are not limited to individual trial-and-error, but can learn from the behaviour of their conspecifics. Rats, for example, can learn from other rats about which foods are safe to eat (Galef, 1996); chimpanzees can socially learn new ways of exploiting a food source, such as fish-ing for termites by probfish-ing termite mounds with thin sticks (Tomasello, 1996). In our own species, of course, communication and social learning have reached great levels of sophistication and have made possible our tech-nological progress.
The study of communication and social learning in an-imal species is the province of behavioural ecology and of ethology. In the human case, linguists are interested in understanding how language is used to communicate, how it is learned, and how it evolved. In the artificial sci-ences, researchers attempting to build useful multi-agent
systems (in either robotic or software form) have taken inspiration from both biology and linguistics. Across all of these domains of inquiry, progress has been made by focusing on dyadic interactions, such as a young animal learning from its parent, or two people having a con-versation. However, the bigger picture—who talks to whom, who learns from whom, etc.—has generally been neglected. Social behaviours such as communication or learning cannot be fully understood without consider-ing the social network structures over which information transfer occurs. Indeed, social behaviour both shapes and is shaped by such networks. This paper represents a first step in taking social networks more seriously: the aim is to simulate some simple social tasks over a range of possible network configurations in order to see whether particular topologies of the social network promote more efficient information transmission.
The neglect of social networks in much of the existing work on social behaviour is not down to simple laziness on the part of the investigators. Given the mathematical and computational formalisms that have typically been used to express theories and models, rich representations of network structure were simply not possible. The indi-viduals in a population are assumed to constitute a fully connected network, and an instance of learning or com-munication takes place between two randomly chosen individuals. (Consider classic adaptive behaviour work on communication such as Steels, 1996). But it is clear that populations of social organisms are not randomly structured in this way. Depending on the species, ge-ographical ranges, family groupings, dominance hierar-chies, cliques, dialects, and many other factors could all influence the likelihood of any two individuals interact-ing. Given advances in computing power and individual-based modelling techniques, it is now possible to con-struct models of social behaviour in which complex social networks can be directly represented. It is an open re-search question as to the extent to which current theories will need to be revised once the simplifying assumption of random social interactions has been dropped.
iterated learning model of language transmission, Smith and Hurford (2003) have looked at what happens when a language learner receives input from varying numbers of both parents and siblings. Smith and Hurford have found that incorporating the social network in this way places severe restrictions on the conditions for optimal language transmission: contact needs to be limited to a small number of parents with minimal input from sib-lings. Similarly, in a model of social learning, Noble and Franks (2002) found that the details of who learns from whom affected the efficiency of different social learning strategies. Imitation worked best if directed towards a parent, whereas emulation (a less sophisticated strategy involving attention to positive outcomes experienced by other agents without the ability to copy their specific actions) was most effective given input from randomly encountered conspecifics.
Given that social network structure makes a difference to social behaviour, it makes sense to try to capture it in our models of such behaviours. But how should we do so? How exactly are human and animal social networks typically structured? These are big questions. Fortu-nately, the recent explosion of interest in network theory provides us with the theoretical tools needed to start an-swering them. Network theorists have given us classifica-tion schemes and generative models of network structure, as well as various statistical measures that can be used to characterize networks. Space precludes a complete dis-cussion of network theory here, although see Newman (2003) for an excellent introduction. However, we will briefly consider several basic types of networks in order to illustrate the thinking behind the model presented in the next section.
Perhaps the simplest type of network is a random graph (Erd¨os & R´enyi, 1959), in which every node is equally likely to be connected to every other node. The only parameter needed to describe such a network is the average number of connections per node (also known as the average node degree). Random graphs have been a useful mathematical formalism but it is widely recog-nized that they are not a good model for any real-world network. Characteristic properties of random graphs in-clude a short average path length and very low tran-sitivity. The average path length of a network is sim-ply the mean of the minimum distances between every pair of nodes, where paths are measured along connec-tions. Transitivity refers to the likelihood that a node’s neighbours will themselves be connected to each other (usually measured in terms of a clustering coefficientC, being the average of the proportions of the n(n−1)/2
possible inter-neighbour connections that exist for each node, withC being defined as 1 for nodes with less than two neighbours).
Small-world networks (Watts & Strogatz, 1998) have received a great deal of attention lately. The idea is to
start with a network that is connected in some regular way, such as a large ring of nodes in which each one is connected to its two nearest neighbours on the left and its two nearest neighbours on the right. Such a network is highly transitive (C = 0.5 for the setup given) but the average path length will be long as many hops are needed to connect a node on one side of the ring with a node on the other. However, if a small proportion of the connections are randomly rewired, this effectively creates short cuts across the ring, without destroying the overall clustered structure of the network. The result is a small world network, with the notable combination of a high degree of transitivity and a short average path length. Anecdotal evidence suggests that human social networks may share these characteristics: many of our friends know each other (transitivity), and we can often find surprisingly short chains linking ourselves and an arbitrary stranger (short path lengths).
In the small-world network example given, the node degree is constant at 4 connections per node. In many real world networks, the distribution of node degrees is not flat, but highly variable. In particular, Barab´asi and Albert (1999) noted that node degrees are often found in a scale-free or exponential distribution. That is, there are many nodes with only a few connections, while a few nodes have many connections. (Another way of putting this is to say that the distribution of node degrees is long-tailed or heavily skewed to the right.) Consider for ex-ample the internet, where most machines are connected to only one or two other machines, whereas major hubs may have many thousands of connections. Barab´asi and Albert suggested the preferential attachment algorithm for generating such networks: nodes are added to the network one at a time, and upon its arrival each node will make one or more connections to existing nodes. However, these connections are not made at random but are allocated preferentially to existing nodes that al-ready have a higher-than-average number of connections. Thus, nodes rich in node degree get even richer as the algorithm continues. Barab´asi and Albert explored the properties of scale-free networks generated using prefer-ential attachment and found that, despite the absence of a regular substrate, they share the critical properties of small world networks: high transitivity and a short aver-age path length. They also have a negative node degree correlation, which means simply that a connection from a high-degree node is likely to lead to a low-degree node and vice versa.
real-world examples such as computer networks. New-man and Park (2003) found two distinctive features of social networks. The first was that transitivity is unusu-ally high. The second feature was that social networks show positive node degree correlation. This can be il-lustrated by the idea that well-connected people tend to know lots of other well-connected people, and loners tend to know (if anyone) other loners. Positive node degree correlation stands in contrast to the negative correlation seen in scale-free networks such as the internet, where hubs connect to single machines and vice versa.
Newman and Park’s work is not definitive—there may be other distinctive features of human social networks not yet enumerated—and it is not at all clear that these properties will also apply to the social networks of other species. However, the fact that social networks can be shown to have distinctive structures raises what is for us an exciting theoretical question. Social networks in the natural world must be a product of the social be-haviours of the agents involved. These bebe-haviours must have been subject to selective pressure of some kind; either natural selection in the case of instinctive social behaviours, or some sort of cultural selection in the case of learned behaviours. It seems likely that the quality of the information an agent receives via its social network was a factor in this selective process. It therefore follows that we might expect some naturally occurring social networks to have been optimized for their efficiency in transmitting information between members of a popula-tion. If this is so, what sort of structure would we expect the networks to have? Could the properties observed by Newman and Park, for instance, be the product of selec-tion for individuals whose social behaviours lead them to form networks with just these characteristics? One goal of the work presented here is to begin to answer this question by comparing the effectiveness of different network topologies in supporting the transfer of infor-mation. Of course, it is also possible that the structures of social networks are spandrels; that they have not been directly selected for but are the by-products of selective pressure on other aspects of social behaviour. This con-clusion would be supported by showing that networks optimized for information transfer look nothing like real social networks.
Another goal of our work is entirely practical. In building a multi-agent system to perform some function, we can take inspiration from biology but there is no re-quirement for biological fidelity. So what sort of network topology should be imposed in order to facilitate infor-mation sharing between agents? The multi-agent system we have in mind is a form of market-based control for the coallocation of jobs and resources in Grid comput-ing (Davy, Djemame, & Noble, 2003). Other authors (Byde, Salle, & Bartolini, 2003) are interested in a sim-ilar market-based control system for resource allocation
in large scale (∼ 50,000 node) computing clusters. In
both systems, processors and jobs are treated as eco-nomic agents in a marketplace, with jobs bidding for suitable processors, and processors offering CPU cycles for sale. When dealing with large-scale systems, cen-tralized allocation approaches and all-to-all connection schemes cannot work due to congestion. Clearly what is needed is some type of network linking the agents, over which bids and offers can be transmitted. However, nothing is known about what sort of network topology will best support the operation of such a market. In the simple model presented below, we have chosen one of two social-information-sharing tasks with this prob-lem in mind. More generally, we suspect that a better understanding of social networks will have payoffs for multi-agent system design, in that designers will have better guidelines for deciding who or what an artificial agent should communicate with, who it should trust, who it might want to imitate, etc.
2.
The model
Each node in our model represents an individual, such as a person, an animal, or an artificial agent. We be-gan with isolated nodes positioned on a regular spatial substrate, i.e., a grid. Our networks consisted of 2,500 nodes arranged in a 50×50 array. Of course, real
so-cial networks are not formed simply through every in-dividual linking to their four immediate neighbours in space. However, we wanted to capture the idea that social networks have the physical world as their ulti-mate substrate, and, generally speaking, increased phys-ical proximity between two individuals means a higher probability of a social connection existing. The various network layouts that we explored deviated from this un-derlying spatial grid to greater and lesser degrees.
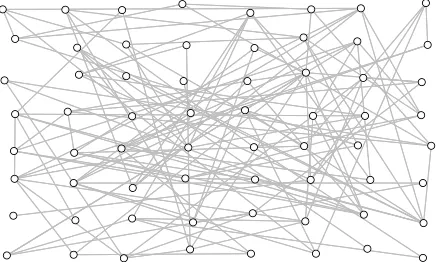
Our aim was to generate a wide range of network topologies. In order to do this we devised two axes on which the layouts of our networks could vary (not to be confused with the two dimensions of the underlying spatial grid). For the first axis of variation we took in-spiration from work on small-world networks, in which network properties change dramatically as a few ran-dom, long-range connections are added. We therefore varied the probability with which a connection would be either local or random; we called this parameterR. WhenR = 0, all links are local (see Figure 1). When
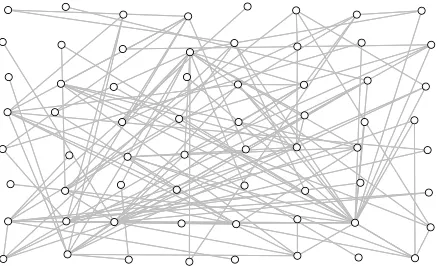
R = 1, all links are random (Figure 2). A major find-ing with respect to small-world networks is that small proportions of random connections can make a big dif-ference. We therefore investigated the following values forR: 0, 1
256, 1 128,
1 64,
1 32,
1 16,
1 8,
1 4,
1
2, and 1.
Figure 1: A sample network withR= 0 andP= 0, i.e., local
and egalitarian connections. This could become a small world network with the addition of a few long-range “short-cuts”, i.e., with R ≈0.05. Note that this and subsequent sample
networks have only 64 nodes and 128 connections (i.e., 4 per node); 2500 nodes and 10000 connections were used in the simulation runs.
Figure 2: A sample network withR= 1 andP = 0, i.e.,
[image:4.595.71.288.130.263.2]long-range but egalitarian connections. This is a random graph as described by Erd¨os and R´enyi (1959).
Figure 3: A sample network with R = 0 and P = 1, i.e.,
local and preferential connections. Note the formation of local “hubs”.
to the edges and corners of the 50×50 grid had a
corre-spondingly smaller neighbourhood.) A local connection meant a connection to a randomly chosen node within the local neighbourhood. A random connection meant a connection to a randomly chosen node from anywhere else on the network. Self-connections and multiple con-nections were not allowed in either case.
The second axis of variation was based on the pref-erential attachment idea, and we called the associated parameter P. When P = 0, connections were egalitar-ian, and no node was more likely to be selected for a connection than any other (see Figures 1 and 2). That is, all 24 local neighbours were equally eligible to receive a local connection, and all of the other 2499 nodes in the network were equally eligible to receive a random connection. As the value of P increased, connections were made in an increasingly preferential way. The value (n+δ)P was calculated for each eligible node, wherenis
the node degree andδis a small positive value (0.1 in the runs described below). The node that actually received a connection was chosen by roulette-wheel selection over these values. The parameterP thus acts as a preferen-tial exponent, governing the strength of the bias towards well-connected nodes. The point of the valueδ was to avoid stalemates in network generation by ensuring that even a node with no connections had a non-zero proba-bility of selection. Figures 3 and 4 illustrate networks withP = 1. The following values ofPwere investigated: 0, 0.2, 0.4, 0.6, 0.8, 1.0, and 1.2.
[image:4.595.70.289.491.622.2]Figure 4: A sample network withR= 1 andP = 1, i.e.,
long-range preferential connections. Prominent hubs can be seen, and the distribution of node degree is heavily right-skewed.
at 10,000 in all of our experiments. Connections were bidirectional, so this represented an average node degree of 8. This level of connectivity guaranteed that all or nearly all nodes in the network would be grouped into a “giant component” or connected section.
To actually construct sample networks, we began by sorting the nodes into a random order and giving each node at least one initial connection, selected according to the current values of R and P. This procedure en-sured that there would be no singleton nodes. Then the remainder of the 10,000 connections were allocated. Note that in this phase the prevailing values ofRandP
were used in the selection of both source and destination nodes for each connection: ifR = 0 andP = 1, for ex-ample, a random neighbourhood would be selected, one node within that neighbourhood preferentially selected as the source, and then a destination node preferentially selected from within the 5×5 square centred on the
source.
Once the layout was established, we ran two simple social tasks across the network in order to find out what sorts of topology best support social information trans-fer. The two tasks were quite different in character, but each task had clearly defined success measures to en-sure that our results would be unambiguous. For each task, we also looked at how well the network coped with a sudden localized change. This work is exploratory, so we were not strongly committed to particular hypotheses about what we would find. However, the network theory literature suggested some promising questions. Might there be a “sweet spot” for the classic small-world net-work, atR≈ 321? Does node degree distribution make a
difference? Could it be that the highly connected nodes in a skewed distribution function as information centres, increasing the overall efficiency of the network?
The first task was a basic spreading-innovation or
behavioural-contagion model of social learning. We were mindful of Kawamura’s (1959) research on Japanese macaques, in which one animal came up with a be-havioural innovation (i.e., washing potatoes in a stream before eating them) and the novel behaviour could be seen to spread gradually throughout the social network. In our model, a random node was chosen as the source of the behavioural innovation. Every time-step an indi-vidual would observe one of its social partners, chosen at random from among the nodes it was connected to, and would adopt the novel behaviour if the chosen part-ner had already done so. If the chosen partpart-ner had not yet adopted the new behaviour, nothing happened. The measure of effective information transmission was sim-ply the time taken for the novel behaviour to reach 99% prevalence in the population.1
The second task was more complex: each node repre-sented an agent in a market. Every agent can both buy and sell, but only to its social partners, i.e., the nodes it is connected to. The market trades in a single indis-tinguishable commodity, let’s say bicycles. Each agent can only possess one bicycle at a time, and a randomly chosen 50% of the agents begin the simulation owning a bicycle. Each agent has a personal valuation of a bicycle that is known only to itself; this is drawn from a uniform random distribution between $1 and $1000. Each agent also has access to a medium of exchange—we can think of this as a bank account with an infinite overdraft.
The agents operate according to very simple financial principles set out in a paper by Gode and Sunder (1993); they are “zero-intelligence” (ZI) traders. (We chose the ZI trading architecture not because we think it is a sen-sible way to trade but because it is probably the simplest way to set up a working market.) Each turn, an agent will make either an offer or a bid to a random partner, depending on whether the agent has or does not have a bicycle respectively. Would-be buyers will bid at a price randomly chosen from between the minimum price ($1) and their private valuation. This is the core logic of the ZI trader: it makes no sense to bid more than you think a bicycle is worth, and by bidding less, you may pick up a bargain. Similarly, would-be sellers will make a random offer somewhere between the maximum price ($1000) and their private valuation. Offers received by agents who already have a bicycle are ignored, as are bids received by agents who have no bicycle to sell. However, if the neighbour has a bike and receives a bid higher than their valuation, or has no bike and receives an offer under their valuation, a trade will take place. The market con-tinues to operate in this way until a complete time-step passes without any successful trades being made.
1In fact there were no strict time-steps in either task; random
Compared to the spreading innovation model, the eco-nomic task is not as obviously related to the spread of information. However, the bids and offers do transmit information about private valuations, and the net result of trading is to transfer bicycles to agents that valued them highly, and cash to agents that did not. We can therefore measure the efficiency of the market by look-ing at the mean increase in utility across the population of agents. We assume that an agent’s utility is equal to its private valuation of the bicycle, if it ends up own-ing one, plus the amount of money it has in the bank, which may be either positive or negative. Note that the initial average utility will be around $250, as half of the agents have bicycles and the average valuation is $500. After a period of trading we can calculate the change in this score and use that as an index of market efficiency. We measured the change in utility at two points: after ten time-steps had elapsed, and after the market had stabilized.
For both tasks we wanted to let the network reach an initial equilibrium and then see how quickly it would re-cover from a sudden local disturbance. In both cases we disrupted the function of 25% of the nodes, correspond-ing to the northwest quadrant of the underlycorrespond-ing spatial grid. For the spreading innovation task, we assumed that all individuals in the northwest quadrant had suffered an abrupt memory failure and lost the ability to perform the novel behaviour. We then measured how long it took for the novel behaviour to regain 99% prevalence in the population. For the economic task, we abruptly took the bicycles away from any individuals in the northwest quadrant who possessed one. We then recalculated the average utility, allowed the market to run for ten time-steps, and recorded the improvement in average utility that was achieved within that time.
3.
Results
For each combination of 10 values of R and 7 values of
P, we generated 20 sample networks and recorded the results on the spreading-innovation and economic tasks. Thus our primary results, shown in Figures 5 and 6, are measures of average success on each task across the space of theP andR values investigated.
Our network generation algorithm was successful in producing valid networks, and most of the time a con-nected graph resulted (overall mean number of nodes outside the giant component was only 0.48 out of 2,500). In order to be sure that our network topologies had the expected properties, we measured several basic network statistics. These were average path length (sampled over 5,000 random pairs of nodes rather than being calcu-lated exhaustively), clustering coefficient (defined ear-lier), node degree correlation, and skewness of the de-gree distribution. This last was calculated using the 1st percentile, the median, and the 99th percentile of the
node degree distribution, combined to give a standard measure of skewness as follows:
(n99−n50)−(n50−n1)
n99−n1
.
A value of zero on this skewness measure indicates a symmetrical distribution, while positive values, up to a maximum of 1.0, indicate increasingly long tails to the right.
Beyond simply measuring success on each task for par-ticular values ofRandP, we also constructed multivari-ate analyses of variance for the success score on each task against the four network statistics listed above. Al-thoughRandP would themselves be useful predictors in a multivariate model, we did not include them. The idea was to put ourselves in the position of investigators look-ing at a real-world network, where the relevant network statistics could be measured with some degree of error but “behind the scenes” variables such asRandP were not available. We hoped that these multivariate models would help us to identify which network properties were associated with successful outcomes.
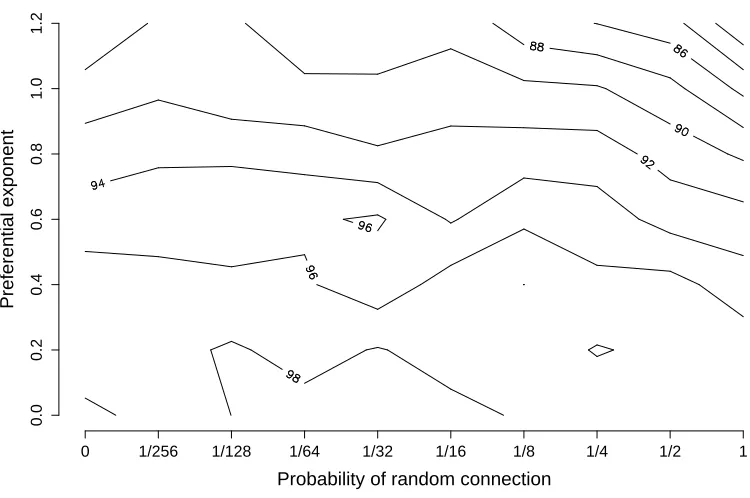
Results for the spreading-innovation task are shown in Figure 5. Note that this graph shows time-to-convergence data, so lower values are better. The re-sults are very clear: the novel behaviour reaches 99% prevalence most rapidly (in around 15 time-steps) when the probability of random connections (R) is equal to 1, and the preferential exponent (P) is low. This means that the most successful network for the rapid spread of an innovative behaviour would be a classical random graph. For lower values of R, i.e., as the networks be-come more locally connected, the time taken to reach 99% prevalence greatly increases. Although R has the strongest effect on the outcome, it is also clear that in-creasing values of P, i.e., more preferentially connected networks with more heavily skewed degree distributions, are associated with slightly longer convergence times.
A multivariate analysis of the data was highly signif-icant (F4,1395 = 758.9, p < 2.2×10−
16
) and explained 68% of the variance in the time to reach 99% prevalence. Average path length, clustering coefficient, and skewness of degree distribution were all significant predictors, and were all positively associated with longer times. The outstanding predictor was average path length, however, which, fitted alone, explained 65% of the variance in convergence times. The rapid spread of an innovation around a social network appears to depend chiefly on that network having short average path lengths.
When the network was disrupted by resetting the be-haviour of the 625 agents in the northwest quadrant, the story was very similar. The fastest recovery of 99% prevalence of the novel behaviour was found in networks with highRand lowP.
in-0 1/256 1/128 1/64 1/32 1/16 1/8 1/4 1/2 1
0.0
0.2
0.4
0.6
0.8
1.0
1.2
Probability of random connection
[image:7.595.105.483.107.350.2]Preferential exponent
Figure 5: For the spreading-innovation task, the graph shows the number of time-steps until the novel behaviour reached 99% prevalence in the population for various network architectures. Each data point is averaged over 20 runs.
0 1/256 1/128 1/64 1/32 1/16 1/8 1/4 1/2 1
0.0
0.2
0.4
0.6
0.8
1.0
1.2
Probability of random connection
Preferential exponent
[image:7.595.106.481.442.691.2]crease in utility per agent, which is a measure of market efficiency, and thus, unlike Figure 5, higher values are better. We measured the change in average utility both after 10 time-steps, and after the market had stabilized. The pattern of results was similar in both cases, and Fig-ure 6 shows the situation after 10 time-steps. The first point to note is that high values of the preferential ex-ponentP are associated with lower increases in average utility. The most impressive increases in utility are found whenP= 0 andR= 1
64, 1 32 and
1
16. In other words, the
most efficient markets are found when the network has an egalitarian distribution of node degrees, and a small proportion of random connections. This corresponds to Watts and Strogatz’s (1998) original small-world model. The multivariate analysis of the data was again highly significant (F4,1395 = 462.9, p < 2.2×10−
16
) and in this case explained 57% of the variance in added utility. The clustering coefficient and the skewness of the node degree distribution were both significant predictors, and both had a negative association with added utility. The clustering coefficient fitted alone explained 14% of the variance in utility, but the skewness of the node degree distribution explained 54% of the variance when fitted alone. Thus the efficiency of a market appears to depend primarily on an egalitarian distribution of connections, but also on transitivity being low.
When the market was disrupted by removing all bi-cycles from the northwest quadrant of the grid, how-ever, the results were more in line with the spreading-innovation task: the fastest recovery of utility was found when the network had many random connections. The value ofP was not especially important, although it was associated with slightly poorer recovery of utility. How-ever, high values ofRled to much greater improvements in utility, e.g., a mean improvement after 10 time-steps of 16.7 whenR= 1 compared to only 3.55 whenR= 1
32
(P = 0 in each case).
One point of concern in our results was that we only observed very moderate levels of positive degree corre-lation in any of the networks in our space of possible topologies. The highest values for node degree corre-lation (only around 0.025) were seen for low levels of random connections and egalitarian node degree distri-butions; as preferential attachment increased, the node degree correlation dropped to around −0.23. However,
Newman and Park (2003) argue that significantly posi-tive node degree correlation (popular people know other popular people, and loners know other loners) is one of the defining characteristics of human social networks. We therefore put together an alternative network gen-eration algorithm that was designed to produce positive node degree correlations: the probability of a connection going from a source to a target node was proportional to how closely the target node’s degree matched that of the source node. The parameterR applied to these
net-works in the usual fashion, but the parameterP was no longer relevant. This algorithm succeeded in producing positive node degree correlations, with an overall aver-age correlation of 0.23 across the different values ofR. We re-ran both of the social tasks on these networks but in all cases the results were not substantially different from those for the equivalent network with egalitarian connections (i.e.,P = 0).
4.
Conclusions
The higher the proportion of random connections, the faster an innovative behaviour spread throughout the so-cial network. On the other hand, a modest proportion of random connections led to the most efficient market performance. In both cases, an egalitarian distribution of node degrees was more effective: the heavily skewed distributions generated by preferential attachment just seem to slow things down.
With the benefit of hindsight it seems obvious that high levels of random connections will be advantageous on the spreading-innovation task, as random connections ensure a short path length between any two nodes which in turn allows the most rapid spread of the novel be-haviour. Similarly, in both the spreading-innovation and the economic tasks, the fastest recovery from the disrup-tion of one quadrant of the underlying grid was seen in networks with many random connections. We can draw a parallel here with recovery from a disaster in human society: if your town has been flooded, for instance, you will do well to get help and temporary accommodation from friends who live some distance away (i.e., random connections) rather than seeking help from neighbours whose houses are also flooded (local connections).
We did not have concrete hypotheses concerning our results, but there were suspicions that small-world net-works might do well. This was borne out with respect to the economic task, with the highest increases in average utility seen in networks with a few percent random con-nections and a fairly flat distribution of node degrees. In addition, if we return to the spreading-innovation task (Figure 5) and look at the performance of networks with
R= 1
16 andP = 0, for example, we find that they reach
99% prevalence in 19.87 time-steps. This is not as im-pressive as 15.78 time-steps for the networks withR= 1, but far better than the figure of 41.60 time-steps when
R = 0 (P = 0 in all cases). It would be wrong to say that small-world networks were the optimal design for so-cial information transfer—indeed, an important message from the results is that different topologies favour differ-ent social tasks. However, small-world networks look like a reasonable compromise given the tasks and topologies explored so far.
economic task one might imagine that the high-degree nodes could help things along by acting as “dealers”, be-ing more likely to buy and sell bicycles from their many trading partners several times before the market stabi-lized. However, the other side of the coin with a skewed node degree distribution is that many nodes have rela-tively few connections, and in the marketplace task this means that they will have a lower chance of being con-nected to an appropriate partner to make a trade, i.e., to someone who has a bike and a lower valuation than one’s own, or to someone who has no bike but a higher valuation than yours.
One of our theoretical goals was to show what we would expect social networks to look like if they had been optimized for social information transfer. Although we would be far more confident if we had covered a wider range of social tasks, based on what we have done so far we can predict that optimized networks should show a non-zero level of random connections and a near-symmetrical node degree distribution. The validity of the first prediction is hard to assess and possibly needs to wait for both more modelling work and more empiri-cal measurements of average path length and clustering coefficients in real social networks. Still, it is clear that in a population of animals, for example, having many long-range or random connections would entail costs (e.g., the energy costs of travelling around to meet all of these dis-tant connections). So even if a high proportion of ran-dom connections had selective value for an individual due to information-gathering payoffs, this would need to be balanced against the cost of maintaining such links.
The second prediction, that node degree distribution should be symmetrical, is clearly not seen in nature. We therefore speculate that the skewed node degree distribu-tions found in natural social networks are not the result of selection for efficient information transmission but are produced by some other factor, e.g., competition for sta-tus.
A practical goal of the work was to find out what sorts of network topologies would best support a marketplace populated by self-interested agents. On this point we can be clear: our results suggest that the overlay networks for trading in the systems currently being designed by Davy et al. (2003) and Byde et al. (2003) should be classic small-world networks, with about 1 in 32 connections being random and a flat distribution of node degrees.
We admit that in some of these conclusions we are per-haps pushing the results of an early, exploratory model a little too hard. Clearly a wider range of social tasks needs to be investigated. The two tasks that we did consider could be examined in more detail as well: it is not clear how the spreading-innovation model would respond to the addition of factors such as noisy percep-tion, multiple competing innovations, and a tendency to copy the majority behaviour among one’s neighbours.
The economic task dealt with about the simplest market imaginable: something as simple as allowing the agents to possess more than one bicycle at a time might alter the results significantly.
In future models we also want to look at what hap-pens when the network topology (or, more specifically, the mechanisms and behaviours that generate that topol-ogy) is under evolutionary pressure. Currently the net-work architecture is static and pre-specified, but this is not the case with real social networks. Indeed, your so-cial network is not imposed on your communicative and learning behaviours, it is in fact shaped by those very behaviours: if you talk to someone and receive useful information from them, you are likely to talk to them again in future and thus your social network has altered. Capturing such reciprocal effects will be critical to fu-ture models. This would leave the way open for tackling much bigger questions about what sorts of social net-work formation and maintenance strategies—in people, animals, robots, or software agents—are likely to win out in the struggle for selection.
Acknowledgements
Our thanks to Dave Cliff of HP Labs for useful discus-sions.
References
Barab´asi, A.-L., & Albert, R. (1999). Emergence of scal-ing in random networks. Science, 286, 509–512.
Byde, A., Salle, M., & Bartolini, C. (2003). Market-based resource allocation for utility data centers. Technical report HPL-2003-188, Hewlett Packard Laboratories, Bristol, UK.
Davy, S., Djemame, K., & Noble, J. (2003). The ap-plication of bioinspired engineering principles to Grid resource allocation. In Proceedings of the Nineteenth Annual UK Performance Engineering Workshop.
Erd¨os, P., & R´enyi, A. (1959). On random graphs. Pub-licationes Mathematicae,6, 290–297.
Galef, Jr., B. G. (1996). Social enhancement of food pref-erences in Norway rats: A brief review. In Heyes & Galef (1996), pp. 49–64.
Gode, D. K., & Sunder, S. (1993). Allocative efficiency of markets with zero-intelligence traders: Market as a partial substitute for individual rationality.
Journal of Political Economy,101, 119–137.
Kawamura, S. (1959). The process of sub-culture prop-agation among Japanese macaques. Primates, 2, 43–60.
Newman, M. E. J. (2003). The structure and function of complex networks. SIAM Review,45, 167–256.
Newman, M. E. J., & Park, J. (2003). Why social net-works are different from other types of netnet-works.
Physical Review E,68(036122).
Noble, J., & Franks, D. W. (2002). Social learning mech-anisms compared in a simple environment. In Stan-dish, R. K., Bedau, M. A., & Abbass, H. A. (Eds.),
Artificial Life VIII: Proceedings of the Eighth In-ternational Conference on Artificial Life, pp. 379– 385. MIT Press, Cambridge, MA.
Smith, K., & Hurford, J. R. (2003). Language evolu-tion in populaevolu-tions: Extending the iterated learn-ing model. In Banzhaf, W., Christaller, T., Dit-trich, P., Kim, J. T., & Ziegler, J. (Eds.),Advances in Artificial Life: Seventh European Conference on Artificial Life (ECAL’03), Lecture Notes in Arti-ficial Intelligence, pp. 507–516. Springer, Berlin.
Steels, L. (1996). Emergent adaptive lexicons. In Maes, P., Matari´c, M., Meyer, J.-A., Pollack, J., & Wil-son, S. W. (Eds.), From Animals to Animats 4: Proceedings of the Fourth International Conference on Simulation of Adaptive Behavior, pp. 562–567. MIT Press / Bradford Books, Cambridge, MA.
Tomasello, M. (1996). Do apes ape?. In Heyes & Galef (1996), pp. 319–346.
von Frisch, K. (1967). The Dance Language and Orien-tation of Bees. Belknap Press / Harvard University Press, Cambridge, MA.