Published in: Journal of Materials Science Letters, 40 (2005) 4971-4974
A comparison of grain size determination by light
microscopy and EBSD analysis
N. Gao
*, S.C. Wang, H.S. Ubhi
1and M.J. Starink
Materials Research Group, School of Engineering Sciences, University ofSouthampton, Southampton, SO17 1BJ
1QinetiQ, Famborough GU14 OLX, UK
The characterization and measurement of grain structures is of great importance to materials scientists because not only does grain size strongly affect the mechanical properties, but it also has an influence on physical properties, surface properties and phase transformations [1]. The ability to locate the grain boundaries in materials is critical for a wide number of applications, e.g. process control and property optimization. The mechanical and physical properties of metallic materials are frequently related to grain size, e.g. via the Hall-Petch relationship where strength is inversely dependent on the square root of grain size [2]. The sizes and shapes of grains are generally determined through optical or scanning electron microscopy of etched samples. Recent developments in the use of electron backscattered diffraction (EBSD) have made it an excellent tool for quantitative metallography. In addition to grain size determination, there are a number of important microstructural parameters available from EBSD not obtainable from conventional methods of grain characterization, in particular parameters relating to the grain orientations and boundary characters [3,4,5,6,7]. In most cases, it is assumed that the microstructure features, especially the grain size obtained from light microscopy and EBSD are the same. However, there is very little information available in literature related to the
comparison of the light microscopy observations and the EBSD analysis for different materials. This letter considers the application of EBSD to the measurement of grain size and provides a comparison with traditional metallographic methods for a low carbon steel and a diluted 2xxx Al-Cu-Mg alloy.
The low carbon steel was processed by industrial hot rolling and normalizing heat treatment. The Al-Cu-Mg alloy (Al-2.2Cu-0.94Mg-0.42Mn-1.6Li wt%) was hot rolled, solution treated at 513°C and water quenched. Details of the production route of the Al-Cu-Mg alloy are given elsewhere [8]. The samples were prepared using routine metallographic methods and finished using OPS suspension. The areas of interest for the samples were investigated either near a crack or were marked by micro-hardness indents to make sure that both optical measurements and EBSD analysis were made on the same area. The low carbon steel sample was etched by Nital 2% and the Al-Cu-Mg alloy by Keller’s reagent (2ml HF (48%), 3 ml HCl, 5 ml HNO3, 190 ml H2O) for optical observations. For optical image analysis, the grain
size of the samples was measured by SIS Imager analysis package. For EBSD analysis, the low carbon steel sample used was in its final mechanically polished state and the Al-Cu-Mg sample was electro polished, using a 1/3 nitric acid, 2/3 methanol solution at –30°C, with a voltage of 25V. A step size of 1, 2 or 4 μm was used in
acquiring the EBSD data. The specimens were examined and analysed using HKL
Channel 5 software [9] in a JEOL JSM-6500 FEG-SEM at a specimen tilt of 60º, with
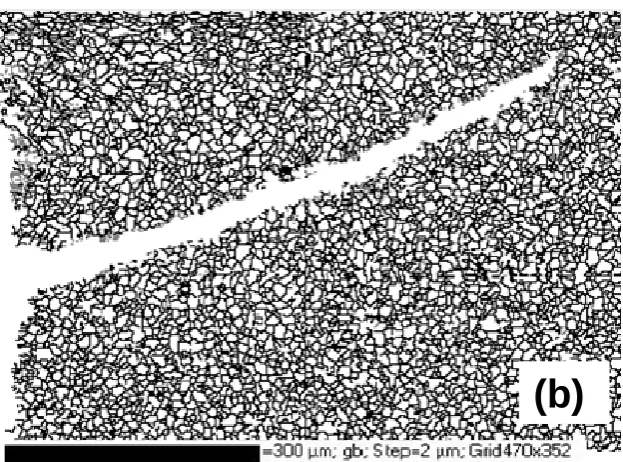
Fig. 1 shows both the optical image and the EBSD image from the low carbon steel.
From the comparison of low magnification photos with a step size of 2 μm for the
EBSD image, it seems that both methods provide almost similar information. However, careful comparison of the details in higher magnification photos with a step size of 1 μm in Fig. 2 indicates that the EBSD image reveals more grains than the
optical image. Table 1 shows the statistic results both from SIS Imager analysis and EBSD software, which clearly demonstrates that EBSD measures a smaller average grain size (9.24 μm ) than the one determined from the optical image (14.22 μm).
(Insert: Figs 1 and 2; Table 1)
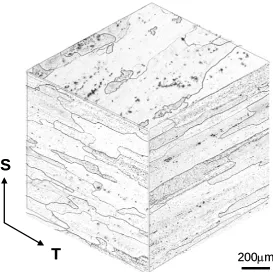
Fig. 3 reveals the three-dimensional microstructure of the Al-Cu-Mg alloy after
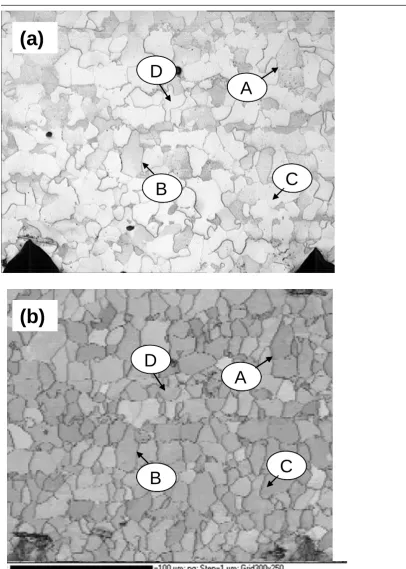
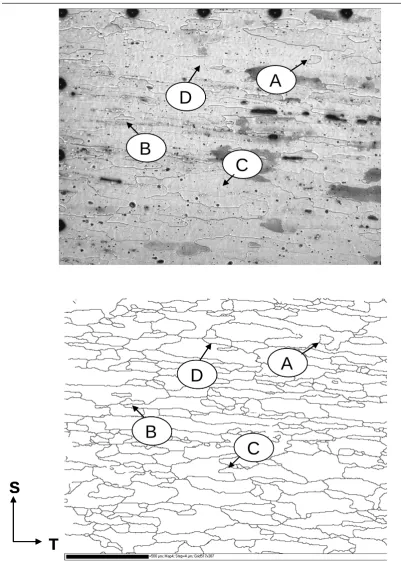
mechanical polishing and Keller etching, which demonstrates that this alloy has pancake shaped grains. At this stage, the specimen could not provide clear Kikuchi patterns for EBSD analysis due to the surface residual stress, which is introduced in the mechanical polishing processes. Therefore, the Al-Cu-Mg alloy was slightly electro-polished to remove the surface deformation. Fig. 4a shows the resulting optical micrograph and Fig. 4b shows the grain boundary map of the alloy from EBSD analysis. A comparison of both images demonstrates an obvious difference in grain sizes. As a result, the grain dimensions by EBSD along T and S directions are 109.7 and 47.6 μm respectively, whereas the results measured in optical microscopy are 388.3 and 70.1 μm, which are two to three times the values from EBSD analysis.
(Insert: Figs 3 and 4)
suspension. Thirdly, following a repeated mechanical polishing by #4000 emery papers and OPS suspension plus electron-polishing, the sample was further etched by Keller’s reagent. Throughout the above different stages of polishing and etching, either by mechanical or by electro-polishing, optical microstructural observations still exhibit similar results. Even heavy etching does not have a significant effect in revealing a finer or different microstructure. By carefully comparing the same points and areas on the specimen from both the optical and EBSD images, it was found that in some cases, the grain boundaries appearing in EBSD images can be matched in optical images, though many of them are very weak and incomplete on the optical image. From the indentation makers and labels (A and B) in Figs. 2 and 4, corresponding positions within the optical and the EBSD images can be identified and comparisons show that grain boundaries are missing from optical image (labels C and D in Figs. 2 and 4).
It is known that light microscopy has the advantage of easily providing an overall picture of the microstructure. But the visibility of grain boundaries in optical images can be affected by the grain boundary state related to the distribution of grain boundary precipitation, solute content around grain boundaries, the presence of precipitate free zones (PFZ) and misorientation angle. However, the change of these boundary states should have little or no effect on the EBSD image, with only very low misorientation angle boundaries (<2º) potentially escaping detection by EBSD.
most of these etchants are only suitable for use on specific aluminium alloys or narrowly defined groups of aluminium alloys [12]. In addition, on alloys with low alloy content, chemical etching of grains produces relief effects and steps at the grain boundaries, which do not provide well-defined grain structure that is resolvable in the light microscope. Even for grain structure in more highly alloyed materials, grain-boundary precipitates may delineate the grain boundaries upon chemical etching if the metallurgical treatments have been favourable for this effect. A very dense precipitation, as in annealed or hot-worked heat-treatable alloys, makes it difficult or impossible to produce any grain contrast or to delineate grain boundaries by etching [11].
Currently, Keller’s reagent is widely used in various laboratories for a number of aluminium alloys. In the ASM Speciality Handbook [11], the recommended etchant for use in microscopic examination of commercial 2xxx and 7xxx series aluminum alloys is Keller’s reagent. Although the present experimental alloy of Al-2.2Cu-0.94Mg-0.42Mn-1.6Li wt% is a dilute 2xxx alloy, it seems that Keller’s reagent could not completely reveal of the grain structure when compared to the EBSD results. In addition to the fact that the etchants are sometimes not effective in revealing all grain boundaries, as discussed above, when the grains are very small they are difficult to image optically in many cases, even when they have been etched.
The Hall-Petch relationship conveniently allows the yield stress to be related to the individual components of strengthening and provides a useful tool to link mechanical property to microstructure:
2 1 0
−
+ = kd
y σ
where σy is the yield stress, σ0 is the intrinsic flow stress, is the grain size and
is a constant. Although this relationship is very straightforward, care should be taken to reveal the real microstructure by suitable examination technique. If parts of the grain boundaries are not revealed, the average grain size will be underestimated and the yield stress value predicted by the above equation will be reduced.
d k
EBSD data contain much more detailed information about the grain boundary which would not be obtainable from the optical or the secondary electron images. Measurement of grain size using EBSD has a number of advantages over optical examination; these include better imaging of smaller grains as the imaging of the microstructure is less dependent on suitable etching and imaging techniques. Therefore, it is not surprising that EBSD normally gives a smaller average grain size than traditional optical observation, especially if a less effective etching technique is applied. Another advantage of EBSD over optical microscopy is that ESBD can easily provide grain orientation related information (such as texture and grain boundary misorientation angles) when examining grain size.
to obtain good EBSD patterns. However, in many cases, a good, light mechanical polish is sufficient for hard materials [15], e.g. steels. The present experimental results illustrate that for an aluminium alloy a light electro-polishing after mechanical polishing is a quick and effective method to remove any residual distortion before the specimen is suitable for EBSD analysis. But care should be taken to avoid forming surface pitting.
In conclusion, this study shows that the accuracy of optical microscopy analysis of grain size depends on sample preparation techniques, etching procedures and materials, where the visibility of a boundary is a function of the techniques used, and the microstructure components on or close to the boundary. Optical examination of grain size does not always give the same information achieved by EBSD analysis. Fully automatic measurements of grain size by EBSD provides more accurate measurements than conventional optical imaging methods and yields smaller average grain size because EBSD has an advantage over the optical examination in better imaging smaller grains and its result is not dependent on etching and imaging techniques.
Acknowledgements
References
1 F. J. Humphreys, Journal of Materials Science 36 (2001) 3833. 2 A. P. Day and T. E. Quested, Journal of Microscopy 195 (1999) 186.
3 A. F. Norman, I. Brough and P. B. Prangnell, Materials Science Forum 331-337 (2000) 1713.
4 J. C. Huang, I. C. Hsiao, T. D. Wang and B. Y. Lou, Scripta Mater. 43 (2000) 213. 5 Y. Huang and F. J. Humphreys, Materials Characterization 47 (2001) 235.
6 P. Trimby, A. Day, K. Mehnert and N. H. Schmid, Journal of Microscopy 205 (2002) 259.
7 S.C. Wang, M. Aindow and M. J. Starink, Acta Mater. 51 (2003) 2485.
8 M. J. Starink, I. Sinclair, N. Gao, N. Kamp, P. J. Gregson, P. D. Pitcher, A. Levers and S. Gardiner, Materials Science Form 396-402 (2002) 601.
9 Channel 5 Manual, HKL Technology, Hobro, DK-9500, Denmark, 2001.
10 P. R. Sperry and M. H. Bankard, Metallographic Techniques for Aluminium Alloys, ASM Metals Handbook, 8th Edition, vol. 8, 1973.
11 J. R. Davis, Aluminum and Aluminum Alloys, ASM Speciality Handbook, The Materials Information Society, 1998.
12 T. Zwieg, Struers Journal of Materialography 38 (2001) 3.
13 E. Bouyne, H. M. Flower, T. C. Lindley and A. Pineau, Scripta Mater. 39 (1998) 295.
Table 1 A comparison of grain dimensions for the low carbon steel measured by both SIS Imager and EBSD
SIS Imager EBSD
Count grain, N 1021 1594
Mean (μm) 14.22 9.24
Minimum (μm) 5.48 3.19
Maximum (μm) 46.16 26.51
(a)
(b)
(a)
[image:10.595.91.403.348.579.2](b)
A
B
C
A
B
(a)
C
(b)
D
D
A
B
C
A
A
A
B
B
B
C
C
C
A
A
A
B
B
B
C
C
(a)
D
D
C
(b)
[image:11.595.89.496.75.645.2]D
D
T
S
200μm
T
S
T
S
[image:12.595.126.400.105.377.2]200μm 200μm