RESEARCH SERIES NUMBER 4 OCTOBER 2008
B
UDGET
P
ERSPECTIVES
2009
Tim Callan (ed.)
Ray Barrell, Alan Barrett,
Noel Casserly, Frank Convery,
Jean Goggin, Ide Kearney,
Simon Kirby, Pete Lunn,
Martin O’Brien, Lisa Ryan
Copies of this paper may be obtained from The Economic and Social Research Institute (Limited Company No. 18269).
Registered Office: Whitaker Square, Sir John Rogerson’s Quay, Dublin 2. www.esri.ie
Price €15.00
Tim Callan is Research Professor, Alan Barrett is Senior Research Officer, Ide Kearney is Research Associate, Pete Lunn is Post Doctoral Fellow, Martin O’Brien and Jean Goggin are Research Assistants at the Economic and Social Research Institute (ESRI). Ray Barrell is Senior Research Fellow, Simon Kirby is Research Fellow at the National Institute of Economic and Social Research (NIESR), London. Noel Casserly is Director, Comhar, Lisa Ryan is Director of Research, Comhar - the Sustainable Development Council. Frank Convery is Professor of Environmental Studies at University College Dublin.
RESEARCH SERIES NUMBER 4 OCTOBER 2008
B
UDGET
P
ERSPECTIVES
2009
Tim Callan (ed.)
Ray Barrell, Alan Barrett,
Noel Casserly, Frank Convery,
Jean Goggin, Ide Kearney,
Simon Kirby, Pete Lunn,
Martin O’Brien, Lisa Ryan
© THE ECONOMIC AND SOCIAL RESEARCH INSTITUTE DUBLIN, 2008
ACKNOWLEDGEMENTS
Thanks are due to the referees and to research staff at the ESRI for comments which have helped to improve the papers included in this volume. Thanks are also due to Donal de Buitléir, Chair of the FFS Projects Committee, and to Frances Ruane, for their valuable inputs into the planning of the conference.
Conference organisation was handled ably and efficiently by Patricia Byrne and Mary Dowling. All authors, and particularly the editor, are indebted to Mary Cleary, Regina Moore and Deirdre Whitaker for their excellent work in preparing the volume for publication.
CONTENTS
Page
Acknowledgements iv
INTRODUCTION
Frances Ruane 1
Chapter
1. THE BUDGETARY IMPLICATIONS OF GLOBAL SHOCKS TO CYCLE AND TRENDS IN OUTPUT: Impacts of Housing, Financial and Oil Shocks
Ray Barrell and Simon Kirby 4
2. MOBILISING MARKET-BASED INSTRUMENTS FOR CLIMATE CHANGE
IN IRELAND
Lisa Ryan, Frank Convery and Noel Casserly 16
3. GETTING OUT WHAT YOU PUT IN: An Evaluation of Public Investment in Irish Sport
I
NTRODUCTION
T
he context for this year’s Budget differs sharply from most of those in the past decade and a half. The global economy has been buffeted by crises in financial markets. Oil prices, even after recent falls, are at very high levels. Furthermore, the sharp decline in housing activity in Ireland carries negative implications both for employment and for tax revenues. A consequence of the changed situation is that the date of the 2009 Budget has been brought forward by eight weeks. This year’s Budget Perspectives Conference, co-hosted by The Economic and Social Research Institute and the Foundation for Fiscal Studies, provides several inputs to inform macroeconomic decision making in these challenging times. In addition, two longer-term issues are addressed. The first of these deals with the policy framework for climate change, an issue that has risen rapidly on the Irish policy horizon in recent years. The second issue is the effectiveness of public spending in achieving its objectives in the area of sport, which is now recognised as an important contributor to health and quality of life in modern society.D
evelopments in the global economy are of particular importance to Ireland, given the importance of trade in both goods and services to the Irish economy. In the first paper, Ray Barrell and Simon Kirby, of the National Institute of Economic and Social Research (NIESR) in London, provides an overview of the shocks which are besetting the global economy at present. After a long period of stability, the world economy is currently going through a period of financial turmoil, as banks face the consequences of poor lending decisions in a context of inadequate global regulation. At the same time, oil prices have risen to unprecedented levels. In a number of countries, and especially in Ireland, Spain, the United Kingdom and the United States, these factors are compounded by developments in the housing market. House prices that were buoyed by a credit boom in many countries over a number of years have now started to fall. The impacts on consumption and on housing investment are leading these economies into recession. Risk premia have risen in many markets, and investment is faltering as a consequence. Budget deficits have increased as a result of the unexpected slowdown in economic growth. While some of this is cyclical, trend growth has also been significantly reduced by factors such as the oil price rise and the increase in risk premia. While public policy can seek to smooth over the cyclical element, public spending plans will have to be reined back to remain in line with trend growth, if tax rates are not to rise significantly.International
Situation
2 BUDGET PERSPECTIVES 2009
T
he implications of these global factors for the Irish economy, and of domestic factors such as the slowdown in housing activity, are dealt with in a presentation by Alan Barrett, Ide Kearney, Jean Goggin and Martin O’Brien based on the ESRI’s Autumn Quarterly Economic Commentary. As this is to be published on the day of the conference, details are not available at the time of writing. The Commentary and the presentation will give particular attention to the state of the public finances, and the appropriate stance for fiscal policy in 2009.Outlook for
Ireland
One issue that is of central importance in the Irish economy today is the appropriate size of the budget deficit for 2009. Four speakers will contribute to a roundtable on this issue: Ray Barrell (NIESR), Joe Durkan (UCD), Patrick Honohan (TCD) and Philip Lane (TCD). These papers and/or presentations will be available on the ESRI website.
I
n their paper, Lisa Ryan (Comhar), Frank Convery (UCD) and Noel Casserly (Comhar) point out that Irish policy on climate change is substantially shaped at EU level, with national targets and some key mechanisms coming to us from the European Union. For example, the EU Emissions Trading Scheme (ETS) has created scarcity in the market place for the power and heavy industry sectors, and they face a price signal per tonne of CO2 ‘allowance’ that tells them that reduction at a cost per tonnebelow the market price will be profitable, and that increased emissions will incur a heavy cost penalty. Ryan, Convery and Casserly argue that auctioning of allowances – not present in the current system, but included in proposals to revise the system post-2012 – would represent an improvement in the efficiency of the policy.
Climate
Change
There is, however, some freedom of action open to Ireland in responding to new and demanding targets (to be achieved by 2020) proposed by the EU for sectors not covered by the ETS (agriculture, transport, waste, heat and process related emissions from residential, commerce and industry not in the trading scheme). Ryan, Convery and Casserly argue that a central element of policy in this area should be the introduction of a carbon levy to reach the level of the allowance price in the EU ETS They also suggest that if costs of reducing carbon emissions are substantially higher in the non-ETS sector, efficiency in achieving the overall target would require some flexibility between the ETS and the non-ETS sectors; this would require a decision at European Commission level.
A
chieving value for money in public expenditure is another key issue, whatever the state of the economic cycle. Its importance is even more marked in the present situation. In order to attain this, we must have a clear idea of the objectives of particular expenditure programmes, and of the extent to which the expenditures contribute to these objectives. This is the approach taken by Pete Lunn (ESRI) in assessing the economic returns to public investment in sport, which have increased very substantially over the past decade. The stated aims of Irish sports policy emphasise improvements in health and quality of life. There is, indeed, considerable empirical support for the view that there are significant health and social benefits to be had from participation in sport. However, theSports
INTRODUCTION 3
T
HE
B
UDGETARY
I
MPLICATIONS OF
G
LOBAL
S
HOCKS TO
C
YCLES AND
T
RENDS IN
O
UTPUT
:
Impacts of Housing,
Financial and Oil Shocks
Ray Barrell and Simon Kirby
*A
fter nearly two decades of stability the world economy is going through a period of financial turmoil as banks face the consequences of poor lending decisions. House prices were buoyed by a credit boom in many countries, but they have started to fall. The impacts on consumption and on housing investment are leading many economies into recession. Risk premia have risen in many markets, and investment is faltering as a consequence. At the same time oil prices have risen to unprecedented levels. Budget deficits have increased as a result of the unexpected slowdown in economic growth. Some of this is cyclical, and can be ignored. However, the rise in risk premia and the oil price have together reduced trend growth by half to one percentage point for four to six years in many countries. Public spending plans will have to be reined back to remain in line with trend incomes, or tax rates will have to rise. Not all of the recent increases in budget deficits can be ignored, and they will have to be addressed once the dust has settled.Abstract
T
he OECD economies are facing three severe negative shocks to growth.Housing markets have been badly affected by the ending of their booms and house prices and housing investment are falling in a number of countries. Housing market problems have severe cyclical effects, but it is not clear they have a sustained impact on output. Of the two remaining shocks, one is emanating directly from financial markets whilst the other is in the form of
1.
Introduction
* NIESR, 2 Dean Trench Street, London SW1P 3HE.
THE BUDGETARY IMPLICATIONS OF GLOBAL SHOCKS TO CYCLES AND TRENDS IN OUTPUT 5
an unanticipated surge in oil and other commodity prices. These shocks are likely to have an impact over a longer period of time, and they will have an impact on the sustainable level of output as well as on the cyclical component in economic activity around sustainable, or equilibrium, output. When the rate of growth of an economy slows, tax receipts will be reduced and expenditure on social support programmes will increase. These automatic stabilisers are built in to the fiscal frameworks in use in Europe, and should help to offset the negative impacts of the shocks on output growth.
Output falling below capacity is reasonably associated with increased budget deficits, and the faster the rate of increase in the output gap the greater the budgetary allowance that can be taken under the Stability and Growth Pact. Medium-term expenditure planning is best isolated from changes in the cyclical position of the economy. If shocks also reduce trend output growth then medium-term expenditure plans should change. Hence, it is important to be able to distinguish between the cyclical and structural elements in the effects of a set of shocks when looking at the budgetary response.
We discuss the evolution of recent financial market turmoil and its effects on house prices. We evaluate the impacts of falling house prices on the economy and discuss the impact of recent declines in housing investment. We also look at the impact of increased credit spreads on the economy with an emphasis on their long term effects. We also discuss the impacts of the recent increase in oil prices. We conclude by arguing that the housing market crisis is cyclical and its impacts on the fiscal position can largely be ignored. However, increased risk premia and higher real oil prices impact on the longer-term prospects, and in most countries they require an adjustment to spending plans or an increase in tax rates.
H
ouse prices have been rising in almost all European countries (with thenotable exception of Germany) and they have also risen in North America, as Barrell and Kirby (2008) discuss. Housing bubbles have been common in the UK, and were also major factors behind the Nordic banking crises of the early 1990s. House price bubbles are commonly associated with financial liberalisation and innovation and with subsequent financial crises. The recent bubble probably stemmed from increased lending given income levels and from low real interest rates on that lending. Large volumes of saving, especially from China and the rest of East Asia, were holding down real interest rates. Partly as a consequence of these low real rates we have seen a wave of financial innovation. Low real rates squeeze the rents banks get on their zero interest deposits and hence put pressure on them to innovate in order to maintain their profit margins. Developments in our understanding of risk, in combination with the pressure to innovate, have led to the production of new styles of assets that share and spread risk. Bundling mortgages into securities spreads risk, and this raises the welfare of society and increase the capacity to borrow.
2.
The Genesis
of the
Financial
Crisis and
Housing
Bubble
6 BUDGET PERSPECTIVES 2009
[image:12.595.162.519.250.438.2]banks, and losses have been larger than initially anticipated. This was perhaps because US banks had a better understanding of lax US bankruptcy and housing loan laws and they were hence, willing to pay less for these new assets than the less well informed Europeans. As soon as loans began to become more expensive, with lower loan to value ratios, in order to take account of higher perceived risk, house prices began to weaken. Housing investment had begun to fall in the US in the first quarter of 2006, but as credit constraints tightened in mid-2007 its decline was accelerated. Uncertainty over the location of the bad debts meant that banks were unwilling to trust each other, and interbank transactions dropped and the spread on wholesale borrowing has risen. This has further tightened credit conditions and has contributed to the cyclical slowdown of many economies.
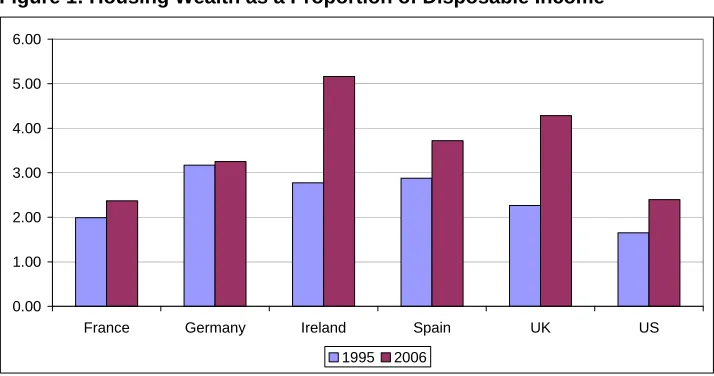
Figure 1: Housing Wealth as a Proportion of Disposable Income
0.00 1.00 2.00 3.00 4.00 5.00 6.00
France Germany Ireland Spain UK US 1995 2006
Rising real house price can mean that the value of the owner occupied housing stock might rise relative to incomes (Figure 1). It can also rise if there is a great deal of housing investment, as in Ireland, where investment in housing was around 12 per cent of GDP (Table 1). If housing wealth falls then consumption may be affected, and hence the economy may slow down. There is reasonably clear evidence that housing wealth affects consumption in many countries, as Barrell and Davis (2007) show. Although a change in housing wealth driven by a change in house prices may not be national wealth, if individuals are myopic and do not value the inheritance they leave their children as much as their children would value it then housing wealth
might be perceived as individual wealth.1 In the long run individuals appear
to react no more to their housing than their financial wealth. However, there is clear evidence that there is significantly more signal in a rise in housing wealth driven by asset prices than in a rise in financial wealth driven by the same factors.
It is possible to use the National Institute Global Econometric Model, NiGEM to evaluate the impacts of a fall in house prices, and Figure 2 reports on the effects of a 10 per cent concerted fall. In each of these countries there is strong evidence that consumption depends on housing wealth, As Barrell and Kirby (2008) show, the impacts on consumption of a fall in housing wealth are between two and three times larger than the
THE BUDGETARY IMPLICATIONS OF GLOBAL SHOCKS TO CYCLES AND TRENDS IN OUTPUT 7
[image:13.595.161.514.230.414.2]impact on GDP. This is largely because a high proportion of any fall in consumption is absorbed into imports, with the offset being larger in more open smaller economies. Underlying these simulations are the assumptions that the monetary authorities adjust interest rates in line with changes in demand, and that forward looking foreign exchange markets cause the exchange rate to jump down initially, offsetting some of the effects. Equity markets are also forward looking and react to the fall in interest rates that results from the fall in house prices. Consequently, equity market wealth initially jumps up to partly offset the fall in housing wealth. However, the offset is not large, and if the authorities did not react there would be no offset.
Figure 2: Effects of a 10 Per Cent fall in House Prices on Real GDP
-1.20 -1.00 -0.80 -0.60 -0.40 -0.20 0.00
France Germany Ireland Spain UK USA
Percen
t di
ff
eren
ce
from basel
ine
(
level
)
year 1 year 2 year 3
The crisis in housing markets has also led to a fall in housing investment, as we can see from Table 1. Housing investment has fallen most sharply in the US and in Ireland. UK housing investment has dropped by a more modest amount. Simulations on NiGEM suggest that the fall in investment has probably reduced US GDP growth by just over ½ percentage point. The effects on the UK are less, mainly because the share of housing investment is smaller and the decline in investment has been lower. Housing market downturns cause sharp and temporary declines in output, and they are clearly cyclical shocks. They can at minimum be ignored when policy makers set longer term budgetary plans, since the widening of deficits is short term and cyclical. The effects of a widening output gap on budget deficits depends on the underlying cause. Barrell, Hurst and Mitchell (2007) show that consumption led slowdowns have a significantly greater impact on deficits than those led by slower export growth. On average an expansion of the output gap by 5 percentage points might worsen the budget by 2½ per cent of GDP or so, but if the downturn is from tax rich consumption it could be as high as 3½ per cent of GDP. Since these are cyclical such budgetary changes do not need intervention to correct them.
Table 1: Ratio of Housing Investment to GDP
France Germany Ireland UK US
[image:13.595.162.521.676.764.2]8 BUDGET PERSPECTIVES 2009
Given that house prices were well above fundamentals in many countries, and perhaps as much as 30 per cent overvalued in the UK, the fall in house prices is to be welcomed, and not offset as in the recent announcements by the UK government. In addition, the wealth effect from high and rising house prices has been a major factor behind low levels of savings in countries such as the UK and the US, and a rise in the savings ratio that will result from lower housing wealth is also to be welcomed in these two low saving countries. If politicians requiring re-election feel a need to react, or if they think they should stabilise the economy by taking action, then programmes to offset the employment effects of lower housing investment would make more sense than policies designed to stop house prices adjusting back to their equilibrium level.
F
inancial crises are episodic and frequent, and are difficult to avoid withoutmajor impacts on the prospects for financial innovation and economic growth. Financial innovation can reduce borrowing costs which lowers the user cost of capital, and hence for a period at least it can be important for raising growth. However, it is difficult to distinguish between sustainable innovation and excessive risk taking. Regulators have to ensure they encourage the former and discourage the latter. Financial sector regulation is extremely difficult, and financial innovation often finds ways round regulation. However, good regulation frequently revised to keep up with markets is essential if financial markets are to be constrained from generating a depression of the scale seen between 1929 and 1933.
3.
Financial
Crises and
the Impacts
of Increased
Risk Related
Spreads
Table 2: Selected Banking Crises and Their Effects
Date Duration
Direct Cost to Taxpayers*
Output Loss (% of GDP)
Japan 1991-2001 10 years 14.0
Norway 1989-1992 4 years 3.4 27.1 Sweden 1991-1994 4 years 2.1 3.8 Finland 1991-1994 4 years 10.0 44.9
* Per cent of annual GDP at end of episode.
Source: Barrell and Hurst (2008).
THE BUDGETARY IMPLICATIONS OF GLOBAL SHOCKS TO CYCLES AND TRENDS IN OUTPUT 9
Figure 3 Spread between BAA corporate and government bonds
0 0.5 1 1.5 2 2.5 3 3.5 4 4.5 05 M ar c h 2000 0 5 S ept em ber 2 000 05 M ar c h 2001 0 5 S ept em ber 2 001 05 M ar c h 2002 0 5 S ept em ber 2 002 05 M ar c h 2003 0 5 S ept em ber 2 003 05 M ar c h 2004 0 5 S ept em ber 2 004 05 M ar c h 2005 0 5 S ept em ber 2 005 05 M ar c h 2006 0 5 S ept em ber 2 006 05 M ar c h 2007 0 5 S ept em ber 2 007 05 M ar c h 2008 0 5 S ept em ber 2 008
US Euro Area UK
The recent crisis that has hit Europe and North America is probably more similar to that experienced by Japan in the 1990s than the quick and deep crises in the Nordic countries. There has been a housing market element, as we have discussed above, but excessive lending and an under-estimate of default risk, especially within the US, led to low risk premia for all borrowers. As Figure 3 shows, the spread between risk free government borrowing and corporate borrowing costs has risen in the US and Europe, as have equity premia and consumer borrowing costs. This looks like a medium to long term re-evaluation of risk, and it will raise the user cost of capital, and reduce the equilibrium level of the capital stock and hence sustainable output.
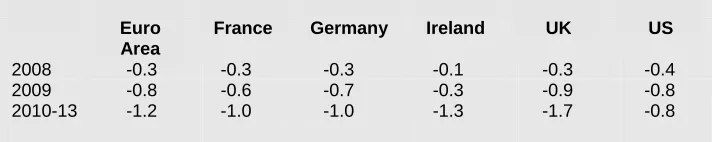
Table 3: Impacts of a 2.0 Sustained Rise in Risk Premia on Output
Euro Area
France Germany Ireland UK US
2008 -0.3 -0.3 -0.3 -0.1 -0.3 -0.4 2009 -0.8 -0.6 -0.7 -0.3 -0.9 -0.8 2010-13 -1.2 -1.0 -1.0 -1.3 -1.7 -0.8
NiGEM simulation – per cent difference from baseline.
Interest rate rules in place, forward looking financial and labour markets.
[image:15.595.162.521.537.608.2]10 BUDGET PERSPECTIVES 2009
America.2 As a result of this both investment and consumption would fall.
The user cost of capital would have risen by less than 2 percentage points as long-term risk free real interest rates would fall in response to lower investment and higher saving. As we can see from Table 3 sustainable output would fall by more than one per cent in the Euro Area and by less in the US, reflecting higher capital output ratios in the former area. Permanent changes in output require permanent changes in government spending, and these are implemented in the model, so deficits do not rise.
B
etween the end of 2006 and September 2008 oil prices rose from around$50 per barrel to a currently projected level of $113 in 2009. Oil prices reached a peak of $144 a barrel in July before falling back over the summer. These recent oil price increases have taken the real oil price back to, or above the levels seen in the 1980s, as we can see from Figure 4 which plots the exchange rate adjusted real oil price for the UK, the US and the Euro Area. The recent strength of the euro has meant that the full impact of the rise in the dollar oil price has been partly offset by the exchange rate, but even there oil prices are likely to remain high. However, high real oil prices may be less significant than they were in the 1970s, largely because oil (or rather fossil fuel) use has fallen as a percentage of output, as can be seen
from Table 4.3
4.
[image:16.595.162.518.365.604.2]Oil and the
Economy
Figure 4: Real Oil Prices in Domestic Currencies 2000 = 1.0
0 0.5 1 1.5 2 2.5 3 3.5 4 4.5 1970 Q4 1973 Q3 1976 Q2 1979 Q1 1981 Q4 1984 Q3 198 7Q2 1990 Q1 1992 Q4 1995 Q3 1998 Q2 2001 Q1 2003 Q4 2006 Q3 2009 Q2
US UK Euro Area
Fossil fuel use is more important in the US than in Europe, and its share of nominal costs has risen from 3 per cent in 1995 to a projected 12 per cent in 2008. If prices were just a mark up over costs, and if there were no second round effects, and no monetary policy response, then the $53 dollar rise in oil prices between the end of 2006 and September 2008 would suggest that the overall price level should rise by 4 per cent in the USA, by 2
THE BUDGETARY IMPLICATIONS OF GLOBAL SHOCKS TO CYCLES AND TRENDS IN OUTPUT 11
[image:17.595.163.520.145.310.2]per cent in the UK, and somewhere between the two in the Euro Area and Japan. Second round effects on prices could increase the impact of the increase in oil prices if nominal wage growth rose markedly because real wages were not adjusting quickly to their new, lower, equilibrium trajectory.
Table 4: Share of Fossil Fuels in GDP
Euro Area
France Germany Japan UK USA
% % % % % %
1975 6.0 4.0 3.0 4.8 6.7 7.8 1980 10.1 7.1 7.5 8.1 9.7 16.3 1985 7.9 4.8 8.2 4.6 8.1 7.5 1990 2.7 1.7 2.8 1.9 3.1 4.9 1995 1.5 1.0 1.4 0.9 2.1 3.1 2000 3.1 2.2 3.0 1.8 2.8 4.2 2005 3.8 2.6 3.8 3.6 3.5 6.4 2006 4.4 3.0 4.5 4.6 4.0 7.3 2007 4.1 2.8 4.2 5.1 3.7 7.9 2008 5.8 3.8 5.9 7.4 5.7 12.1
Oil, coal gas in oil equivalents, valued at world market prices.
Increases in oil prices change the terms of trade between oil producers and oil consumers, and also affect the productive capacity of the economy to produce output as fewer non-labour inputs are likely to be used. In countries that do not produce fossil fuels this change in the terms of trade is reflected in the balance of payments, and both real wages and real incomes must adjust. If they do not then unemployment will rise noticeably, as it did after the oil price shocks of the 1970s. In the Euro Area the rise in the price of oil between 2006 and 2008 means that the terms of trade have changed by 1.8 per cent (the rise in the nominal share of fossil fuels over that period) and real wages and real incomes must grow less rapidly than they otherwise would. For instance real wage growth would have to be ½ a percentage point lower for four years than had been anticipated in 2006 in order to accommodate the oil price increase.
The change in the terms of trade is much more important in the US, where real wages would have to grow one percentage point less rapidly than had been anticipated in 2006. The US is a significant fossil fuel producer, and real income growth would not have to slow down so much, but real incomes would still have to be around three percentage points lower than they would otherwise have been in four years time. The UK remains almost self sufficient in fossil fuels, and real incomes would fall only marginally. However, real (producer price adjusted) wage growth would still have to fall by around half a percentage point a year for four years. The rate of growth of incomes of pensioners and other who are dependent on oil rents (including the average tax payer) would not decline anywhere near as much.
12 BUDGET PERSPECTIVES 2009
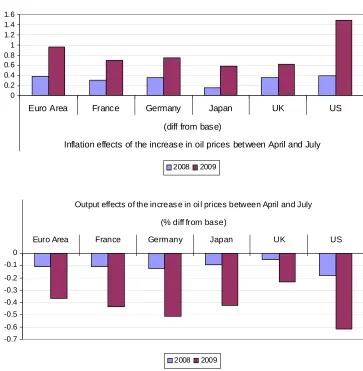
[image:18.595.160.523.298.669.2]If oil prices had not peaked in July 2008 and were $33 dollars lower now then inflation pressures would have been less. Figure 5 reports the impacts of such a change on inflation and output. The counterfactual implies that higher oil prices have raised inflation and reduced output. We assume policy makers would have cut interest rates, and that wage bargains would take account of the changed real prospects Rational expectations drive labour and financial markets, and agents know the real equilibrium and what the reactions of the authorities will be. The cyclical reactions of the economy will depend on how much the authorities change interest rates and how much labour bargains adjust to changes. The effects on output and prices depend on the oil intensity of production, with the largest effects being seen in the US. The US has the most flexible labour and product markets in this group, and hence prices rise more rapidly. Lower levels of demand will reduce budgets, with one per cent lower output being associated with a larger deficit of 0.5 to 0.7 per cent of GDP. It is important to know how much of this effect is permanent.
Figure 5: Impacts of Oil Prices Having Risen by Around $33 pb
0 0.2 0.4 0.6 0.8 1 1.2 1.4 1.6
Euro Area France Germany Japan UK US (diff from base)
Inflation effects of the increase in oil prices between April and July
2008 2009
-0.7 -0.6 -0.5 -0.4 -0.3 -0.2 -0.1 0
Euro Area France Germany Japan UK US
(% diff from base)
Output effects of the increas e in oil prices between April and July
2008 2009
THE BUDGETARY IMPLICATIONS OF GLOBAL SHOCKS TO CYCLES AND TRENDS IN OUTPUT 13
way as Barrell et al. (2008) to look at the impact of oil prices on output.
Output growth in an accounting framework is explained by the share inputs take in output multiplied by the rate of change in the input, and moving average shares of fossil fuel, labou
0.0% 0.5% 1.0% 1.5% 2.0% 2.5%
US Japan UK Germany France Italy Spain
r and capital in output allow us to onstruct a Tornquist output index.
[image:19.595.161.513.355.580.2]uro Area than it otherwise would have been as a result of higher oil prices.
Figure 6:
s by 2010 of an Increase of $50 in Oil Prices from $63 in 2006)
d wage pressures will be higher and unemployment will rise, as in the 1970s.
c
Over time fossil fuel inputs change, and they do so in part because their prices change. Weale (2008) suggests that the long-run elasticity of demand for fossil fuels has to be around minus one. It is clear, however, that adjustment is slow. We estimate it can take 4 years for 66 per cent of any adjustment to take place. If oil prices had not risen from their 2006 levels then more oil would be used as an input into production, and more goods could be produced. We have calculated the change in fossil fuel use that would take place between 2006 and 2010 in the light of these assumptions and used it in a growth accounting exercise. We first assume that oil usage drops in line with price increases, and calculate a trajectory for output. We then assume prices and shares do not change, and hence usage remains at 2006 levels. Figure 6 plots the impacts of these changes on the projected level of equilibrium output in 2010. The impacts are highest in the oil intensive USA and lowest in nuclear intensive France. In the very long run we would expect equilibrium output to be up to 2 per cent lower in the E
Oil Price Impacts on Equilibrium Output (Effect
14 BUDGET PERSPECTIVES 2009
0.0% 0.5% 1.0% 1.5% 2.0% 2.5% 3.0% 3.5% 4.0% 4.5%
1986 1988 1990 1992 1994 1996 1998 2000 2002 2004 2006 2008
[image:20.595.161.522.78.339.2]Value Volume
Figure 7: Fossil Fuel Use in Irish GDP
he impacts ending would be the same
made taxes will have to rise to keep the public fiancés on a sustainable path.
It is possible to make a simple estimate of the impact of higher oil prices on Irish output, although growth accounting is made difficult both by the absence of an easily available and long series for output at basic prices. This problem is exacerbated by the discrepancy of perhaps 14 per cent between national output and national income that comes from the prevalence of profit shifting through the Irish accounts. Given these problems we should treat Figure 7 with care, as it probably understates the role of energy in the Irish economy. As in earlier exercises, we take oil, coal and gas usage and value it at world market prices and compare to money GDP. This gives an energy intensity of output that is similar to the UK. In the longer term the rise in the oil price between 2006 and 2008 will require trend output in Ireland to be around 2 per cent or so lower, and hence that trend output grows by up to half a percentage point less a year for four years. T
on optimally organised government sp
R
ecent shocks to financial, housing and oil markets have caused growth toslow markedly in a number of economies. The shocks related to the housing market are probably cyclical in their effects, and their impacts on budget deficits can be treated with neglect. However, over the last two years there appears to have been a sea change in both the real oil price and in risk premia applied to investment. Between them these structural shocks have reduced sustainable output growth by between ½ and 1 per cent a year, depending on the economy considered. By 2010 sustainable output in the European economies is likely to be 2 to 3 per cent lower than had been projected in 2006, whilst the effect on the US would be around 4 per cent. Real wage growth has to slow to accommodate this. In addition, government spending plans have to be adjusted or taxes will have to rise. If the government’s share of output is to remain constant then spending plans must be revised down, with spending growing ½ to 1 per cent slower in real terms than projected in 2006. If such adjustments are not
REFERENCES
BARRELL, R. and E.P. DAVIS, 2005. “Policy Design and Macroeconomic
Stability in Europe”, National Institute Economic Review, No. 191, pp.
94-105.
BARRELL, R. and E.P. DAVIS, 2007. “Financial Liberalisation,
Consumption and Wealth Effects in 7 OECD Countries”, Scottish Journal
of Political Economy,May.
BARRELL, R., D. HOLLAND, I. LIADZE and O. POMERANTZ, 2008. “EMU and Its Impact on Growth and Employment”. Forthcoming in
EMU at 10 Buti and van den Noord (eds.), European Commission, NIESR Discussion Paper No. 314.
BARRELL, R. and A.I. HURST, 2008. “Financial Crises and the Prospects
for Recession” National Institute Economic Review, No. 204, pp. 33-38.
BARRELL, R., A.I. HURST and J. MITCHELL, 2007. “Uncertainty Bounds for Cyclically Adjusted Budget Balances” in M. Larch and L.N.
Martins (ed.), Fiscal Indicators, Brussels: European Commission, pp.
187-206.
BARRELL, R. and S. KIRBY, 2008. “Consumption, Housing, Wealth and
Financial Crises”, National Institute Economic Review, No. 205, pp. 57-60.
BARRELL, R., S. KIRBY and I. LIADZE, 2008. “The Oil Intensity of
Output”, National Institute Economic Review, No. 205, pp. 34-38.
WEALE, M., 2008. “High Oil Prices: Implications and Prospects”, National
Institute Economic Review, No. 205, pp. 4-7.
M
OBILISING
M
ARKET
-BASED
I
NSTRUMENTS
FOR
C
LIMATE
C
HANGE
IN
I
RELAND
Lisa Ryan, Frank Convery and Noel Casserly
A
s regards climate change, we are facing a carbon constrained world where ‘do nothing’ is not an option. Our national targets and mechanisms have come to us from the European Union. The European Union Emissions Trading Scheme (EU ETS) has created scarcity in the market place for the power and heavy industry sectors, and they face a price signal per tonne of CO2 (‘allowance’) that tells them that reduction at a costper tonne below the market price will be profitable, and increased emissions will cost. The response as to how to deal with this situation is left entirely up to the firms involved. This flexibility is crucially important to support innovation and competitiveness. The European Commission’s proposals for EU ETS post 2012 include auctioning of allowances – in particular in regard to the power sector – and centralisation of cap-setting. We support these proposals.
Abstract
Very demanding targets are now proposed by the Commission for the non-trading sector (agriculture, transport, waste, heat and process related emissions from residential, commerce and industry not in the trading scheme), to be achieved by 2020. This EU-originating target should supersede the national target set in the Programme for Government of an 86 per cent reduction from 2007 by 2010. We propose that the same flexibility and support for innovation that exists for the trading sectors apply also to the non-trading sectors, achieved by the immediate introduction of a carbon levy to reach the level of the allowance price in the EU ETS, with the revenues used to: reduce other taxes (40 per cent), address fuel poverty (30 per cent) and further support reduction in greenhouse gas emissions (30 per cent). The latter should be focused on the least cost opportunities and research and development. The levy on transport might later be replaced by an individualised cap and trade scheme. If the costs of abatement at the margin are substantially higher in the non-trading sector, then some flexibility between the trading and non-trading sectors should be sought from the European Commission. Time is not on our side, so action in Budget 2009 is important.
MOBILISING MARKET-BASED INSTRUMENTS FOR CLIMATE CHANGE IN IRELAND 17
T
he excessive emission of greenhouse gases is a manifestation of marketfailure which arises as a result of the public good nature of greenhouse gas
emissions. In a well-functioning market resources are allocated efficiently1
but well-defined property rights are necessary for this to occur, which is generally not the case with public goods such as greenhouse gas emissions.
1.
Introduction
The essence of markets is that they clear – a price emerges that brings demand and supply into equilibrium. If demand increases and supply does not, then the market price rises to bring them into equilibrium. If supply increases and demand does not, then the price falls. The market fails when a price does not emerge that reflects relative scarcity. This is typically the case with environmental endowments. They are often not ‘owned’ and as use intensifies, no price signal emerges to alert consumers to use them more parsimoniously, or bring use into balance with assimilative capacity. In regard to climate change, we emit gases into the atmosphere that warm the globe, and we do not get a price signal telling us that the capacity to assimilate these gases without the risk of substantive adverse effect is limited and is being overused.
This paper is about ways in which we correct for market failure by creating a price that signals scarcity, and what the implications are for fiscal and budgetary policy. Specifically, we address two choices: limiting quantity of emissions, and allowing trading amongst emitters, thereby producing a price, or introducing the price directly in the form of a tax per unit of pollution emitted.
A
lthough historically the most common instrument implemented in thearea of environmental policy has been command and control policies, these have been found to frequently be inefficient. Standard regulation can be statically inefficient in that it may not achieve environmental objectives at minimum cost, and it may be dynamically inefficient, since there may be no incentive for polluters to continually improve. In latter years demand-side market-based instruments such as taxes, green subsidies, and emissions trading have become more popular, as they provide an incentive to continually improve environmental performance at least cost. The revenue generated by market-based instruments can provide a double dividend if they are used to reduce other taxes which may be slowing economic
growth2 or creating inequity in society.
2.
Market-based Policy
Instruments
for
Greenhouse
Gas
Mitigation
There are several features that distinguish greenhouse gas emissions from other problems. First, the pollutants act globally and, therefore, a successful abatement strategy requires a large majority of emitting countries to cooperate and abate, which complicates the political implementation of
policy measures. Additionally, CO2 emissions3 are mainly a direct result of
1We may define efficiency in terms of Pareto optimality, which is the situation where we
are unable to reallocate resources without making at least one person worse off.
2An example is the eco tax in Germany where a tax was levied on fossil fuels and the
revenue was used to reduce labour taxes.
3There are six groups of greenhouse gases listed under the United Nations Framework
18 BUDGET PERSPECTIVES 2009
the combustion of fossil fuels and, therefore, are essentially a by-product of the industrial world. Abatement is different to that of other pollutants since end-of-pipe abatement of greenhouse gas emissions is expensive and, therefore, modifications to the combustion process are usually necessary, such as improvement in energy efficiency or fuel switching. However, this kind of abatement can provide side benefits, since more efficient combustion also saves the operator energy or fuel costs, and may also reduce other pollutants. A third feature of greenhouse gas emissions is that the consequences of abatement or lack of it will not be felt in the present but in the future.
In an ideal world the optimal emissions abatement level can be estimated by comparing the marginal cost and marginal benefit of the best available abatement technology. However, there is generally great uncertainty with respect to the shape and position of the marginal benefit and marginal abatement cost curves. Often the abatement costs are not known to the policymaker, due to incomplete information on abatement technologies. In many cases also the technology has not been fully developed and, therefore, the future costs of abatement may not yet be known even to the manufacturer. The marginal cost of abatement curve may be neither smooth nor linear, since abatement technologies may be much more costly for increasing abatement levels. Furthermore, as private agents are not faced with the full social costs of greenhouse gas emissions, the private damage costs usually do not equal the social damage costs. It may be very difficult to estimate the damage costs, both social and private, since the cost function in the real world is most likely non-linear and dependent on the number of ‘victims’, time, pollutant composition and perhaps location (Sterner, 2003). An important consideration in the estimation of greenhouse gas emissions costs is uncertainty regarding the future concentration of greenhouse gases in the atmosphere as a result of current emissions, and the implications. The intertemporal dimension adds complexity to the issue since it is not certain what the impact of any given greenhouse gas concentration will have on future global and regional
climates. Weitzman4 poses the intellectual and empirical challenge when
catastrophe is a possibility:
Societies and ecosystems whose mean ambient temperature has changed in the geologically instantaneous time of two centuries or so by 11c-20c are located in terra incognita, since such high average temperatures have not existed for hundreds of millions of years and such a rate of global temperature change might be unprecedented even on a time scale of billions of years. Standard conventional Cost Benefit Analyses (CBAs) of climate change do not come even remotely close to grappling seriously with this kind of potential for disasters. When comprehensive CBA includes plausible, if unknown, probabilities of (and plausible, if unknown, damages from) catastrophic climate change, the policy implications can be radically different from the conventional advice coming out of a standard economic analysis that essentially ignores this kind of potential for disasters.
4Weitzman, Martin, 2008. “On Modelling and Interpreting the Economics of Catastrophic
Climate Change”, Harvard University May 2008.
MOBILISING MARKET-BASED INSTRUMENTS FOR CLIMATE CHANGE IN IRELAND 19
Standard environmental economics textbooks tell us that the optimal level of greenhouse gas emissions abatement is at the point where the marginal abatement cost is equal to the marginal damage cost. In the case of optimal regulation, the pollution standards could be set to the optimal level. Similarly, if a policy instrument of taxes or charges were preferred,
the charge would be set at optimal t*5 to produce the optimal abatement
level or if a system of permits were implemented the quantity of permits issued would be equal to the same emissions level. So, theoretically at least, under ideal conditions the optimal abatement level can be achieved with either a tax or permit-based system.
In the real world, conditions are rarely ideal and policymakers must settle for a second or even third best policy solution. This is because, even if it were possible to estimate the optimal abatement level, there are often political constraints related to the implementation of the first best policy selected using the criteria above. Particular conditions, for example the socio-economic situation, information availability and structure, technology availability, environmental problem at hand, and political system demand different policy instruments.
Our perspective takes as given the European Union policy framework in which we find ourselves in Ireland in 2008. This is far from what many economists would regard as optimal if we could design and implement
policy from a tabula rasa. Going back to Weitzman (1974), there is a
literature which makes the case for the use of environmental taxes rather than emissions trading as a means of addressing climate change. There is also a very convincing case that, on grounds of both economic efficiency and environmental effectiveness, if emissions trading is to be used, it should apply to all emissions. Our reality is that there is no EU-wide greenhouse gas tax and little prospect of same, and the emissions trading scheme is only partial in coverage.
Given this context, the next sections describe the market-based policy options available for Ireland and outline their potential to efficiently and effectively reduce greenhouse gas emissions while improving competitiveness and social equity. The first of these approaches is called ‘emissions trading’ to which we now turn.
I
n Annex A, we discuss what emissions trading is, the context andpressures which produced a European Union Emissions Trading Scheme (EU ETS) for carbon dioxide, the main greenhouse gas, how it has been implemented and how it has operated in terms of price effects, abatement, creation of markets etc. Readers who are not familiar with trading in general, and the European scheme in particular, should read this annex before proceeding.
3.
Emissions
Trading in
Ireland
The questions that are interesting to address in regard to Ireland’s performance and potential vis-à-vis EU ETS include the following:
5When the charge or tax is set at the intersection of the marginal abatement cost and
20 BUDGET PERSPECTIVES 2009
How well did Irish companies adapt to the market over the 3 year pilot phase in terms of transactions, and in accessing allowances from a variety of sources?
Are utilities in Ireland capturing surpluses in the form of price increases that reflect the cost of allowances, but getting the allowances mostly for free?
If so, should there be an attempt to use the tax system to capture some or all of such surpluses?
Are there changes proposed for the system that Ireland should support or oppose?
Is there evidence for, or a prospect of, competitiveness issues, nationally or sectorally?
If a carbon tax is introduced, should it apply to those in the trading scheme?
Taking each of these in turn:
Trading Performance of Irish Companies in the European Union Emissions Trading Scheme (EU ETS) during the First (Pilot) Phase, 2005-2007.
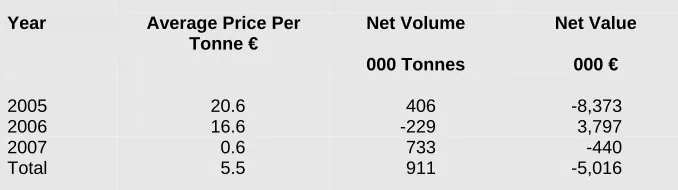
[image:26.595.169.508.463.558.2]The net balance in volume and cash terms is shown in Table 1 below:
Table 1: Net Balance in Allowances over the First (Pilot) Phase, EU ETS, Ireland
Year Average Price Per Tonne €
Net Volume Net Value
000 Tonnes 000 €
2005 20.6 406 -8,373 2006 16.6 -229 3,797 2007 0.6 733 -440 Total 5.5 911 -5,016
Source: Community Independent Transactions Log (CITL).
For the whole period, Ireland had a net expenditure of just over €5 million and net purchases of 911,000 tonnes, at average cost per tonne of €5.50. There were net sales in 2006, when prices were relatively high, and the largest net purchases took place in 2007 when prices were at their lowest. In EU ETS, installations receive their annual allocations in February, but do not have to balance their account for the previous year
until April, which means they can de facto borrow allowances, and many
seem to have borrowed forward to avail of the much cheaper allowances in 2007. We can conclude that, overall, companies were either lucky or good, or perhaps both, at reducing the costs of meeting their commitments.
MOBILISING MARKET-BASED INSTRUMENTS FOR CLIMATE CHANGE IN IRELAND 21
ELECTRICITY PRICE PASS THROUGH
For the pilot phase, the Commission on Energy Regulation (CER) only allowed the marginal cost – the cost of the net purchases of allowances – to be passed on to consumers. However, the situation changed in regard to the second phase (2008-2012) and thereafter. This is in the context that, overall, utilities were left short in the sense that allocations were lower than historic emissions in this second phase.
A good sense of the key issues and challenges for the future can be discerned by examining the Environmental Protection Agency (EPA)
publication, Ireland’s National Allocation Plan Second Consultation, October 2
2007,6 which applies to the 2008-2012 period.
The total quantity of allowances to be allocated in the period represents 87 per cent of forecasted emissions in that period. Of the total 9 per cent has been ‘held back’ to cover new entrants. This provision in the EU
scheme is controversial, as it is held by some to de facto discriminate in
favour of polluting incumbents, on the following basis: a new entrant who proposes to build an emission-free plant will get no allowances, while an incumbent who wishes to develop a new plant with emissions can use the asset value of their existing free allowances to get cheap credit for the expansion, and get the additional emissions ‘covered’ by receipt of more free allowances.
A total of 22.262 million allowances annually are allocated. This compares with 22.32 million annually allocated in the first period, a reduction of less than one per cent. Holders are capped as regards the extent to which each installation can meet their needs using linking mechanisms to 12, 11, and 1 per cent respectively in the power generation, cement and general sectors. Only 0.5 per cent of allowances will be sold, “to defray the expenses of administering the emissions trading scheme”.
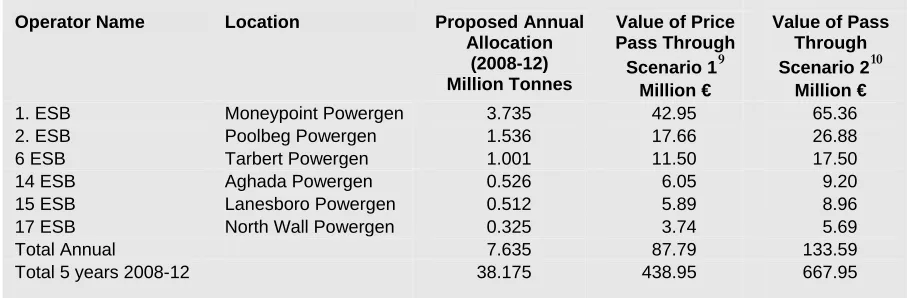
There are over 100 installations included, and we can divide them into power generation, cement, and the rest. The bulk of allowances go to electricity generating stations and cement plants. (See Annex Table 1 for top 17 installations, ranking based on proposed allocation for 2008-2012.)
All 12 electricity installations have been allocated 68 per cent of their ‘relevant emissions’, the latter comprising mainly their historic emissions (with 2003 as the key year in this regard), or their projected emissions. It is assumed that the contribution of renewables grows from 4.3 per cent in 2003 to 15 per cent in 2020 and 33 per cent by 2030, and this expectation was accounted for in making allocations to the powergen sector.
The companies involved will need to bridge whatever gap exists between their free allocation and their prospective emissions by a combination of abatement, fuel switching, purchase of allowances, and purchase of project-based credits from Joint Implementation (developed countries) or Clean Development Mechanism (CDM).
22 BUDGET PERSPECTIVES 2009
With the emergence of the all-island electricity market, it is clear that generators in this new market will be expected, as a condition of their generation licences, to bid into the all-island wholesale market at prices that fully factor in their short-run marginal costs (SRMC) for each half-hourly
dispatch period. Such costs explicitly include the full opportunity cost7 of
EUAs for each half-hour period,8 a provision which did not apply during
the pilot (2005-07) phase. It is likely that any ‘must run’ status peat-fired stations would be allowed to include any Public Service Obligation (PSO) subvention as a negative marginal cost.
However, the overall bidding principle of SRMC is quite clear. Under this system, electricity consumers will pay at least some of the opportunity-cost value of allowances, even where the utilities have not had to pay for them. It is important from an environmental performance point of view
that households will face and experience the costs of emitting CO2 into the
atmosphere associated with their consumption of electricity. It is also appropriate that the charge will vary depending on the carbon intensity of electricity generation. Under a system where permits are issued without cost to the electricity companies, it was the pass through of the opportunity cost of free allowances in the pilot phase that encouraged Germany, the UK and Italy to auction a significant proportion of their allowances (up to 10 per cent is allowed under EU ETS regulation). But Ireland is only selling 0.5 per cent of its allocation, so there is not a direct substantial flow to the Exchequer.
Where does the public interest lie in regard to the pass through? Pass through encourages reduction in electricity consumption, and should be allowed; it confronts the consumer with the marginal costs of abatement. But should the government claw back some or all of this pass through to the extent that it occurs as ‘unearned’ profit by the company?
In considering this issue, it is useful to distinguish between the State-owned Electricity Supply Board (ESB) and the rest. The ESB is the dominant incumbent, with a proposed allocation over the five year phase 2
(2008-12) period of 38.5 million tonnes of CO2, which is just over two and
a half times the allocation to the rest of the utility sector.
ESB
The value of the pass through to the ESB is estimated for two scenarios – assuming a price of €23 per tonne and pass through of 50 per cent and average price of €25 – and pass through of 70 per cent – is shown in Table 2. The total value for the five year second phase is €438-668 million range.
7‘Opportunity cost’ is the value foregone in using an asset and is independent of whether
one paid for it or not. Thus, an allowance in EU ETS for delivery in 2008 is today trading at €26.00 per tonne of CO2. If – as will be the case in Ireland – emitters get these valuable allowances for free, they will still recognise their full value as they make decisions. Just because an indulgent aunt gives you a house for free, you do not give it away or rent it for free – you recognise its full opportunity cost.
8See: All Island Project – the Bidding Code of Practice – A Response and Decision Paper
MOBILISING MARKET-BASED INSTRUMENTS FOR CLIMATE CHANGE IN IRELAND 23
Table 2: Estimated Value of Pass Through of CO2 Price Accruing to the ESB, Two Scenarios,
2008-12
Operator Name Location Proposed Annual Allocation
(2008-12) Million Tonnes
Value of Price Pass Through Scenario 19
Million €
Value of Pass Through Scenario 210
Million €
1. ESB Moneypoint Powergen 3.735 42.95 65.36 2. ESB Poolbeg Powergen 1.536 17.66 26.88 6 ESB Tarbert Powergen 1.001 11.50 17.50 14 ESB Aghada Powergen 0.526 6.05 9.20 15 ESB Lanesboro Powergen 0.512 5.89 8.96 17 ESB North Wall Powergen 0.325 3.74 5.69 Total Annual 7.635 87.79 133.59 Total 5 years 2008-12 38.175 438.95 667.95
Since the ESB is wholly government owned, as a shareholder it should in any event benefit from any surplus. However, the policy context is rapidly evolving. In July 2008, the Commission on Energy Regulation (CER) welcomed the joint announcement by the Spanish utility Endesa and the ESB that the former was purchasing a number of ESB power generation stations as part of the Commission’s CER-ESB Asset Strategy Agreement aimed at reducing ESB’s share of the power generation market to 40 per cent by 2010. On March 27, 2008, the ESB and the government announced a major investment programme, whereby between now and 2020, €22 billion will be invested, including networks (€11 billion) that will facilitate the development of 6,000 MW of wind power island wide development on its own account of 1,400 MW of wind power investment in energy efficiency, including smart metering. The ESB proposes to halve its carbon emissions within 12 years, delivering one-third of its electricity from renewable generation, and achieve carbon net zero by 2035. It seems likely that some of this investment will correct for market failures e.g. in energy efficiency via smart meters, and that there is a case for allowing all of the value of the pass through to be held by the company to help fund this investment However, it is important to formalise the analysis to see that such is the case. This would also help decide what policy should be in relation to the surplus likely to accrue to the other companies.
Other Utilities
A similar logic applies to the other utilities. The aggregate surplus accruing over 5 years is estimated to fall in the €174-269 million range (Table 3). The CER has been struggling to encourage sufficient capacity to provide competition to the ESB, so there may be reluctance to impose requirements on those new entrants who have come into the market. However, this needs to be balanced by the fact that consumers are
providing them with a gain for which they have not paid, and a quid pro quo
is appropriate, perhaps with a focus on energy efficiency. The Kema (2008)
9Assuming average price per tonne of CO
2 of €23, and – following Sijm et al. (2006) – an average pass through of 50 per cent. Example for Moneypoint: Annual pass through equals 3.735 million x 23 x 0.5 = 42.95.
10Assuming average price per tonne of CO
[image:29.595.66.522.107.256.2]24 BUDGET PERSPECTIVES 2009
analysis of energy efficiency enhancing opportunities in Ireland makes the point (p.30) that :
[image:30.595.160.521.194.441.2]It is clear that electricity offers the most significant potential for energy savings (greater than those of oil and gas combined). This reflects both the nature of electricity use in society and also the losses associated with its generation.
Table 3: Estimated Value of Pass Through of CO2 Price Accruing to the
Other (non ESB) Utilities, Two Scenarios, 2008-12
Company Facility Proposed Annual Allocation
Million Tonnes
Value of price pass through Scenario 111
Million €
Value of Pass Through Scenario 212
8 Viridian Power Huntstown, Finglas
Powergen 0.806 9.27 14.1 9 Synergen Ringsend
Powergen 0.768 8.83 13.4 10 Tynagh Energy Tynagh Co
Galway
Powergen 0.739 8.5 12.9 11 Huntstown Power
Co.
Finglas
0.721 8.29 12.62 Total 3.034 34.89 53.1 Total over 5 years 15.17 174.43 265.5
TRADING POST
2013
The European Commission has presented proposals for the EU ETS from 2013 to 2020 (the third phase) and thereafter. The key features are:
• Cap tightening – stepwise reduction of total allowances by 20 per
cent by 2020.
• Centralisation (’harmonisation’) of – cap fixing, allocation,
monitoring verification and enforcement.
• Auctioning of allowances, with focus on the power sector.
• Leakage provisions for the non-power sectors – more free
allowances and/or ‘equivalent effort’ required of imports to EU.
• Banking (including Certified Emission Reductions (CERs) from
CDMs that are already in the second phase ERs) over 13 years – 2008-2020.
11Assuming average price per tonne of CO
2 of €23, and – following Sijm et al. (2006) – an average pass through of 50 per cent. Example for Moneypoint: Annual pass through equals 3.735 million x 23 x 0.5 = 42.95.
12Assuming average price per tonne of CO
MOBILISING MARKET-BASED INSTRUMENTS FOR CLIMATE CHANGE IN IRELAND 25
• CERs post 2012 parked pending UN agreement.
• Exclude small-scale installations (but require “equivalent effort”?).
• Effort sharing – distribute 10 per cent of auctioned allowances to
poorer Member States.
These measures are to be welcomed for a number of reasons:
Auctioning will remove the advantage which free allocation gives to incumbents. It will also generate revenues which will accrue to the member
states and can be used inter alia to reduce other taxes, intensify carbon
reduction effort elsewhere and provide support for poorer people who are particularly disadvantaged by higher prices.
The long period of banking and borrowing will allow smoothing of the market thereby reducing price swings.
Innovation in new carbon reducing technologies will be stimulated by the longer time horizon, the more stable prices and the guarantee that there will be an immediate cash payoff to reductions.
The ESB’s strategy of investing in carbon reducing technologies will have the commercial benefit to them of reducing the volume of allowances that they will need to buy to cover their emissions, to the point that they may become exporters of allowances.
COMPETITIVENESS ISSUES
No significant issue in this regard has arisen during the pilot phase, with net outgoings being less than would be paid for an acre of land in Dublin’s city centre.
Short Term (2008-2012)
There are short-term issues in the second period arising from the free allocations. When low carbon competitors come into the Irish market, it is crucial that the incumbent advantage of free allocation not be allowed to disadvantage such new entrants.
There is a systematic tendency for the non-utility firms to be treated generously. Excluding cement, their emissions are small: generally a lot less than 100,000 tonnes annually. Those of some significance as regards volume are the Conoco Phillips Whitegate Refinery (Relevant Emission of 372,094; allocation 389,164), Bord na Móna briquette factories at Derrinlough (relevant emission 68,343; allocation 71,478) and Littleton (relevant emission 67,180; allocation 70,261), Diageo Dublin (relevant emission 70,681; allocation 73,924).
26 BUDGET PERSPECTIVES 2009
Longer Term (2013-2020)
While allowances to the utility sector will be auctioned, the issue of auctioning allowances for the non-utility sectors in the scheme is left more open, depending in part on the credibility of the evidence regarding competitiveness issues. Going forward, the Commission proposes a two step approach. Identify the extent to which such issues are relevant at the sectoral level. If there is evidence of negative competitive effects, two possible solutions – requiring ‘equivalent effort’ from companies selling into the EU, in the sense of buying allowances to cover the emissions that were emitted, or giving European producers free allowances. These options are currently being debated.
CARBON TAX AND TRADING
[image:32.595.85.524.450.683.2]The firms in the trading scheme have shown that they can adapt to the market. They are faced with a price signal in the Euro 20-30 range that tells them 24 hours a day, 365 days a year, that, if they reduce emissions at a cost below this level, they can sell the allowances released at a profit. It would be redundant and economically inefficient to apply a carbon tax to those in the trading sector, for the following reasons: individuals and firms adjust at the margin to approximately make the costs and benefits at the margin equal, and diminishing returns sets in – the more you do, the more expensive it becomes. Efficiency for a particular objective is maximised if the returns at the margin across all the abators is equal. So we recommend that the carbon tax only be applied to those not in the trading scheme. The scale of the challenge, in terms of meeting the Commission’s target of a 20 per cent reduction in the non-trading sectors is clear from the Table below.
Table 4: Emissions from the Non-Trading Sector in 2005, and Hypothetical Targets for 2020 to Meet the EU Cap
Sector Emissions in
2005 Million Tonnes of CO2
Equivalent
Per Cent of Total
Target if Each Sector Reduced
Pro Rata by 20 Per Cent in Tonnes of CO2e
Reduction Needed in Million Tonnes of
CO2e
Agriculture13 19.6 41.3 15.7 -3.9 Transport 13.0 27.4 10.4 -2.6 Residential (non-electric only) 6.9 14.6 5.5 -1.4 Service Premises (private offices and
public buildings) 2.9 6.1 2.3 -0.6 Waste 1.8 3.8 1.4 -0.4 Other (industry not in EU ETS, tourism
etc. 3.2 6.8 2.6 -0.6 Total 47.4 100 37.9 -9.5
MOBILISING MARKET-BASED INSTRUMENTS FOR CLIMATE CHANGE IN IRELAND 27
Note that this scenario assumes that emissions in 2020 will equal those
in 2005, which is a highly conservative assumption.14 But even with this
context, we have to squeeze almost 10 million tonnes of emissions out of the system over 12 years, in a context where emissions from agriculture only reduced by 0.7 million tonnes (from 20.3 to 19.6 million) over the 1993-2005 period, and emissions from transport rose by 7.2 million tonnes (from 5.8 to 13.0 million) over the same period.
What role can a carbon tax play in meeting this challenge? This is the topic to which we now turn.
A
carbon tax is a tax on the emissions of carbon or carbon dioxide and isa favoured instrument for economists to reduce CO2 emissions due to its
cost-effectiveness. Unlike international oil price rises, which benefit foreign producers, the revenues from carbon taxes can enable other taxes to be reduced, vulnerable households to be helped and the energy-efficiency of their homes to be upgraded.
4.
Carbon Tax
in the
Non-Trading
Sectors
As with all market-based instruments the relative increase in the cost of emitting carbon coaxes people to adjust their habits to dearer energy. The goal is to ultimately reduce carbon emissions by sending a price signal to businesses and consumers so that they change their behaviour. By giving users the choice to either reduce their emissions or to pay the tax, carbon taxes are cost effective since generally firms and users with the least abatement costs undertake abatement first. There is also dynamic efficiency, as carbon taxes incentivise firms to invest in technological innovation that will allow them to continually improve their emissions reductions. Inventors of clever ways to reduce energy use now face customers whose interest is enhanced by the true value of the savings that efficiency will bring them.
Carbon taxes are a price-based instrument, compared with emissions
trading which is based on emissions quantities.15 There are advantages and
disadvantages to both in their implementation but theoretically, if emissions permits are auctioned in perfect market conditions then both instruments can be equivalent. As with all policy, it is the design of policy measures which determine their success or failure under the usual criteria of static and dynamic economic efficiency, environmental effectiveness, socio-economic impacts, and political/public feasibility.
Taxes on income and labour have a tendency to discourage work while taxes on pollution discourage pollution. Therefore, raising the same amount of revenue but via more pollution taxes and lower labour taxes helps make the economy more efficient while lowering pollution. Aggregate taxes do not rise but they are raised in a smart manner. Similar arguments can be made for emissions trading systems where emissions permits are auctioned and the revenue used to reduce other taxes. There
14Recent EPA projections suggest that in 2020 the non-ETS sectors will generate 53.3,
52.0, and 44.9 Mt CO2 under their baseline, “with measures”, and “with additional measures” scenarios respectively.
15In the cap-and-trade version of ETS, a cap is set on the total emissions permitted from
28 BUDGET PERSPECTIVES 2009
are now several Member States with Environmental Tax Reform (ETR) in place and the COMETR project has carried out an ex-post assessment of the experiences of seven EU Member States with ETR and finds that there are largely positive effects (see Box 1).
The Programme for Government agreed in July 2007 states that: Appropriate fiscal instruments, including a carbon levy, will be phased in on a revenue-neutral basis over the lifetime of this Government. The environment subgroup of the Commission on Taxation was established in March 2008 …to investigate fiscal measures to protect and enhance the environment including the introduction of a carbon tax.
A carbon tax has been discussed in the Irish context repeatedly since Fitz Gerald and McCoy first explored the options for implementation of a carbon tax in Ireland in their seminal paper in 1992. Further work was carried out subsequently on the impact of a carbon tax on the Irish
economy (Bergin et al., 2004; Smith, 2003; Wissema and Dellink, 2007; Fitz
Gerald et al., 2008; and Tol et al., 2008) and examining the distributive
effect on households (Scott and Eakins, 2004; Tol et al., 2008). The
Department of Finance considered the introduction of a carbon tax in 2003
and opened a public consultation on the issue.16 Subsequently, a report was
produced summarising the 117 submissions and in September 2004 the Minister for Finance, Charlie McCreevy, announced that the carbon tax
would not be implemented. The reason given was that …the environmental
benefits would not justify the difficulties that would arise, particularly for households, from the introduction of such a tax. There was insufficient political will to implement a policy with such a high level of public unpopularity.