Accepted Manuscript
Effect of sugar and acid composition, aroma release and assessment conditions on aroma enhancement by taste in model wines
Gaëlle Arvisenet, Jordi Ballester, Charfedinne Ayed, Etienne Sémon, Isabelle Andriot, Jean-Luc Le Quere, Elisabeth Guichard
PII: S0950-3293(18)30375-6
DOI: https://doi.org/10.1016/j.foodqual.2018.07.001
Reference: FQAP 3536
To appear in: Food Quality and Preference
Received Date: 24 September 2017 Revised Date: 5 June 2018 Accepted Date: 2 July 2018
Please cite this article as: Arvisenet, G., Ballester, J., Ayed, C., Sémon, E., Andriot, I., Le Quere, J-L., Guichard, E., Effect of sugar and acid composition, aroma release and assessment conditions on aroma enhancement by taste in model wines, Food Quality and Preference (2018), doi: https://doi.org/10.1016/j.foodqual.2018.07.001
1 Effect of sugar and acid composition, aroma release and assessment conditions on
aroma enhancement by taste in model wines
Gaëlle ARVISENET, Jordi BALLESTER, Charfedinne AYED*, Etienne SÉMON, Isabelle
ANDRIOT, Jean-Luc LE QUERE, Elisabeth GUICHARD
Centre des Sciences du Goût et de l'Alimentation, AgroSup Dijon, CNRS, INRA, Université
Bourgogne - Franche-Comté, F-21000 Dijon, France.
*
Current address: Flavour group, Division of Food Sciences, University of Nottingham,
Sutton Bonington Campus, Sutton Bonington, Loughborough, Leicestershire LE12 5RD,
2 Abstract
Context. When congruent taste and retronasal aroma are perceived simultaneously, aroma can
be enhanced by taste. Different explanations have been proposed: (i) physico-chemical
interactions between tastants and aroma compounds, inducing a change of the aroma stimulus
before it reaches the receptors, (ii) a contextual bias during sensory tests (dumping), when at
least one relevant attribute is not proposed to the panelists to assess a product, (iii) a
misunderstanding of the conceptual difference between aroma and taste, or (iv) a perceptual
incapability of panelists to distinguish between two congruent percepts. This study was
undertaken to better understand aroma enhancement by taste in model wines containing
different sugar and acid concentrations but the same volatile composition.
Method. We used a twofold approach:
(i) model wine retronasal aroma intensity was assessed twice by trained panelists. During the
first session, panelists only assessed aroma intensity. During the second session, taste
intensity was assessed before aroma intensity, to reduce dumping effects.
(ii) in-mouth release of volatile compounds was measured by nosespace analysis with the
same panelists.
Results. Acid concentration influenced aroma compounds release, but it did not impact
perceived aroma intensity. Increasing sugar concentration delayed ethyl octanoate (EO)
release after swallowing. When taste was not assessed, perceived aroma intensity was not
explained by aroma compounds release, but it increased with sugar concentration, probably
because of a dumping effect. When taste was assessed, aroma intensity also depended on
sugar concentration, but it was significantly correlated to the time of release of EO. Our
hypothesis is that when taste declined, late aroma was more easily individualized, and thus
assessed with a higher intensity. This entails that panelists focused on aroma to individualize
3 between taste and aroma, but are not completely able to distinguish congruent and
simultaneous taste and aroma percepts.
Keywords
Flavor, cross-modal interactions, PTR-MS, sensory analysis, in vivo aroma release, aroma
4 1. Introduction
It is now accepted that the aroma perceived in food products is not only determined by the
odorant volatile compounds contained in the product. It also depends on other product
properties, like taste and texture (King et al., 2006; Visschers, Jacobs, Boelrijk, Frasnelli, &
Hummel, 2006), and on consumer experience and previous exposure to products (Chrea,
Valentin, Sulmont-Rosse, Nguyen, & Abdi, 2005; Petit, Hollowood, Wulfert, & Hort, 2007).
The literature reports numerous cases of tastant-dependent changes in perceived retronasal
aroma intensity. For instance, the intensity of fruity aroma was shown to increase with
sweetener content in model solutions (Dalton, Doolittle, Nagata, & Breslin, 2000; Fujimaru &
Lim, 2013; Green, Nachtigal, Hammond, & Lim, 2012; Hort & Hollowood, 2004; Pfeiffer,
Hollowood, Hort, & Taylor, 2005), orange juice (Bonnans & Noble, 1993) model dairy
desserts (Lethuaut et al., 2005; Tournier, Sulmont-Rosse, Semon, Issanchou, & Guichard,
2009) and custard dessert (Green, et al., 2012).
Aroma enhancement by taste can be provoked by an increased release of the volatile
compounds, due to the presence of tastants modifying the odorant stimulus before it reaches
the olfactory receptors. It can also be linked to an artifact of the sensory task (“dumping”) or
to other effects generally referred to as “perceptual”. It is still unclear whether these
perceptual effects are provoked by confusion between sensations perceived by the senses of
taste and smell, or are the result of a cognitive association of congruent aroma and taste. The
way these mechanisms impact aroma perception is described below.
- Physico-chemical interactions between aroma compounds and tastants in food products can
affect the quantity of aroma compounds available for perception, depending on the type of the
tastant and its concentration (Rabe, Krings, & Berger, 2003). For instance, sugar
5 chemical input induced a change in sensory output (Piccone, Lonzarich, Navarini, Fusella, &
Pittia, 2012).
- Dumping effect was studied in several sensory studies, where taste-aroma interactions were
shown to be instruction-dependent. The number of attributes panelists had to score influenced
the intensity of the perception they reported. Indeed, when a salient property of the product is
not proposed to panelists as an attribute to be evaluated, panelists may transfer their
judgement about that property of the product into another attribute they are asked to score.
For example, when a single intensity estimate was requested in a multidimensional product,
independent but congruent sensory dimensions combined to influence the response (Clark &
Lawless, 1994; Frank, van Der Klaauw, & Schifferstein, 1993; Frank, Wessel, & Shaffer,
1990). This effect was sometimes interpreted as resulting from the impact of attributes on how
attention is directed towards odor and taste (Prescott, 2012; van der Klaauw & Frank, 1996).
- Another interpretation of aroma enhancement by taste involves people’s failure to
understand what taste and orally perceived aroma are. This probably results from the fact that
both stimuli occur when a food is placed in the mouth. Indeed, the more congruent a person
perceives a couple of taste and retronasal odor, the more this person tends to locate this odor
in the oral cavity (Lim, Fujimaru, & Linscott, 2014). Most people ignore that taste and aroma
are perceived by different receptors. As a consequence they do not make distinction between
for example, sweet taste and fruity aroma, both referred to as “taste” in everyday language
(Spence, Smith, & Auvray, 2015). It can reasonably be thought that this conceptual distinction
can be made by trained panelists.
- Having observed that even when their attention was directed to the salient attributes of a
mixture, trained panelists experienced taste enhancement by a congruent odor, Stevenson
(2001) interpreted this result as proof of the relative cognitive impenetrability of some
6 refers to the “binding” of different perceptual events in the brain, resulting in a unified flavor
experience (Stevenson, 2016). This is consistent with studies showing that, after being
conveyed by different sensory channels, taste, oral somatosensory and olfactory inputs
combine in the central nervous system to form a unitary percept (Small, 2012; Small &
Prescott, 2005). This phenomenon is thought to result from associative learning resulting from
individuals’ previous experience of the association between the stimuli.
It is possible that several of these effects could co-exist, making it difficult to understand the
mechanisms involved in retronasal aroma enhancement by taste. It can be difficult to prove
that aroma enhancement by taste result from perceptual effects. Temporal measurement or
devices using individualized solutions of tastants and aroma compounds have mostly been
used to study perceptual effects. As an example, in a study of a model solution of menthone
and sucrose, panelists’ perception of mint flavor was shown to follow sucrose release in saliva
rather than menthone release (Davidson, Linforth, Hollowood, & Taylor, 1999), proving the
perceptual nature of interactions. Fujimaru & Lim (2013) also succeeded in demonstrating
that odor enhancement by sucrose originated from perceptual phenomenon; in their study,
panelists inhaled citral in vapor phase via the mouth while tasting sucrose.
In complex products, physico-chemical interactions and perceptual effects often co-exist. In
this case, physico-chemical interactions are easier to detect than perceptual effects, which can
be particularly difficult to evidence. Comparing the scores of different panels, Arvisenet,
Guichard & Ballester (2016) demonstrated the occurrence of perceptual effects in model
wines, despite the presence of physico-chemical interactions. Retronasal aroma enhancement
by sugar was assessed by three panels with different levels of training and product expertise.
When panelists were provided with only one scale to score aroma and were not asked to score
taste, all three panels experienced the same level of aroma enhancement by sweet taste. Yet,
7 able to reduce the intensity of aroma enhancement by taste, compared to untrained panelists.
This result suggests that when conditions allow avoiding dumping effects, experts and trained
panelists are more able than untrained panelists to make a distinction between taste and
aroma. This proves that the aroma enhancement by taste was mostly due to a perceptual effect
stronger in untrained panelists than in trained panelists and experts. The nature of this
perceptual effect cannot easily be determined. Trained panelists and experts may know better
than untrained panelists the difference between taste and aroma, and may be less likely to
confuse taste and aroma. Thanks to their previous exposure to sweet wines and to descriptive
tasks, trained panelists and experts might also have a higher capability than untrained
panelists to disentangle the cognitive association between sweet taste and fruity aroma.
In this previous study, aroma release was only investigated by static in vitro measurements, in
order to be compared to orthonasal odor. But retronasal aroma enhancement by taste would
most probably result from tastant-induced change of in-mouth aroma release. Thus, this in
vivo dynamic process has to be taken into account to better understand how panelists assess
aroma intensity when taste changes.
The present study was carried out in order to gain further understanding about the
mechanisms involved in aroma enhancement by taste by perceptual effects. To this end, we
studied the correlations between the aroma scores assessed by trained panelists and the release
of key aroma compounds over time. Two sensory tests conditions were tested, varying by the
number of descriptors panelists were asked to assess: aromas only or tastes first and aromas
afterwards. Our objective was to understand the factors involved in the assessment of aroma
when taste varies.
8 2. Materials and methods
2.1. Model wines
Four model wines (8% v/v ethanol) were prepared, varying the tartaric acid content (2.5 or
5 g.L-1) and the sugar (mixture of fructose and glucose, 2:1) content (5 or 80 g.L-1) (Table 1).
The concentrations of tartaric acid and sugars were chosen to cover the range of those found
in Gewurztraminer wines and to produce sweetness and acidity intensities distinctively
different from one model wine to another. The four studied model wines contained the same
amount of glycerol, acetic acid, citric acid and sulfur dioxide. All these compounds were food
grade and were purchased from Sigma-Aldrich (St Quentin Fallavier, France).
Model wines were flavored as described in Arvisenet et al. (2016) with exactly the same
quantity of the same mixture of aroma compounds in each model wine (Table 2). These
compounds and their concentrations were chosen based on previous research of the aroma of
Gewurztraminer wines (Guth, 1997; Ong & Acree, 1999). Model wines containing this aroma
composition could be taken for a real Gewurztraminer wine by untrained panelists (Arvisenet,
et al., 2016). Those wines were freshly prepared on the day of testing for both sensory tests
and nosespace analyses.
2.2. Sensory analyses
2.2.1. Sensory evaluation of the retronasal aroma of model wines varying in sugar and acid
content
This study was approved by a human ethics committee “(Comité de Protection des Personnes
EST I”, Reference: 2014/14 – ID RCB: 2013-A01767-38). Informed written consent was
obtained from the subjects prior to their participation. Panelists were told they would
9 real objective of the study or that the wines they would evaluate were artificial. Pregnant
women were excluded from the study.
2.2.1.1 Panel
The panel was composed of 19 intensively trained panelists and 14 wine experts who took
part in our previous study (Arvisenet et al., 2016). Having observed in this previous study that
trained panelists and experts had identical perception of taste-aroma interactions in model
wines, we included them in the present study as a same group, referred to as “trained panelist”
throughout this paper.
Seven panelists were selected from the group of 33, on the basis of their sensory results, to
represent all the levels of aroma enhancement by taste observed in the group of 33 panelists:
the smallest observed enhancement, the highest observed enhancement, and medium level of
enhancement. This smaller group was composed of five men and two women. Two of them
were under the age of 26, two were between 26 and 40 and three were over 40 years of age.
These seven panelists participated in both the sensory evaluation and measurements of in vivo
aroma release.
2.2.1.2. Model wine evaluation
Tests took place in a sensory lab equipped with booths. Samples were served at ambient
temperature (20°C). For each task, 20-mL samples were poured into standardized tasting
glasses (ISO, 1977) that were opaque (black) to eliminate visual cues as sources of
information. The glasses were coded with 3-digit numbers and covered with plastic Petri
dishes. In order to limit carry-over effects and memory biases, all wine samples were
presented in a different order specific to each participant for each task within each session,
10 Courtenon, France). Panelists were asked to use water and unsalted crackers as palate
cleansers between samples.
Structured-numbered 8-point scales were used with values ranging from 0 to 7 and intensity
terms associated with extreme values: “none” to “very intense”.
Two sessions took place. During the first session, panelists were asked to score the intensity
of two retronasal aroma descriptors (fruity and floral) and the global intensity of aroma for
each sample of model wine, but were not asked to score the taste of the samples. In the second
session, panelists were asked to score first sourness and sweetness and then, the intensity of
fruity and floral aroma as well as the global intensity of aroma, in the same order as in the
first session.
In the second session, we expected to limit the dumping effect that can occur when panelists
are asked to score a small number of descriptors, compared to the number of sensory
characteristics that can be easily perceived in the products.
In the two sessions, model wines were assessed according to a serial monadic protocol.
Panelists were not allowed to re-taste previously assessed samples.
2.3. Nosespace analyses
The seven panelists performed a nosespace study conducted with a proton transfer
reaction-mass spectrometer (PTR-MS) instrument equipped with a Time-of-Flight (ToF) analyzer
(PTR-ToF 8000, Ionicon Analytik, Innsbruck, Austria). Parameters of the PTR-MS
instrument were adjusted according to a previous work conducted on model wines, which
allowed ethanol chemical ionization conditions while minimizing the protonated molecular
ion fragmentation of the volatiles used in this study with no compromise in sensitivity for in
vivo applications (Sémon, Arvisenet, Guichard, & Le-Quéré, 2018). All the measurements
11 temperature of 80°C, and drift voltage of 340 V, resulting in an E/N ratio of 80 Td. Data
acquisition was performed at 1 mass spectrum ranging from m/z 0 to 250 per 0.108 second.
Mass axis calibration and calculation of peak areas were done with the software PTR-MS
Viewer version 3.1.0.28. Breath volatile concentrations were expressed as normalized cps
(ncps), taking into account corrected transmission and normalization to the protonated water
and the protonated ethanol (C2H5OH)H+ monitored at their respective 18O isotopic
contributions found at m/z 21.022 [H318O+] and m/z 49.054 [C2H518OH2+]. All the mass
spectra were background-subtracted using the background signal measured before sample
introduction into the mouth. A warm-up sample preceded the tested samples in order to
introduce ethanol vapor in the inlet and the drift tube to pre-establish ethanol chemical
ionization conditions and to familiarize subjects with the protocol and the nosepiece used for
nosespace sampling. This ergonomic Teflon® nosepiece, delivering the sampled nosespace
through both nostrils, was mounted on a light helmet that enabled the subject to move his/her
head freely. It was connected to the transfer line of the PTR instrument by a flexible heated
(75°C) PEEK tubing (85 cm long, 1mm internal diameter) (Schlich et al., 2015). Sampling
was performed at a total flow rate of 60 mL/min with the transfer line maintained at 80°C.
Among the 12 aroma compounds present in the model wine (Table 2), only 5 could be easily
detected by PTR-MS (Table 3). However, only isoamyl acetate and ethyl octanoate could be
unequivocally detected. Although minimized with the PTR-MS conditions used,
fragmentations of protonated molecular ions were not completely absent (Sémon, et al.,
2018). 3-Methylbutan-1-ol (winey-brandy) was followed by its dehydrated protonated
molecular ion [MH+-H2O] at m/z 71.086, which also bore a small contribution from the main
fragment ion of isoamyl acetate; ethyl butanoate (fruity, buttery) was followed by its
protonated molecular ion MH+ at m/z 117.091, which bore a small contribution from the main
12 characterized by its protonated molecular ion MH+ at m/z 131.107; ethyl hexanoate (fruity,
apple) protonated molecular ion MH+ at m/z 145.122 bore a small contribution from the main
fragment ion of ethyl octanoate; and ethyl octanoate (fruity, apricot) itself was unequivocally
followed by its protonated molecular ion MH+ at m/z 173.154 (Table 3). These compounds all
had a concentration higher than or equal to 0.42 mg.L-1.
Nosespace measurements were carried out in triplicate.
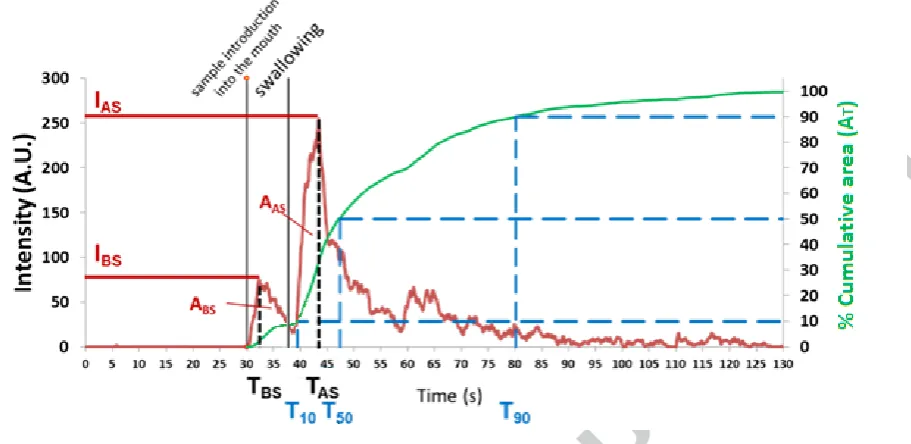
An example of a smoothed release curve in the nosespace of one individual is given in Figure
1 for the ion m/z 71.086. All the release data were calculated from the breath concentration
ncps data, using Microsoft Excel 2010. Ten parameters were extracted from the smoothed
release curves (Boisard et al., 2014): maximal intensity before and after swallowing (IBS and
IAS, respectively), time to reach maximal intensity before and after swallowing (TBS and TAS,
respectively), area under the curve (ABS: area before swallowing; AAS: area after swallowing:
AT: total cumulative area) and time to reach 10% (T10), 50% (T50) and 90% (T90) of AT
(Figure 1).
2.4. Statistical analysis
All statistical analyses were carried out with XLSTAT (2014.1.10).
2.4.1. Analysis of sensory scores
The two sensory evaluation sessions cannot be considered as repetitions of the same
experiment as they were not performed with the same protocol: the presence or absence of the
taste rating was expected to impact the scores for retronasal aroma.
To know if the results could be interpreted separately within condition, we first compared the
13 condition, panelists, sugar concentration and acid concentration as factors (=5%). All
first-order interactions were considered in this ANOVA model.
For the interpretation of each scoring condition separately, a 3-way ANOVA with panelists,
sugar concentration and acid concentration as factors was carried out on retronasal aroma
scores (=5%). All first-order interactions were considered in this ANOVA model.
2.4.2. Analysis of in-mouth release parameters and correlation with sensory scores
Fifty parameters were extracted from the in vivo release curves (5 studied compounds 10
parameters). Due to the high subject variability in these data, the data were standardized for
each subject before being submitted to a 2-way ANOVA with acid concentration and sugar
concentration as factors and including interactions. Given the exploratory nature of this
experiment, the significance level was set at 10% in order not to rule out parameters that
could potentially explain sensory scores from further analysis. Only the variables for which a
significant effect of acid or sugar concentration was observed were kept for the next step and
represented on a Pearson PCA, with nosespace parameters as variables and products as
observations.
Finally, Pearson’s correlation coefficients were calculated, using individual data, between the
median of nosespace parameters (normalized data) and sensory descriptors (raw data). Only
those parameters correlated to at least one sensory descriptor at =0.05 were studied.
3. Results
14 In both scoring conditions, floral aroma assessed by the 33 panelists did not significantly
discriminate the four samples. Only the results related to global intensity of aroma and
intensity of fruity aroma will be further studied.
The comparison of global aroma and fruity aroma obtained in each scoring condition showed
a significant effect of the condition on global intensity of aroma (Pval=0.041). More
interestingly, the scoring condition tended to have different effects on fruity aroma scores
depending on sugar and acid content (Pval (sugar condition) = 0.070 and Pval (acid
condition) = 0.054). Results were thus interpreted within each condition.
Global intensity of aroma and intensity of fruity aroma, assessed by the 33 panelists were
significantly enhanced when the concentration of sugar increased in the model wines, in both
scoring conditions (Figure 2). These effects were also significant when considering only the
subset of 7 panelists. When the 33 panelists assessed only aroma and not taste, there was a
significant panelist sugar interaction on fruity aroma intensity (Pval =0.026). This
interaction was due to the scores of three panelists who did not experience fruity aroma
enhancement by sweetness in this assessment condition, contrary to the other 30 panelists.
When taste was scored before aroma, there was no panelist sugar interaction effect on fruity
aroma intensity, showing that in this assessment condition, the 33 panelists were in
accordance with one another about the impact of sweetness on aroma. In the subset of 7
panelists, all panelists were in accordance about the influence of sugar concentration on fruity
and global aroma intensity, in both conditions of assessment.
When panelists assessed only aroma and not taste, acid concentration had no effect on
fruitiness intensity, nor on the global intensity of aroma, for both panels. With the 33
panelists, there was a significant panelist acid interaction for both aroma scores, (Pval =
15 panelists were not in accordance. Indeed, some of them perceived an aroma enhancement by
sourness, others perceived an aroma decrease by sourness, but the majority of the panelists
perceived the same aroma intensity with the two levels of sourness. When taste was scored
before aroma, acid concentration had a significant effect on fruitiness intensity for the whole
panel and a significant effect on the global intensity of aroma for the subset of 7 panelists.
There was no panelist acid interaction effect on these scores, showing that the level of acid
affected all the panelists in the same way, in this condition.
For the four retronasal aroma scores and for both panels, there was no sugar acid
interaction.
3.2. Relationship between nosespace parameters and tastant composition of matrices
Among the 50 parameters extracted from the nosespace curves, 16 varied significantly with
the concentration of acid and/or sugar in the products. For the 5 studied compounds, AT was
not affected by the concentration of tastants while IBS, ABS, TBS, IAS, AAS, TAS and T10 were.
When a parameter increased significantly with tastants concentration before swallowing, it
tended to decrease significantly with tastants concentration after swallowing (Table S1). This
shows that, while globally equivalent, the release of the aroma compounds was time-shifted
under the effect of tastant concentration.
The 16 parameters varying with tastants concentration were represented in a normalized PCA
(Figure 3). The first two principal components enable 95.6% of explained variance. The first
axis (73.1% of the total variance) opposes nosespace parameters IBS and ABS on the one hand
to IAS, AAS and T10 on the other hand. The two acid concentrations are opposed according to
this dimension. The maximal intensity before swallowing (IBS) significantly increased with
16 3-methylbutan-1-ol, ethyl butanoate, isoamyl acetate and ethyl hexanoate, the four most
volatile aroma compounds in the products. The area under the curves before swallowing (ABS)
followed the same pattern for ions 71.086, 117.091 and 131.107. The parameters before
swallowing should be considered with caution for ion 71.086 (3-Methyl-1-butanol) because
for this ion, the area under the curve before swallowing was negligible (8%) compared to the
global area (before and after swallowing). For ions 117.091, 131.107 and 145.122, ABS
represented respectively 29%, 25% and 27% of the total area.
On the contrary, IAS (for the ions 117.091, 131.107 and 145.122) and AAS (for the ions
117.091 and 131.107), were significantly lower when acid concentration was high. This
means that these volatiles were preferentially released during the in-mouth process than after
swallowing, when acid concentration was high.
T10 significantly decreased for ions 71.086, 117.091 and 131.107 when acid concentration
increased, which means that an increase in acid concentration significantly shortened the time
of release of 3-methylbutan-1-ol, ethyl butanoate and isoamyl acetate. T10 corresponds to the
time at which 10% of the cumulated total area under the curve was reached. It occurred after
swallowing for all the compounds. As no significant effect was observed for the total area
under the release curve, an increase in acid concentration only modifies the dynamic of
release of the volatile compounds.
The second axis of the PCA (22.5% of the total variance) is characterized by 71-T10. This
axis evidences an interaction between sugar and aroma for the time to reach 10% of the
cumulative area of this ion. At first sight, this time seems longer for the product containing
low acid and low sugar concentration and the product containing high sugar and high acid
concentration. But this result has to be taken with caution because 71-T10 may not strongly
contribute to perception. Indeed, for ion 71, T10 occurred just after swallowing and most of
17 173-TAS is opposed to the other parameters on axis 2. 173-TAS increased when sugar
concentration increased. It evidences a delayed release or greater in-mouth duration of ethyl
octanoate when sugar concentration increased. Ethyl octanoate was nearly exclusively
released after swallowing (173-TAS represented 97% of the total area for ion 173.154).
3.3. Relationship between nosespace parameters and sensory results
Among the 17 parameters varying significantly with tastant composition of the products, 7
were significantly correlated to at least one sensory descriptor score (Table 4).
The maximal intensity before swallowing (IBS) of four ions (71.086, 117.091, 131.107 and
145.122) was negatively correlated to the retronasal aroma assessed when taste was not
scored. As the total amount of aroma released did not vary with the model wine composition,
these correlations mean that when these four volatile compounds were released earlier, the
intensity of global and fruity aroma decreased. Thus, the perceived aroma seems to be
explained more by the amount of aroma released after swallowing, which gives the last
in-mouth sensation.
T10 was positively correlated to global retronasal aroma only when it was assessed after taste
assessment. This correlation was positive for ions 131.107 and 145.122 (isoamyl acetate and
ethyl hexanoate, respectively). This indicates that, when taste and aroma were both assessed,
perceived global intensity of aroma was higher when T10 occurred later, that is when isoamyl
acetate and ethyl hexanoate were released later.
Finally, 173-TAS - the only parameter related to ethyl octanoate release influenced by tastant
composition - was significantly correlated to global and fruity aromas scores obtained when
taste and aroma were assessed. In this condition, when the release of ethyl octanoate
18 4. Discussion
In this study, we aimed to understand the impact of tastants concentration, in vivo aroma
release and sensory assessment conditions on retronasal aroma enhancement by taste. We
compared four wines with exactly the same volatile composition but different concentrations
of tastants by nosespace and sensory analysis. Tartaric acid concentration seemed to have a
low effect on retronasal aroma scores. When acid concentration increased, the subset of seven
panelists perceived a higher global intensity of aroma, but this effect was not significant for
the whole panel (n=33). Instead, the whole panel experienced a significant effect of acid
concentration on fruitiness intensity. As a consequence, we can only consider that acid
concentration tends to increase the perceived aroma, and that this tendency was only observed
when taste was scored. It suggests that dumping effect was not involved in the observed
enhancement, but we would need more information to confirm this.
As in our former study (Arvisenet, et al., 2016), retronasal aroma intensity was significantly
enhanced by sugar, and despite the use of taste and aroma attributes in the same sensory
session, enhancement of aroma by sweet taste occured. This result is consistent with other
studies (Bonnans & Noble, 1993). It suggests that, even if dumping effect occurred, it was
probably not the only factor explaining the observed aroma enhancement by sweetness.
In order to try to understand other reasons for this enhancement, in vivo release and sensory
scores were compared. Correlations were found between perceived aroma and aroma release
parameters. The sensory scores correlated to aroma release parameters before swallowing,
were different from those correlated to aroma release parameters after swallowing. So, these
two steps will be further discussed separately.
19 The increase of acid concentration in the model wines induced an increased in-mouth release
of several compounds (3-methylbutan-1-ol, ethyl butanoate, isoamyl acetate and ethyl
hexanoate) before swallowing. Many studies have shown that volatile compounds release
from a solution can be either increased, decreased, or unchanged by the presence of solutes,
depending on the nature of volatile compounds and solutes (Buettner & Beauchamp, 2010;
Hewson, Hollowood, Chandra, & Hort, 2008). Indeed, the presence and the concentration of
tastants can affect the partition properties of volatile compounds, by changing volatility, water
activity, etc. Little modification of the headspace concentration at equilibrium was observed
for these volatile compounds as a function of model wine composition (Arvisenet et al.,
2016), suggesting negligible effect of the acid concentration on the partition coefficients.
However this experiment was realized without addition of saliva. Neyraud et al. (2009)
demonstrated that stimulations with increasing amounts of acid induced an increase in the
salivary flow rate and in the total amount of proteins in saliva due to a parotid secretion. As
the saliva composition differs between whole saliva and parotid saliva, the increase rate of
release could thus be explained by a modification of the salivary protein composition, which
could induce a different binding behavior between the volatile compounds and the proteins.
In our study, this increased aroma input before swallowing seems not to have been perceived
by panelists. Indeed, when both taste and aroma were assessed, none of the aroma intensity
scores correlated with the parameters of release of the studied aroma compounds. When
panelists were required to assess only aroma, global intensity of aroma was paradoxically
negatively correlated to IBS, which demonstrates that panelists did not perceive the increase of
the odorant stimulus in this test condition either. This negative correlation is difficult to
explain. Our hypothesis is that a stronger concomitant phenomenon may have occurred,
which provoked a decrease of perceived aroma simultaneously with the acid increase. It can
20 concentration provoked an impression of a drop in sweetness, because of the well-known
sourness-sweetness perceptual interaction (Bonnans & Noble, 1993). Confusion between
“more acid” and “less sweet” was all the more likely to occur when panelists did not have to
score taste. In this sensory test condition, a decrease in perceived sweetness may have, in turn,
provoked a decrease in retronasal aroma enhancement by sweetness. This is consistent with
the high aroma enhancement by sweetness observed in the studied matrices, and with
previous studies which showed that aroma enhancement by sweetness can be instruction
dependent (Frank, 2002). This tentative explanation would need to be confirmed, and results
should be considered with caution, as there is no evidence that the parameters measured
before swallowing are relevant, especially with a liquid.
4.2. Effect of tastants on perceived aroma after swallowing
In vivo release parameters after swallowing were affected by acid or sugar concentrations.
When acid concentration decreased, isoamyl acetate and ethyl hexanoate were released later,
as suggested by the negative correlation between T10 of these compounds and acid
concentration. But the influence of acid concentration and T10 on the global intensity of aroma
was similar. This contradictory result could mean that there is little effect of acid
concentration on aroma perception. This is in line with the results obtained with the group of
33 panelists, whose global intensity scores of aroma did not depend on acid concentration.
When sugar concentration increased, the after-swallowing intensity peak for ethyl octanoate
occurred later, as shown by the positive correlation between sugar concentration and TAS of
ethyl octanoate. This later release of ethyl octanoate seems to have been perceived by
panelists only when they were asked to assess taste and aroma. One tentative explanation is
21 Volpe, Picone, & Cavella, 2014; Reyes, Castura, & Hayes, 2017). As a consequence, the later
the aroma compounds are released after swallowing, the less taste and aroma percepts may
overlap. In our study, when panelists were asked to score taste and aroma, they are supposed
to have paid more attention to the differences between these two percepts. Indeed, the
conditions of the tests and the order of presentation of scales - corresponding to the
temporality of perceptions of taste, first, and then aroma – were meant to help panelists to
distinguish between taste and aroma. In these conditions, when the aroma intensity peak
occurred later, panelists probably better noticed taste decline and it helped them to better
distinguish aroma and taste. In this situation, panelists seem to have taken into account more
the time of release than the intensity of release in their intensity score. This result was not
observed when the sensory test instructions were to score only aroma. One tentative
explanation is that, when panelists were only required to assess aroma (and not required to
assess taste), they may have considered the flavor as a whole in their aroma score. As a result,
not only did aroma intensity increase with sugar concentration, but it was also not correlated
to aroma compounds release. These results show that trained panelists understand the
conceptual difference between taste and aroma. Nevertheless, their aroma scores are highly
correlated to sugar concentration. These scores depend on aroma release parameters only
when aroma release and taste perception are likely to be less overlapped (i.e. after
swallowing). It tends to prove that even when attempting to analyze the components of the
flavor, panelists were not able to disentangle unitary percepts when those occurred
simultaneously.
4.3. Strengths and limitations
To our knowledge, this study was the first attempt to understand thanks to the measurement of
22 descriptor. It was also the first study to show the contribution of temporal sequence of aroma
release to multimodal perception. Because the global release of aroma compounds was not
changed by the concentration of tastants, the previous use of a static method, in Arvisenet et
al. (2016) suggested negligible physicochemical interactions. The use of dynamic in vivo
release measurement showed that, whereas tastants did not affect global aroma release in
terms of intensity, they rather changed aroma release temporality. Swallowing was shown to
play key role in this temporality. One strength of this study was thus to follow the dynamic
in-mouth release of aroma compounds from alcoholic beverages in real-time, via nosespace
analysis. Thanks to this novel approach (Sémon, et al., 2018) it was possible to compare, in
this category of products, the release of volatile compounds and the aroma perception.
Some potential limitations related to our experimental setting should be mentioned. Despite
the small number of samples of our study, a clear pattern emerged for the effect of sugar on
aroma perception. But it would be interesting to confirm the effect of acid on aroma
perception with a larger range of concentrations. For the purpose of our study, it was
necessary that the same panelists performed both sensory analyses and dynamic
measurements of in vivo release of aroma compounds. While the number of panelists was
usual for nosespace experiments (Arancibia, Castro, Jublot, Costell, & Bayarri, 2015; Heenan
et al., 2012; Tyapkova et al., 2014), it may be considered to be low for sensory analysis. But
the seven panelists who performed both sensory and nosespace analyses were selected among
a larger group, on the basis of their accordance with the results of this group.
Dynamic sensory measurements are particularly interesting when it comes to the comparison
with aroma release. Time-intensity (TI) was inapplicable in our study, because assessment of
several attributes in the same session was required in the second session. Dynamic
23 purpose of the present study. Temporal Dominance of Sensations (TDS) focuses on the
dominant attributes rather than on the intensity of each individual attribute over time, and it is
difficult to relate TDS results and dynamic aroma release (Deleris et al., 2011). Temporal
Check-all-that-apply (T-CATA), based on the frequency of detection of attributes over time,
does not either provides a score for each attribute perceived on the products (Castura,
Antunez, Gimenez, & Ares, 2016; Pineau et al., 2009). Multi-attributes time intensity and
progressive profiling provide discontinuous data collection and are not well adapted to the
scoring of products with short consumption time span.
Of all the volatile compounds of the studied model wines, it seemed surprising that only ethyl
octanoate release was correlated to the aroma perception. Many reasons can explain the high
contribution of this compound to perceived aroma. First, ethyl octanoate was the least volatile
compound among those that were followed by nosespace. The consequence of that was that
its release was the most delayed, and thus, it was the least overlapped with taste percept.
Secondly, ethyl octanoate had by far the highest OAV compared to the other compounds of
the studied model wine (odor activity value, calculated with odor perception thresholds in
water/ethanol, 90/10, w/w) (Arvisenet, et al., 2016; Guth, 1997). The other compounds in this
study had very low OAVs compared to ethyl octanoate: between six and 160 times smaller
(for isoamyl acetate and 3-methylbutan-1-ol, respectively). Nevertheless, this explanation
should be considered with caution, since the perception of volatile compounds in a mixture
does not depend only on their OAV, but also on Stevens’ law exponents of each compound
and on the composition of the mixture, due to odor-odor sensory interactions. Psychophysical
functions were shown to vary with intra-modal interactions (Grosch, 2001). In addition, odor
perception in a mixture is not the addition of the contributions of the different odorants: as an
24 to identify the contribution of each compound to the perceived odor (Thomas-Danguin et al.,
2014). Methodological development is still needed before being able to fully understand the
contribution of each compound to perception.
5. Conclusion
We showed that despite their intensive training, panelists are still sensitive to dumping effect.
Even when the test conditions allowed limiting the dumping effect, panelists were not able to
completely dissociate aroma from the congruent taste perceived simultaneously. These results
point out the limit of descriptive sensory tests: even for a well-trained panel, it seems difficult
to evaluate independently every component of the flavor.
Our results suggest that trained panelists are able to distinguish between the concepts of
retronasal aroma and taste, and that the post-swallowing decrease of taste resulted in more
accurate aroma assessment (i.e. more correlated to aroma release). The high contribution of
swallowing in perception was showed, but more work is needed to better understand the role
of tastants on the aroma release over time and how panelists integrate changes of temporal
aroma release.
Acknowledgements
This work received financial support from the CSGA. The authors thank Damien Laurent,
Thibaut Potiquet and Marine Vigneron for their help in carrying out the experiments.
The authors are grateful to the reviewers for their constructive feedback, which highly
25 References
Arancibia, C., Castro, C., Jublot, L., Costell, E., & Bayarri, S. (2015). Colour, rheology, flavour release and sensory perception of dairy desserts. Influence of thickener and fat content. Lwt-Food Science and Technology, 62(1), 408-416.
Arvisenet, G., Guichard, E., & Ballester, J. (2016). Taste-aroma interaction in model wines: Effect of training and expertise. Food Quality and Preference 52, 211-221.
Boisard, L., Tournier, C., Semon, E., Noirot, E., Guichard, E., & Salles, C. (2014). Salt and fat contents influence the microstructure of model cheeses, chewing/swallowing and in vivo aroma release. Flavour and Fragrance Journal, 29(2), 95-106.
Bonnans, S., & Noble, A. C. (1993). Effect of sweetener type and of sweetener and acid levels on temporal perception of sweetness, sourness and fruitiness. Chemical Senses, 18(3), 273-283.
Buettner, A., & Beauchamp, J. (2010). Chemical input - Sensory output: Diverse modes of physiology - flavour interaction. Food Quality and Preference, 21(8), 915-924.
Castura, J. C., Antunez, L., Gimenez, A., & Ares, G. (2016). Temporal Check-All-That-Apply (TCATA): A novel dynamic method for characterizing products. Food Quality and Preference, 47, 79-90.
Chrea, C., Valentin, D., Sulmont-Rosse, C., Nguyen, D. H., & Abdi, H. (2005). Semantic, typicality and odor representation: A cross-cultural study. Chemical Senses, 30(1), 37-49.
Clark, C. C., & Lawless, H. T. (1994). Limiting response alternatives in time-intensity scaling - an examination of the halo-dumping effect. Chemical Senses, 19(6), 583-594.
Dalton, P., Doolittle, N., Nagata, H., & Breslin, P. A. S. (2000). The merging of the senses: Integration of subthreshold taste and smell. Nature Neuroscience, 3, 431-432.
Davidson, J. M., Linforth, R. S. T., Hollowood, T. A., & Taylor, A. J. (1999). Effect of sucrose on the perceived flavor intensity of chewing gum. Journal of Agricultural and Food Chemistry, 47(10), 4336-4340.
Deleris, I., Saint-Eve, A., Guo, Y. L., Lieben, P., Cypriani, M. L., Jacquet, N., Brunerie, P., & Souchon, I. (2011). Impact of Swallowing on the Dynamics of Aroma Release and Perception during the Consumption of Alcoholic Beverages. Chemical Senses, 36(8), 701-713.
Frank, R. A. (2002). Response context affects judgments of flavor components in foods and beverages. Food Quality and Preference, 14(2), 139-145.
Frank, R. A., van Der Klaauw, N. J., & Schifferstein, H. N. J. (1993). Both perceptual and conceptual factors influence taste-odor and taste-taste interactions. Perception & Psychophysics, 54(3), 343-354.
Frank, R. A., Wessel, N., & Shaffer, G. (1990). The enhancement of sweetness by strawberry odor is instruction-dependent Chemical Senses, 15, 576-577.
Fujimaru, T., & Lim, J. (2013). Effects of stimulus intensity on odor enhancement by taste.
Chemosensory Perception, 6, 1-7.
Green, B. G., Nachtigal, D., Hammond, S., & Lim, J. (2012). Enhancement of retronasal odors by taste. Chemical Senses, 37, 77–86.
Grosch, W. (2001). Evaluation of the Key Odorants of Foods by Dilution Experiments, Aroma Models and Omission. Chemical Senses, 26(5), 533-545.
26 Heenan, S., Soukoulis, C., Silcock, P., Fabris, A., Aprea, E., Cappellin, L., Mark, T. D.,
Gasperi, F., & Biasioli, F. (2012). PTR-TOF-MS monitoring of in vitro and in vivo flavour release in cereal bars with varying sugar composition. Food Chemistry, 131(2), 477-484.
Hewson, L., Hollowood, T., Chandra, S., & Hort, J. (2008). Taste - aroma interactions in a citrus flavoured model beverage system: Similarities and differences between acid and sugar type. Food Quality and Preference, 19(3), 323-334.
Hort, J., & Hollowood, T. A. (2004). Controlled continuous flow delivery system for investigating taste-aroma interactions. Journal of Agricultural and Food Chemistry, 52(15), 4834-4843.
King, B. M., Arents, P., Bouter, N., Duineveld, C. A. A., Meyners, M., Schroff, S. I., & Soekhai, S. T. (2006). Sweetener/sweetness-induced changes in flavor perception and flavor release of fruity and green character in beverages. Journal of Agricultural and Food Chemistry, 54(7), 2671-2677.
Lethuaut, L., Brossard, C., Meynier, A., Rousseau, F., Llamas, G., Bousseau, B., & Genot, C. (2005). Sweetness and aroma perceptions in dairy desserts varying in sucrose and aroma levels and in textural agent. International Dairy Journal, 15(5), 485-493. Lim, J., Fujimaru, T., & Linscott, T. D. (2014). The role of congruency in taste - odor
interactions. Food Quality and Preference, 34(0), 5-13.
Monaco, R., Miele, N. A., Volpe, S., Picone, D., & Cavella, S. (2014). Temporal sweetness profile of MNEI and comparison with commercial sweeteners. Journal of Sensory Studies, 29(6), 385-394.
Neyraud, E., Heinzerling, C. I., Bult, J. H. F., Mesmin, C., & Dransfield, E. (2009). Effects of Different Tastants on Parotid Saliva Flow and Composition. Chemosensory Perception, 2(2), 108-116.
Ong, P. K. C., & Acree, T. E. (1999). Similarities in the aroma chemistry of Gewurztraminer variety wines and lychee (Litchi chinesis Sonn.) fruit. Journal of Agricultural and Food Chemistry, 47(2), 665-670.
Petit, C. E. F., Hollowood, T. A., Wulfert, F., & Hort, J. (2007). Colour-coolant-aroma interactions and the impact of congruency and exposure on flavour perception. Food Quality and Preference, 18(6), 880-889.
Pfeiffer, J. C., Hollowood, T. A., Hort, J., & Taylor, A. J. (2005). Temporal synchrony and integration of sub-threshold taste and smell signals. Chemical Senses, 30(7), 539-545. Piccone, P., Lonzarich, V., Navarini, L., Fusella, G., & Pittia, P. (2012). Effect of sugars on
liquid-vapour partition of volatile compounds in ready-to-drink coffee beverages.
Journal of Mass Spectrometry, 47(9), 1120-1131.
Pineau, N., Schlich, P., Cordelle, S., Mathonnière, C., Issanchou, S., Imbert, A., Rogeaux, M., Etiévant, P., & Köster, E. (2009). Temporal Dominance of Sensations: Construction of the TDS curves and comparison with time–intensity. Food Quality and Preference, 20(6), 450-455.
Prescott, J. (2012). Chemosensory learning and flavour: Perception, preference and intake.
Physiology & Behavior, 107(4), 553-559.
Rabe, S., Krings, U., & Berger, R. G. (2003). Dynamic flavor release from sucrose solutions.
Journal of Agricultural and Food Chemistry, 51(17), 5058-5066.
Reyes, M. M., Castura, J. C., & Hayes, J. E. (2017). Characterizing dynamic sensory properties of nutritive and nonnutritive sweeteners with temporal check-all-that-apply.
Journal of Sensory Studies, 32(3).
27 Mottram (Eds.), Flavour Science: Proceedings of the XIV Weurman Flavour Research Symposium (pp. 327-332). Leicestershire (United Kingdom): Context Products Ltd. Sémon, E., Arvisenet, G., Guichard, E., & Le-Quéré, J.-L. (2018). Modified Proton Transfer
Reaction Mass Spectrometry (PTR-MS) operating conditions for in vitro and in vivo analysis of wine aroma. Journal of Mass Spectrometry, 53, 65–77.
Small, D. M. (2012). Flavor is in the brain. Physiology & Behavior, 107(4), 540-552.
Small, D. M., & Prescott, J. (2005). Odor/taste integration and the perception of flavor.
Experimental Brain Research, 166(3-4), 345-357.
Spence, C., Smith, B., & Auvray, M. (2015). Confusing Tastes with Flavours. In M. M. Dustin Stokes, Stephen Briggs (Ed.), Perception and Its Modalities (pp. 247-276): Oxford University Press.
Stevenson, R. J. (2001). Is sweetness taste enhancement cognitively impenetrable? Effects of exposure, training and knowledge. Appetite, 36(3), 241-242.
Stevenson, R. J. (2016). Attention and flavor binding. In B. Piqueras-Fiszman & C. Spence (Eds.), Multisensory flavor perception: From fundamental neuroscience through to the marketplace (pp. 16-35). Duxford (UK): Woodhead Publishing Limited.
Thomas-Danguin, T., Sinding, C., Romagny, S., El Mountassir, F., Atanasova, B., Le Berre, E., Le Bon, A. M., & Coureaud, G. (2014). The perception of odor objects in everyday life: a review on the processing of odor mixtures. [Review]. Frontiers in Psychology, 5.
Tournier, C., Sulmont-Rosse, C., Semon, E., Issanchou, S., & Guichard, E. (2009). A study on texture - taste - aroma interactions: physico-chemical and cognitive mechanisms.
International Dairy Journal, 19(8), 450-458.
Tyapkova, O., Bader-Mittermaier, S., Schweiggert-Weisz, U., Wurzinger, S., Beauchamp, J., & Buettner, A. (2014). Characterisation of flavour-texture interactions in sugar-free and sugar-containing pectin gels. Food Research International, 55, 336-346.
van der Klaauw, N. J., & Frank, R. A. (1996). Scaling component intensities of complex stimuli: The influence of response alternatives. Environment International, 22(1), 21-31.
28 Figure 1. Extraction of parameters from nosespace curves. Example of a smoothed in vivo release curve for the ion m/z 71.086
Maximal intensity before swallowing (IBS) and after swallowing (IAS), time to reach maximal
intensity before swallowing (TBS) and after swallowing (TAS), area under the curve before
swallowing (ABS) and after swallowing (AAS), and time to reach 10% (T10), 50% (T50) and
[image:29.595.70.526.77.299.2]
29
Fruity aroma, Assessment of aroma only
Global
intensity of aroma, Assessment of aroma only
Fruity aroma, Assessment of taste and aroma
Global
31 Figure captions
Figure 1. Extraction of parameters from nosespace curves. Example of a smoothed in vivo
release curve for the ion m/z 71.086
Figure 2. Mean retronasal aroma scores (and standard errors) given to model wines with different sugar and acid concentrations by the two panels (for model wine codes, see Table 1)
Figure 3. Factorial map (axes 1 and 2) of PCA for nosespace of model wines: (a) correlation plot showing the parameters of release curves correlated with tastants concentrations of model wines; (b) products plot.
[image:33.595.64.524.120.560.2]
32 Table 1. Non-volatile compound composition (g.L-1) and pH in the model wine solutions
Compound (purity)
Model wine code
S-A- S-A+ S+A- S+A+
Ethanol (96%) --- 80.0 ---
Glycerol (87%) --- 8.5 ---
Glucose (100%) 1.7 1.7 26.7 26.7
Fructose (100%) 3.3 3.3 53.3 53.3
Tartaric acid (100%) 2.5 5 2.5 5
Acetic acid (99%) --- 0.3 ---
Sulfur dioxide (5%) --- 0.6 ---
pH 2.91 2.29 2.88 2.31
--- x --- means that the concentration of the corresponding compound was the same, x,
[image:34.595.82.583.88.459.2]
33 Table 2. Aroma compounds in the model wine solutions and their properties
Compound Formula Molar mass logP
a
Odor descriptionb
Concentration in model wine
(mg.L-1)
Odor threshold (mg.L-1) in water/ethanol
(90/10 w/w)c
Acetaldehyde C2H4O 44.05 -0.17 Pungent, breathtaking 0.94 0.5
2-Methylpropan-1-ol C4H10O 74.12 0.77 Sweet, sweaty-chemical,
whiskey-like
16 40
3-Methylbutan-1-ol C5H12O 88.15 1.26 Alcoholic, winey-brandy 95.2 30
Ethyl butanoate C6H12O2 116.16 1.85 Ethereal, fruity odor, buttery, ripe
fruit
0.42 0.02
2-Phenylethanol C8H10O 122.16 1.57 Floral, rose, floral 24.2 10
Isoamyl acetate C7H14O2 130.18 2.26 Sweet, fruity, banana, pear 2.54 0.03
Ethyl hexanoate C8H16O2 144.21 2.83 Fruity, winey odor; apple, banana,
pineapple
1.02 0.005
Linalool C10H18O 154.25 3.38 Floral-woody odor with faint citrus
note, sweet floral
0.36 0.015
cis-Rose oxide C10H18O 154.25 3.58 Metallic, grassy-green, geranium 0.042 0.0002
Ethyl octanoate C10H20O2 172.27 3.81 Fruity, winey, sweet odor,
cognac-apricot
1.02 0.002
-Damascenone C13H18O 190.28 4.21 Fruity-floral with apple-plum-raisin,
tea, rose, tobacco
0.008 0.00005
Ethyl decanoated C12H24O2 200.32 4.79 Sweet, fatty, nut-like, winey-cognac
odor
0.027 0.2
a: EpiSuite 4.1 software
b: Flavorbase (http://www.leffingwell.com/flavbase.htm)
34 Table 3. Volatile compounds detected by PTR-MS and m/z of their respective main protonated ion
Compound m/z Fragment
3-Methylbutan-1-ol 71.086 (MH-H2O)+
Ethyl butanoate 117.091 MH+
Isoamyl acetate 131.107 MH+
Ethyl hexanoate 145.122 MH+
[image:35.595.58.541.98.763.2][image:36.595.72.529.128.290.2]
35 Table 4. Pearson’s correlation coefficients between sensory scores and nosespace parameters
Parameter
occurrence Parameter
Evolution of parameter with
[tastant]
Correlation between nosespace parameter and retronasal aroma descriptors*
Global intensity aroma scoring only Fruitiness intensity aroma scoring only Global intensity taste + aroma
scoring
Fruitiness intensity taste + aroma
scoring
Before swallowing
71-IBS when [acid] -0.389 -0.379 -0.015 -0.166
117-IBS when [acid] -0.407 -0.320 -0.189 -0.209
131-IBS when [acid] -0.392 -0.328 -0.132 -0.145
145-IBS when [acid] -0.402 -0.341 -0.207 -0.253
At T10 131-T10
when [acid] -0.103 -0.136 0.447 0.216 145-T10 when [acid] -0.031 -0.046 0.506 0.233
After 1st swallow 173-TAS when [sugar] 0.253 0.364 0.413 0.636
36 Highlights
Aroma was enhanced by sweetness in model wines