THE THIRTEENTH DATA RELEASE OF THE SLOAN DIGITAL SKY SURVEY: FIRST SPECTROSCOPIC DATA FROM THE SDSS-IV SURVEY MAPPING NEARBY GALAXIES AT APACHE POINT OBSERVATORY
Franco D. Albareti1,2,3, Carlos Allende Prieto4,5, Andres Almeida6, Friedrich Anders7, Scott Anderson8, Brett H. Andrews9, Alfonso Arag´on-Salamanca10, Maria Argudo-Fern´andez11,12, Eric Armengaud13,
Eric Aubourg14, Vladimir Avila-Reese15, Carles Badenes9, Stephen Bailey16, Beatriz Barbuy17,18, Kat Barger19, Jorge Barrera-Ballesteros20, Curtis Bartosz8, Sarbani Basu21, Dominic Bates22, Giuseppina Battaglia4,5, Falk Baumgarten7,23, Julien Baur13, Julian Bautista24, Timothy C. Beers25,
Francesco Belfiore26,27, Matthew Bershady28, Sara Bertran de Lis4,5, Jonathan C. Bird29,
Dmitry Bizyaev30,31,32, Guillermo A. Blanc33,34,35, Michael Blanton36, Michael Blomqvist37, Adam S. Bolton38,24, J. Borissova39,40, Jo Bovy41,42, William Nielsen Brandt43,44,45, Jonathan Brinkmann30, Joel R. Brownstein24, Kevin Bundy46, Etienne Burtin13, Nicol´as G. Busca14, Hugo Orlando Camacho Chavez47,18, M. Cano D´ıaz15,
Michele Cappellari48, Ricardo Carrera4,5, Yanping Chen49, Brian Cherinka20, Edmond Cheung46, Cristina Chiappini7, Drew Chojnowski31, Chia-Hsun Chuang7, Haeun Chung50, Rafael Fernando Cirolini51,18,
Nicolas Clerc52, Roger E. Cohen53, Julia M. Comerford54, Johan Comparat1,2, Janaina Correa do Nascimento55,18, Marie-Claude Cousinou56, Kevin Covey57, Jeffrey D. Crane33, Rupert Croft58, Katia Cunha59,
Jeremy Darling54, James W. Davidson Jr.60, Kyle Dawson24, Luiz Da Costa18,59, Gabriele Da Silva Ilha51,18, Alice Deconto Machado51,18, Timoth´ee Delubac61, Nathan De Lee62,29, Axel De la Macorra15, Sylvain De la Torre37, Aleksandar M. Diamond-Stanic28, John Donor19, Juan Jose Downes15,63, Niv Drory64,
Cheng Du65, H´elion Du Mas des Bourboux13, Tom Dwelly52, Garrett Ebelke60, Arthur Eigenbrot28, Daniel J. Eisenstein66, Yvonne P. Elsworth67,68, Eric Emsellem69,70, Michael Eracleous43,44, Stephanie Escoffier56, Michael L. Evans8, Jes´us Falc´on-Barroso4,5, Xiaohui Fan71, Ginevra Favole1,2,
Emma Fernandez-Alvar15, J. G. Fernandez-Trincado72, Diane Feuillet31, Scott W. Fleming73,74, Andreu Font-Ribera16,46, Gordon Freischlad30,31, Peter Frinchaboy19, Hai Fu75, Yang Gao (高扬)12, Rafael A. Garcia76, R. Garcia-Dias4,5, D. A. Garcia-Hern´andez4,5, Ana E. Garcia P´erez4,5, Patrick Gaulme30,31,
Junqiang Ge77, Douglas Geisler53, Bruce Gillespie20, Hector Gil Marin78,79, L´eo Girardi80,18, Daniel Goddard81, Yilen Gomez Maqueo Chew15, Violeta Gonzalez-Perez81, Kathleen Grabowski30,31,
Paul Green66, Catherine J. Grier43,44, Thomas Grier19,82, Hong Guo12, Julien Guy83, Alex Hagen43,44, Matt Hall60, Paul Harding84, R. E. Harley57, Sten Hasselquist31, Suzanne Hawley8, Christian R. Hayes60,
Fred Hearty43, Saskia Hekker85, Hector Hernandez Toledo15, Shirley Ho58,16, David W. Hogg36, Kelly Holley-Bockelmann29, Jon A. Holtzman31, Parker H. Holzer24, Jian Hu (胡剑)64, Daniel Huber86,87,68, Timothy Alan Hutchinson24, Ho Seong Hwang50, H´ector J. Ibarra-Medel15, Inese I. Ivans24, KeShawn Ivory19,88,
Kurt Jaehnig28, Trey W. Jensen24, Jennifer A. Johnson89,90, Amy Jones91, Eric Jullo37, T. Kallinger92, Karen Kinemuchi30,31, David Kirkby93, Mark Klaene30, Jean-Paul Kneib61, Juna A. Kollmeier33, Ivan Lacerna94,
Richard R. Lane94, Dustin Lang42, Pierre Laurent13, David R. Law73, Alexie Leauthaud46,
Jean-Marc Le Goff13, Chen Li12, Cheng Li12,65, Niu Li65, Ran Li77, Fu-Heng Liang (梁赋珩)64, Yu Liang65, Marcos Lima47,18, Lihwai Lin (林俐暉)94, Lin Lin (林琳)12, Yen-Ting Lin (林彥廷)94, Chao Liu77, Dan Long30, Sara Lucatello80, Nicholas MacDonald8, Chelsea L. MacLeod66, J. Ted Mackereth96, Suvrath Mahadevan43,
Marcio Antonio Geimba Maia18,59, Roberto Maiolino26,27, Steven R. Majewski60, Olena Malanushenko30,31, Viktor Malanushenko30,31, N´ıcolas Dullius Mallmann55,18, Arturo Manchado4,5,97, Claudia Maraston81, Rui Marques-Chaves4,5, Inma Martinez Valpuesta4,5, Karen L. Masters81, Savita Mathur98, Ian D. McGreer71,
Andrea Merloni52, Michael R. Merrifield10, Szabolcs Mesz´aros99, Andres Meza100, Andrea Miglio67, Ivan Minchev7, Karan Molaverdikhani54,101, Antonio D. Montero-Dorta24, Benoit Mosser102, Demitri Muna89,90,
Adam Myers103, Preethi Nair104, Kirpal Nandra52, Melissa Ness101, Jeffrey A. Newman9, Robert C. Nichol81, David L. Nidever71, Christian Nitschelm11, Julia O’Connell19, Audrey Oravetz30,31, Daniel J. Oravetz30,31,
Zachary Pace28, Nelson Padilla94, Nathalie Palanque-Delabrouille13, Kaike Pan30,31, John Parejko8, Isabelle Paris37, Changbom Park50, John A. Peacock105, Sebastien Peirani106,46, Marcos Pellejero-Ibanez4,5, Samantha Penny81, Will J. Percival81, Jeffrey W. Percival28, Ismael Perez-Fournon4,5, Patrick Petitjean106,
Matthew Pieri37, Marc H. Pinsonneault89, Alice Pisani56,106, Francisco Prada1,2,107, Abhishek Prakash9, Natalie Price-Jones42, M. Jordan Raddick20, Mubdi Rahman20, Anand Raichoor13,
Sandro Barboza Rembold51,18, A. M. Reyna57, James Rich13, Hannah Richstein19, Jethro Ridl52, Rogemar A. Riffel51,18, Rog´erio Riffel55,18, Hans-Walter Rix101, Annie C. Robin72, Constance M. Rockosi108,
Sergio Rodr´ıguez-Torres1, Tha´ıse S. Rodrigues80,109,18, Natalie Roe16, A. Roman Lopes110, Carlos Rom´an-Z´u˜niga111, Ashley J. Ross90, Graziano Rossi112, John Ruan8, Rossana Ruggeri81,
Jessie C. Runnoe43,44, Salvador Salazar-Albornoz52, Mara Salvato52, Sebastian F. Sanchez15, Ariel G. Sanchez52, Jos´e R. Sanchez-Gallego8, Bas´ılio Xavier Santiago55,18, Ricardo Schiavon96,
Jaderson S. Schimoia55,18, Eddie Schlafly16,113, David J. Schlegel16, Donald P. Schneider43,44, Ralph Sch¨onrich48, Mathias Schultheis114, Axel Schwope7, Hee-Jong Seo115, Aldo Serenelli116, Branimir Sesar101, Zhengyi Shao12, Matthew Shetrone117, Michael Shull54, Victor Silva Aguirre68, M. F. Skrutskie60, Anˇze Slosar118, Michael Smith28, Verne V. Smith119, Jennifer Sobeck60, Garrett Somers89,29,
Diogo Souto59, David V. Stark46, Keivan G. Stassun29, Matthias Steinmetz7, Dennis Stello86,120, Thaisa Storchi Bergmann55,18, Michael A. Strauss121, Alina Streblyanska4,5, Guy S. Stringfellow54, Genaro Suarez111, Jing Sun19, Manuchehr Taghizadeh-Popp20, Baitian Tang53, Charling Tao65,56, Jamie Tayar89,
Mita Tembe60, Daniel Thomas81, Jeremy Tinker36, Rita Tojeiro22, Christy Tremonti28, Nicholas Troup60, Jonathan R. Trump43,113, Eduardo Unda-Sanzana11, O. Valenzuela15, Remco Van den Bosch101,
Mariana Vargas-Maga˜na122, Jose Alberto Vazquez118, Sandro Villanova53, M. Vivek24, Nicole Vogt31, David Wake123,124, Rene Walterbos31, Yuting Wang77,81, Enci Wang12, Benjamin Alan Weaver36, Anne-Marie Weijmans22, David H. Weinberg89,90, Kyle B. Westfall81, David G. Whelan125, Eric Wilcots28, Vivienne Wild22, Rob A. Williams96, John Wilson60, W. M. Wood-Vasey9, Dominika Wylezalek20, Ting Xiao (肖
婷)12, Renbin Yan126, Meng Yang65, Jason E. Ybarra111,127, Christophe Yeche13, Fang-Ting Yuan12, Nadia Zakamska20, Olga Zamora4,5, Gail Zasowski20, Kai Zhang126, Cheng Zhao65, Gong-Bo Zhao77,81,
Zheng Zheng77, Zheng Zheng24, Zhi-Min Zhou77, Guangtun Zhu20,113, Joel C. Zinn89, Hu Zou77 Draft version September 26, 2017
Abstract
The fourth generation of the Sloan Digital Sky Survey (SDSS-IV) began observations in July 2014. It pursues three core programs: the Apache Point Observatory Galactic Evolution Experiment 2 (APOGEE-2), Mapping Nearby Galaxies at APO (MaNGA), and the Extended Baryon Oscillation Spectroscopic Survey (eBOSS). As well as its core program, eBOSS contains two major subprograms: the Time Domain Spectroscopic Survey (TDSS) and the SPectroscopic IDentification of ERosita Sources (SPIDERS). This paper describes the first data release from SDSS-IV, Data Release 13 (DR13). DR13 makes publicly available the first 1390 spatially resolved integral field unit obser-vations of nearby galaxies from MaNGA. It includes new obserobser-vations from eBOSS, completing the Sloan Extended QUasar, Emission-line galaxy, Luminous red galaxy Survey (SEQUELS), which also targeted variability-selected objects and X-ray selected objects. DR13 includes new reductions of the SDSS-III BOSS data, improving the spectrophotometric calibration and redshift classification, and new reductions of the SDSS-III APOGEE-1 data, improving stellar parameters for dwarf stars and cooler stars. DR13 provides more robust and precise photometric calibrations. Value-added target catalogs relevant for eBOSS, TDSS, and SPIDERS and an updated red-clump catalog for APOGEE are also available. This paper describes the location and format of the data and provides references to important technical papers. The SDSS website, www.sdss.org, provides links to the data, tutori-als, examples of data access, and extensive documentation of the reduction and analysis procedures. DR13 is the first of a scheduled set that will contain new data and analyses from the planned∼6-year operations of SDSS-IV.
Subject headings: Atlases — Catalogs — Surveys
1Instituto de F´ısica Te´orica, (UAM/CSIC), Universidad Aut´onoma de Madrid, Cantoblanco, E-28049 Madrid, Spain
2Campus of International Excellence UAM+CSIC, Canto-blanco, E-28049 Madrid, Spain
3la Caixa-Severo Ochoa Scholar
4Instituto de Astrof´ısica de Canarias, E-38205 La Laguna, Tenerife, Spain
5Departamento de Astrof´ısica, Universidad de La Laguna (ULL), E-38206 La Laguna, Tenerife, Spain
6Instituto de Investigaci´on Multidisciplinario en Ciencia y Tecnolog´ıa, Universidad de La Serena, Benavente 980, La Serena, Chile
7Leibniz-Institut fuer Astrophysik Potsdam (AIP), An der Sternwarte 16, D-14482 Potsdam, Germany
8Department of Astronomy, University of Washington, Box 351580, Seattle, WA 98195, USA
9PITT PACC, Department of Physics and Astronomy, University of Pittsburgh, Pittsburgh, PA 15260, USA
10School of Physics and Astronomy, University of Notting-ham, University Park, NottingNotting-ham, NG7 2RD, UK
11Unidad de Astronom´ıa, Universidad de Antofagasta, Avenida Angamos 601, Antofagasta 1270300, Chile
12Shanghai Astronomical Observatory, Chinese Academy of Science, 80 Nandan Road, Shanghai 200030, P. R. China
13IRFU, CEA, Centre d’Etudes Saclay, 91191 Gif-Sur-Yvette Cedex, France
14APC, University of Paris Diderot, CNRS/IN2P3, CEA/IRFU, Observatoire de Paris, Sorbonne Paris Cite, France
15Instituto de Astronom´ıa, Universidad Nacional Aut´onoma de M´exico, Apartado Postal 70-264, M´exico D.F., 04510 Mexico 16Lawrence Berkeley National Laboratory, 1 Cyclotron Road, Berkeley, CA 94720, USA
17Universidade de S˜ao Paulo, IAG, Rua do Mat˜ao 1226, S˜ao Paulo 05508-900, Brazil
18Laborat´orio Interinstitucional de e-Astronomia - LIneA, Rua Gal. Jos´e Cristino 77, Rio de Janeiro, RJ - 20921-400, Brazil
19Department of Physics & Astronomy, Texas Christian
University, Fort Worth, TX 76129, USA
20Center for Astrophysical Sciences, Department of Physics and Astronomy, Johns Hopkins University, 3400 North Charles Street, Baltimore, MD 21218, USA
21Department of Astronomy, Yale University, 52 Hillhouse Avenue, New Haven, CT 06511, USA
22School of Physics and Astronomy, University of St An-drews, North Haugh, St Andrews KY16 9SS, UK
23Humboldt-Universitat zu Berlin, Institut f¨ur Physik, Newtonstrasse 15,D-12589, Berlin, Germany
24Department of Physics and Astronomy, University of Utah, 115 S. 1400 E., Salt Lake City, UT 84112, USA
25Department of Physics and JINA Center for the Evolution of the Elements, University of Notre Dame, Notre Dame, IN 46556, USA
26Cavendish Laboratory, University of Cambridge, 19 J. J. Thomson Avenue, Cambridge CB3 0HE, UK
27University of Cambridge, Kavli Institute for Cosmology, Cambridge, CB3 0HE, UK
28Department of Astronomy, University of Wisconsin-Madison, 475 N. Charter St., Madison WI 53706, USA
29Department of Physics and Astronomy, Vanderbilt Univer-sity, 6301 Stevenson Center, Nashville, TN, 37235, USA
30Apache Point Observatory, P.O. Box 59, Sunspot, NM 88349, USA
31Department of Astronomy, New Mexico State University, Las Cruces, NM 88003, USA
32Sternberg Astronomical Institute, Moscow State Univer-sity, Moscow 119992, Russia
33Observatories of the Carnegie Institution for Science, 813 Santa Barbara St, Pasadena, CA, 91101, USA
34Departamento de Astronom´ıa, Universidad de Chile, Camino del Observatorio 1515, Las Condes, Santiago, Chile
35Centro de Astrof´ısica y Tecnolog´ıas Afines (CATA), Camino del Observatorio 1515, Las Condes, Santiago, Chile
36Center for Cosmology and Particle Physics, Department of Physics, New York University, New York, NY 10003, USA
d’Astrophysique de Marseille) UMR 7326, F-13388, Marseille, France
38National Optical Astronomy Observatory, 950 N Cherry Ave, Tucson, AZ 85719, USA
39Instituto de F´ısica y Astronom´ıa, Universidad de Val-para´ıso, Av. Gran Breta˜na 1111, Playa, Ancha, Casilla 5030, Chile
40Millennium Institute of Astrophysics (MAS),Monse˜nor Sotero Sanz 100, oficina 104, Providencia, Santiago, Chile
41Department of Astronomy and Astrophysics, University of Toronto, 50 St. George Street, Toronto, ON, M55 3H4, Canada 42Dunlap Institute for Astronomy & Astrophysics, University of Toronto, 50 St. George Street, Toronto, Ontario, M5S 3H4, Canada
43Department of Astronomy and Astrophysics, Eberly Col-lege of Science, The Pennsylvania State University, 525 Davey Laboratory, University Park, PA 16802, USA
44Institute for Gravitation and the Cosmos, Pennsylvania State University, University Park, PA 16802, USA
45Department of Physics, The Pennsylvania State University, University Park, PA 16802, USA
46Kavli IPMU (WPI), UTIAS, The University of Tokyo, Kashiwa, Chiba 277-8583, Japan
47Departamento de F´ısica Matem´atica, Instituto de F´ısica, Universidade de S˜ao Paulo, CP 66318, CEP 05314-970, S˜ao Paulo, SP, Brazil
48Sub-department of Astrophysics, Department of Physics, University of Oxford, Denys Wilkinson Building, Keble Road, Oxford OX1 3RH, UK
49New York University Abu Dhabi, P.O. Box 129188, Abu Dhabi, United Arab Emirates
50Korea Institute for Advanced Study, 85 Hoegiro, Dongdaemun-gu, Seoul 02455, Republic of Korea
51Departamento de F´ısica, Centro de Ciˆencias Naturais e Exatas, Universidade Federal de Santa Maria, 97105-900, Santa Maria, RS, Brazil
52Max-Planck-Institut f¨ur extraterrestrische Physik, Postfach 1312, Giessenbachstraße, 85741 Garching, Germany.
53Departamento de Astronom´ıa, Universidad de Concepci´on, Casilla 160-C, Concepci´on, Chile
54Center for Astrophysics and Space Astronomy, Department of Astrophysical and Planetary Sciences, University of Colorado, 389 UCB, Boulder, CO 80309, USA
55Instituto de F´ısica, Universidade Federal do Rio Grande do Sul, Campus do Vale, Porto Alegre, RS, , 91501-907, Brazil
56Aix Marseille Universit´e, CNRS/IN2P3, Centre de Physique des Particules de Marseille, UMR 7346, 13288, Mar-seille, France
57Department of Physics and Astronomy, Western Washing-ton University, 516 High Street, Bellingham, WA 98225, USA
58Department of Physics and McWilliams Center for Cos-mology, Carnegie Mellon University, 5000 Forbes Avenue, Pittsburgh, PA 15213, USA
59Observat´orio Nacional, 77 Rua General Jos´e Cristino, Rio de Janeiro, 20921-400, Brazil
60Department of Astronomy, University of Virginia, Char-lottesville, VA 22904-4325, USA
61Laboratoire d’Astrophysique, ´Ecole Polytechnique F´ed´erale de Lausanne, 1015 Lausanne, Switzerland
62Department of Physics, Geology, and Engineering Tech, Northern Kentucky University, Highland Heights, KY 41099, USA
63Centro de Investigaciones de Astronom´ıa, AP 264, M´erida 5101-A, Venezuela
64McDonald Observatory, The University of Texas at Austin, 1 University Station, Austin, TX 78712, USA
65Tsinghua Center for Astrophysics and Department of Physics, Tsinghua University, Beijing 100084, P. R. China
66Harvard-Smithsonian Center for Astrophysics, 60 Garden St., MS 20, Cambridge, MA 02138, USA
67School of Physics and Astronomy, University of Birming-ham, Edgbaston, Birmingham B15 2TT, UK
68Stellar Astrophysics Centre, Department of Physics and Astronomy, Aarhus University, Ny Munkegade 120, DK-8000 Aarhus C, Denmark
69European Southern Observatory, Karl-Schwarzschild-Str. 2, 85748 Garching, Germany
70Universit´e Lyon 1, Observatoire de Lyon, Centre de
Recherche Astrophysique de Lyon and ´Ecole Normale Sup´erieure de Lyon, 9 avenue Charles Andr´e, F-69230 Saint-Genis Laval, France
71Steward Observatory, University of Arizona, 933 North Cherry Avenue, Tucson, AZ 85721, USA
72Institut UTINAM, CNRS-UMR6213, OSU THETA, Universit´e Bourgogne-Franche-Comt´e, 41bis avenue de l’Observatoire, 25010 Besan¸con Cedex, France
73Space Telescope Science Institute, 3700 San Martin Drive, Baltimore, MD 21218, USA
74CSRA, Inc., 3700 San Martin Drive, Baltimore, MD 21218, USA
75Department of Physics & Astronomy, University of Iowa, Iowa City, IA 52245
76Laboratoire AIM, CEA/DRF – CNRS - Univ. Paris Diderot – IRFU/SAp, Centre de Saclay, 91191 Gif-sur-Yvette Cedex, France
77National Astronomy Observatories, Chinese Academy of Science, 20A Datun Road, Chaoyang District, Beijing, 100012, P. R. China
78Sorbonne Universit´es, UPMC Univ Paris 06, UMR 7095, Institut d’Astrophysique de Paris, 98 bis boulevard Arago, F-75014, Paris, France
79Laboratoire de Physique Nucl´eaire et de Hautes Energies, Universit´e Pierre et Marie Curie, 4 Place Jussieu,75005 Paris, France
80Osservatorio Astronomico di Padova – INAF, Vicolo dell’Osservatorio 5, I-35122, Padova, Italy
81Institute of Cosmology & Gravitation, University of Portsmouth, Dennis Sciama Building, Portsmouth, PO1 3FX, UK
82DePauw University, Greencastle, IN 46135, USA
83LPNHE, CNRS/IN2P3, Universit´e Pierre et Marie Curie Paris 6, Universit´e Denis Diderot Paris 7, 4 place Jussieu, 75252 Paris CEDEX, France
84Department of Astronomy, Case Western Reserve Univer-sity, Cleveland, OH 44106, USA
85Max Planck Institute for Solar System Research,Justus-von-Liebig-Weg 3, 37077 Goettingen, Germany
86Sydney Institute for Astronomy (SIfA), School of Physics, University of Sydney, NSW 2006, Australia
87SETI Institute, 189 Bernardo Avenue, Mountain View, CA 94043, USA
88Rice University, 6100 Main St, Houston, TX 77005, USA 89Department of Astronomy, The Ohio State University, 140 W. 18th Ave., Columbus, OH 43210, USA
90Center for Cosmology and AstroParticle Physics, The Ohio State University, 191 W. Woodruff Ave., Columbus, OH 43210, USA
91Max-Planck-Institut fuer Astrophysik, Karl-Schwarzschild-Str. 1, D-85748 Garching, Germany
92Institute for Astronomy, University of Vienna, T¨ urken-schanzstrasse 17, 1180 Vienna, Austria
93Department of Physics and Astronomy, University of California, Irvine, Irvine, CA 92697, USA
1. INTRODUCTION
The Sloan Digital Sky Survey (SDSS) has been ob-serving the Universe using the 2.5-meter Sloan Foun-dation Telescope (Gunn et al. 2006) at Apache Point Observatory (APO) for over 15 years. The goal of the original survey (2000–2005; York et al. 2000) was to map large-scale structure with five-band imaging over ∼ π steradians of the sky and spectra of ∼106 galaxies and
∼105 quasars. This program was accomplished using a
95Academia Sinica Institute of Astronomy and Astrophysics, P.O. Box 23-141, Taipei 10617, Taiwan
96Astrophysics Research Institute, Liverpool John Moores University, IC2, Liverpool Science Park, 146 Brownlow Hill, Liverpool L3 5RF, UK
97CSIC, Serrano, 117 - 28006, Madrid, Spain
98Space Science Institute, 4750 Walnut Street, Suite 205, Boulder, CO 80301, USA
99ELTE Gothard Astrophysical Observatory, H-9704 Szom-bathely, Szent Imre herceg st. 112, Hungary
100Departamento de Ciencias Fisicas, Universidad Andres Bello, Sazie 2212, Santiago, Chile
101Max-Planck-Institut f¨ur Astronomie, Konigstuhl 17, D-69117 Heidelberg, Germany
102LESIA, UMR 8109, Universit´e Pierre et Marie Curie, Universit´e Denis Diderot, Observatoire de Paris, F-92195 Meudon Cedex, France
103Department of Physics and Astronomy, University of Wyoming, Laramie, WY 82071, USA
104Department of Physics and Astronomy, University of Alabama, Tuscaloosa, AL 35487-0324, USA
105Institute for Astronomy, University of Edinburgh, Royal Observatory, Edinburgh EH9 3HJ, UK
106Universit´e Paris 6 et CNRS, Institut d’Astrophysique de Paris, 98bis blvd. Arago, 75014 Paris, France
107Instituto de Astrof´ısica de Andaluc´ıa (CSIC), Glorieta de la Astronom´ıa, E-18080 Granada, Spain
108Department of Astrnonomy and Astrophysics, University of California, Santa Cruz and UC Observatories, Santa Cruz, CA, 95064, USA
109Dipartimento di Fisica e Astronomia, Universit`a di Padova, Vicolo dell’Osservatorio 2, I-35122 Padova, Italy
110Departamento de Fisica y Astronomia, Universidad de La Serena, Cisternas 1200, La Serena, 0000-0002-1379-4204, Chile
111Instituto de Astronom´ıa, Universidad Nacional Aut´onoma de M´exico, Unidad Acad´emica en Ensenada, Ensenada BC 22860, Mexico
112Department of Astronomy and Space Science, Sejong University, Seoul 143-747, Korea
113Hubble Fellow
114Observatoire de la Cˆote d’Azur, Laboratoire Lagrange, 06304 Nice Cedex 4, France
115Department of Physics and Astronomy, Ohio University, Clippinger Labs, Athens, OH 45701, USA
116Institute of Space Sciences (IEEC-CSIC), Carrer de Can Magrans, E-08193, Barcelona, Spain
117University of Texas at Austin, McDonald Observatory, McDonald Observatory, TX, 79734, USA
118Brookhaven National Laboratory, Upton, NY 11973, USA 119National Optical Astronomy Observatories, Tucson, AZ, 85719, USA
120School of Physics, The University of New South Wales, Sydney NSW 2052, Australia
121Department of Astrophysical Sciences, Princeton Univer-sity, Princeton, NJ 08544, USA
122Instituto de F´ısica, Universidad Nacional Aut´onoma de M´exico, Apdo. Postal 20-364, Mexico
123Department of Physical Sciences, The Open University, Milton Keynes MK7 6AA, UK
124Department of Physics, University of North Carolina Asheville, One University Heights, Asheville, NC 28804, USA
125Physics Department, Austin College, Sherman, TX 75092, USA
126Department of Physics and Astronomy, University of Kentucky, 505 Rose Street, Lexington, KY 40506, USA
127Department of Physics, Bridgewater College, 402 E College St., Bridgewater, VA 22812, USA
drift-scan camera (Gunn et al. 1998) and two fiber-fed optical R∼1800 spectrographs (Smee et al. 2013), each with 320 fibers.
The imaging and spectroscopy goals were not entirely fulfilled in the initial five-year period, and thus SDSS-I was followed by SDSS-SDSS-ISDSS-I (2005–2008; Abazajian et al. 2009). Its first goal was to complete the planned initial large scale structure redshift survey as the Legacy pro-gram. It added SEGUE (Sloan Extension for Galactic Understanding and Exploration; Yanny et al. 2009), a spectroscopic survey focused on stars, and imaged an average of once every five days a ∼ 200 sq. deg area along the celestial equator with repeated scans in SDSS-I (“Stripe 82”), to search for Type SDSS-Ia supernovae and other transients (Frieman et al. 2008).
The success of SDSS as a cosmological probe, partic-ularly the detection of the clustering of luminous red galaxies (LRG) on the 100 h−1 Mpc scale expected
from baryon acoustic oscillations (BAO; Eisenstein et al. 2005), led to the conception and implementation of BOSS (BaryonOscillationSpectroscopicSurvey; Dawson et al. 2013) as the flagship program in the third version of the survey, SDSS-III (2008–2014; Eisenstein et al. 2011). As part of BOSS, SDSS-III imaged additional areas in the part of the south Galactic cap visible from the Northern hemisphere. At the conclusion of these observations, the SDSS imaging camera was retired and is now part of the permanent collection of the Smithsonian National Air and Space Museum1. During the summer shutdown in
2009, the original SDSS spectrographs were replaced by new, more efficient, spectrographs to be used by BOSS. The BOSS spectrographs featured expanded wavelength coverage (3560˚A< λ <10400 ˚A), new CCD detectors with improved read noise, smaller pixels (15µm), and improved quantum efficiency, and VPH gratings instead of the original replicated surface relief gratings (Smee et al. 2013). The two spectrographs were now fed by 500 fibers each so that the desired number of redshifts could be reached in the planned survey lifetime.
During the first year of SDSS-III (2008–2009), the SEGUE-2 survey (Rockosi et al., in preparation) used the original SDSS spectrographs to observe additional Milky Way halo fields to target distant halo samplers and trace substructure. In SDSS-III all bright time could be used for scientific observations with the arrival of two new instruments. MARVELS (Multi-object APO Radial Velocity Exoplanet Large-area Survey; Paegert et al. 2015; Thomas et al. 2016) used a novel multiplexing in-terferometer to observe 60 stars simultaneously to search for radial velocity variations caused by hot Jupiters and close brown dwarf companions. APOGEE (Apache PointObservatoryGalacticEvolutionExperiment; Ma-jewski et al. 2017) used a 300-fiber, R∼22,000 H-band spectrograph (Majewski et al. 2017; Wilson et al., in preparation) to measure stellar parameters, chemical abundances, and radial velocities, mainly for red giants (Zasowski et al. 2013).
Since routine operations started in 2000, there have been thirteen public data releases. All data releases are cumulative, re-releasing the best reduction of all previ-ously taken data. The most recent of these was Data
1
Release 12 (Alam et al. 2015), which contained all of the SDSS-III data, as well as the re-reduced data from SDSS-I and SDSS-II. SDSS-I to SDSS-III imaged 14,555 degree2 in the five filters (Fukugita et al. 1996; Doi
et al. 2010). Most of the sky was surveyed once or twice, but regions in Stripe 82 were observed between 70 and 90 times. By the time of their retirement, the SDSS spectrographs had obtained R∼1800 optical spec-tra for 860,836 galaxies, 116,003 quasars, and 521,990 stars. With the BOSS spectrographs, the survey has added data with similar resolution for 1,372,737 galax-ies, 294,512 quasars, and 247,216 stars. APOGEE has contributed high-resolution IR spectra of 156,593 stars. MARVELS had observed 3233 stars with at least 16 epochs of radial velocity measurements.
The success of the previous Sloan Digital Sky Surveys and the continuing importance of the wide-field, multi-plexing capability of the Sloan Foundation Telescope mo-tivated the organization of the fourth phase of the survey, SDSS-IV (Blanton et al. 2017). SDSS-IV extends SDSS observations to many fibers covering the spatial extent of nearby galaxies, to new redshift regimes, and to the parts of the Milky Way and dwarf galaxies that are only visible from the Southern Hemisphere. The MaNGA (Mapping NearbyGalaxies atAPO) survey studies galaxy forma-tion and evoluforma-tion across a wide range of masses and morphological types by observing a substantial portion of the optical spatial extent of ∼104 galaxies (Bundy et al. 2015). It accomplishes this goal by employing 17 bun-dles ranging in size between 19 and 127 fibers to cover targets selected from an extended version of the NASA-Sloan Atlas2 and 12 bundles of 7 fibers for calibration stars. These integral field units (IFUs) feed the BOSS spectrographs, providing information on the properties of gas and stars in galaxies out to 1.5–2.5 effective radii (Re).
Another survey, eBOSS (extendedBaryonOscillation Spectroscopic Survey Dawson et al. 2016), shares the dark time equally with MaNGA. eBOSS will measure with percent-level precision the distance-redshift relation with BAO in the clustering of matter over the relatively unconstrained redshift range 0.6 < z < 2.2. This red-shift range probes the Universe during its transition from matter-dominated to dark-energy-dominated. Multiple measurements of the angular diameter distance (dA(z)) and Hubble parameter (H(z)) from BAO over the red-shifts covered by eBOSS are therefore crucial for under-standing the nature of dark energy. eBOSS will use spectroscopic redshifts from more than 400,000 LRGs and nearly 200,000 Emission-Line Galaxies (ELGs) to extend the final BOSS galaxy clustering measurements (Alam et al. 2017) by providing two new BAO dis-tance measurements over the redshift interval 0.6< z < 1.1 Roughly 500,000 spectroscopically-confirmed quasars will be used as tracers of the underlying matter den-sity field at 0.9 < z < 2.2, providing the first mea-surements of BAO in this redshift interval. Finally, the Lyman-αforest imprinted on approximately 120,000 new quasar spectra will give eBOSS an improved BAO mea-surement over that achieved by BOSS (Delubac et al. 2015; Bautista et al. 2017). The three new tracers will provide BAO distance measurements with a precision of
2http://www.nsatlas.org
1% at z = 0.7 (LRG), 2% at z = 0.85 (ELG), and 2% at z = 1.5 (quasar) while the enhanced Lyman-α for-est sample will improve BOSS constraints by a factor of 1.4. Furthermore, the clustering from eBOSS trac-ers will allow new measurements of redshift-space dis-tortions (RSD), non-Gaussianity in the primordial den-sity field, and the summed mass of neutrino species. Extensively observing these redshift ranges for the first time in SDSS required re-evaluation of targeting strate-gies. Preliminary targeting schemes for many of these classes of objects were tested as part of SEQUELS (Sloan
Extended QUasar, Emission-line galaxy, Luminous red galaxy Survey), which used 126 plates observed across SDSS-III and -IV. DR13 includes all SEQUELS data, giving the largest SDSS sample to date of spectra target-ing intermediate redshift ranges. SDSS-IV also allocated a significant number of fibers on the eBOSS plates to two additional dark-time programs. TDSS(TimeDomain
Spectroscopic Survey; Morganson et al. 2015) seeks to understand the nature of celestial variables by delib-erately targeting objects that vary in combined SDSS DR9 and Pan-STARRS1 data (PS1; Kaiser et al. 2002) . A large number of the likely quasar targets so se-lected are also targeted by the main eBOSS algorithms and therefore meet the goals of both surveys. TDSS-only targets fill ∼ 10 spectra per square degree. The main goal of the SPIDERS (SpectroscopicIdentification of eROSITA Sources) survey is to characterize a sub-set of X-ray sources identified by eROSITA (extended Roentgen Survey with an Imaging Telescope Array; Predehl et al. 2014) . Until the first catalog of eROSITA sources is available, SPIDERS will target sources from the RASS (RoetgenAllSkySurvey; Voges et al. 1999) and XMM (X-ray Multi-mirror Mission; Jansen et al. 2001). SPIDERS will also obtain on average∼10 spec-tra per square degree over the course of SDSS-IV, but the number of fibers per square degree on a plate is weighted toward the later years to take advantage of the new data from eROSITA.
In bright time at APO, APOGEE-2, the successor to APOGEE (hereafter APOGEE-1) in SDSS-IV, will con-tinue its survey of the Milky Way stellar populations. Critical areas of the Galaxy, however, cannot be observed from APO, including the more distant half of the Galac-tic bar, the fourth quadrant of the disk, and important dwarf satellites of the Milky Way, such as the Magellanic Clouds and some dwarf spheroidals. SDSS-IV will for the first time include operations outside of APO as the result of Carnegie Observatories and the Chilean Participation Group joining the collaboration. A second APOGEE spectrograph is being constructed for installation on the 2.5-meter du Pont Telescope (Bowen & Vaughan 1973) at Las Campanas Observatory (LCO) near La Serena, Chile. When APOGEE-2S begins survey operations in 2017, approximately 300 survey nights on the du Pont Telescope will be used to extend the APOGEE-2 survey to the Southern Hemisphere.
bibli-ography of the technical papers available to understand the data and the surveys in more detail. These technical papers and the SDSS website (www.sdss.org) contain critical information about these data, which here is only summarized.
2. OVERVIEW OF THE SURVEY LANDSCAPE
The release of DR13 coincides with the arrival of an astonishgly rich set of data from ongoing and recently completed surveys outside of SDSS. Blanton et al. (2017), Bundy et al. (2015), and Majewski et al. (2017) describe how the SDSS-IV surveys compare in survey strategy, size, and data within the wider arena of spectroscopic surveys. We cite here some key science results for these works to complement our brief history of SDSS.
Spectroscopic redshift surveys of large scale structure have resulted in BAO measurements over a range of shifts. The BAO signal has been detected at lower red-shift (z∼0.1) from measurements of ∼75,000 galaxies in the 6dF Galaxy Redshift Survey (Beutler et al. 2011). WiggleZ measured the BAO signal at similar redshifts to BOSS based on redshifts of ∼225,000 galaxies. The final WiggleZ results for the 1-D BAO peak (Kazin et al. 2014) and the 2-D BAO peak (Hinton et al. 2017) at z=0.44, 0.6 and 0.73 agree with the BOSS results. Still underway is the VIMOS Public Extragalactic Redshift Survey, which focuses on higher redshifts than previous work (0.5<z<1.2) and will overlap in part with eBOSS (Guzzo et al. 2014).
When the MaNGA survey began, two pioneering and highly influential IFU surveys of hundreds of galaxies were being completed: CALIFA (S´anchez et al. 2012) and ATLAS3D (Cappellari et al. 2011). ATLAS3D ob-served 260 morphologically classified early-type galaxies (ETGs) within 40 Mpc at optical, radio, and infrared wavelengths, including optical IFU observations with the PPAK integral field unit instrument. CALIFA released IFU data from SAURON on 667 galaxies in its third and final data release (S´anchez et al. 2016). These galax-ies spanned a range of morophologgalax-ies from irregular to elliptical, over 7 magnitudes in luminosity, and over 3 magnitudes in u−zcolors. The increase in the number of galaxies with IFU data led to many pivotal discov-eries regarding galaxy evolution, including advances in our knowledge of the origin and heating sources of gas in ETGs, gas and stellar abundance gradients in galaxies, and the star-formation rate and age of stellar popula-tions, highlighted below.
Davis et al. (2011) used ATLAS3D to investigate the
origins of the gas in slow and fast rotating ETGs in dif-ferent environments. Overall, ETGs are poor in atomic and molecular gas and therefore lack much star for-mation, and the cause of this transformation is criti-cal to understanding galaxy formation. Alatalo et al. (2011) identified one mechanism for gas depletion in the ATLAS3D galaxy NGC 1266, in the form of a strong molecular wind from the nucleus, likely powered by a hidden AGN. Kehrig et al. (2012) suggested an AGN as an energy source for the elongated ionized gas ob-served by CALIFA in NGC 5966. The CALIFA data also showed that NGC 5966 and its fellow ETG, NGC 6762 had extended line emission best explained by heating from post-asymptotic giant branch (p-AGB) stars Gomes et al. (2016) studied 32 ETGs in CALIFA and found
ex-tended Hαemission that fell into two broad classes based on whether the intensity of emission is flat or increasing with radius.
The ages of stellar populations across CALIFA’s wide range of Hubble types show that galaxies with stellar masses>∼5×10⁹M
form from the inside out, with the more massive galaxies having older stellar populations in each scaled radial bin (P´erez et al. 2013). Cano-D´ıaz et al. (2016) showed the relationship between star forma-tion rate (SFR) and stellar mass that held for entire star-forming galaxies was also true for spatially resolved regions within a galaxy. In another intriguing clue to the relation between small and large scales, S´anchez et al. (2014) found that the HII regions in 306 CALIFA galax-ies have a characteristic disk oxygen abundance gradient when scaled to its effective radius.
Another large IFU survey, the SAMI survey (Bryant et al. 2015), is currently underway at the Anglo-Australian Telescope and will utimately observe 3400 galaxies. The Early Data Release (Allen et al. 2015) provided data for 107 galaxies, while the first major data release (Green et al. 2017) includes 772 galaxies. Science results from the SAMI survey so far include characterizing the galac-tic winds or extended diffuse ionizing gas in edge-on disk galaxies Ho et al. (2016), mapping the quenching of star formation proceeding from the outside-in in dense en-vironments Schaefer et al. (2017), and identifying stellar mass as the main variable affecting fraction of ETGs that are slow rotators Brough et al. (2017)
While APOGEE-2 is currently the onlyinfrared lar spectroscopic survey, there are several Galactic stel-lar surveys of simistel-lar scope observing at optical wave-lengths. The RAVE survey (Steinmetz et al. 2006) com-pleted observations in 2013 with R∼7,500 spectra of
∼450,000 bright stars in the CaII triplet region released in Data Release 5 (Kunder et al. 2017). RAVE’s pri-mary goal was obtain spectroscopic measurements for stars with exquisite Gaia proper motion and parallax measurements. The ∼ 250,000 stars in DR5 that have proper motions and parallaxes in the first Gaia data re-lease (Gaia Collaboration et al. 2016) now make this work possible in both the disk (e.g., Robin et al. 2017) and halo (e.g., Helmi et al. 2017). Among the many results pub-lished prior to the Gaia results were measurements of the local escape velocity (Smith et al. 2007; Piffl et al. 2014, e.g.,), detection of a “wobbly” Galaxy from asymmetric velocities both radially and across the disk (Siebert et al. 2011; Williams et al. 2013)), and the observation of extra-tidal stars from Galactic globular clusters (e.g., Kunder et al. 2014; Fern´andez-Trincado et al. 2015; Anguiano et al. 2016)
The Gaia-ESO survey recently completed observations of ∼ 105 cluster and field stars at either R∼20,000 or
R∼47,000 (Gilmore et al. 2012). The Gaia-ESO collab-oration has presented important results about the na-ture of several Galactic components, including the abun-dances and kinemetics in the bulge (e.g., Howes et al. 2014; Rojas-Arriagada et al. 2017; Recio-Blanco et al. 2017), characterizing the accreted component of the halo and (if any) disk (e.g., Ruchti et al. 2015), and measuring radial abundance gradients in the open cluster popula-tion (e.g., Jacobson et al. 2016; Magrini et al. 2017).
et al. 2012). Data Release 33includes 5.75 million spectra and stellar parameters for >3 million stars. LAMOST has an ideal view of the field observed for four years by theKeplersatellite, and several groups have used the
∼50,000 stars observed in theKeplerfield to characterize its stellar populations (e.g., Dong et al. 2014; Frasca et al. 2016; Ren et al. 2016; Chang et al. 2017; Dong et al. 2017). Other work based on LAMOST spectra includes measurements of stellar activity (e.g., Fang et al. 2016) and identification of important subclasses of objects from ultra metal-poor stars (e.g., Li et al. 2015) and metallitic lined Am stars (e.g., Hou et al. 2015).
The GALAH survey (De Silva et al. 2015), which started operations in 2014, released spectra for over 200,000 stars observed with the HERMES spectrograph (R∼28,000) at the Anglo-Australian Telescope (Martell et al. 2017). When the survey is completed, spectra of
∼106 stars in 4 optical windows accessing 29 elements
are expected.
3. SCOPE OF DATA RELEASE 13
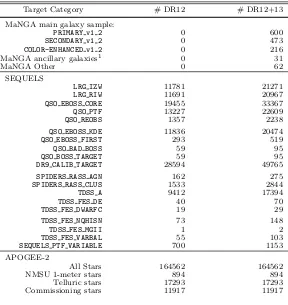
SDSS-IV has been operating since July 2014. DR13 contains data gathered between July 2014 and July 2015 and is summarized in Table 1. The categories under MaNGA galaxies are described in §5. The SEQUELS targeting flags are listed and described in Alam et al. (2015). Figures 1, 2, 3 show the sky coverage of the MaNGA, eBOSS and APOGEE-2 surveys respectively. In the subsequent sections, we discuss each survey’s data in detail, but briefly DR13 includes
• Reduced data for the 82 MaNGA galaxy survey plates, yielding 1390 reconstructed 3-D data cubes for 1351 unique galaxies, that were completed by July 2015. Row-stacked spectra (RSS) and raw data are also included.
• Reduced BOSS spectrograph data for an additional 60 SEQUELS plates, completing the SEQUELS program. The total number of SEQUELS plates released in DR12 and DR13 is 126. These plates provide a complete footprint covering roughly 400 square degrees that will not be revisited in eBOSS. The targets include a superset of the eBOSS LRG and quasar samples, a sample of variability-selected point sources at a much higher density than in TDSS, and new X-ray-selected objects selected by similar criteria to targets in SPIDERS.
• The reduced data for five BOSS plates at low dec-lination in the SGC. These plates were drilled dur-ing SDSS-III but not observed due to insufficient open-dome time when they were observable. The plates were observed early in SDSS-IV to fill in the footprint in this region.
• Spectroscopic data from BOSS processed with a new version of the data reduction pipeline, which results in less-biased flux values.
• All APOGEE-1 data re-reduced with improved tel-luric subtraction and analyzed with an improved pipeline and synthetic grid, including adding rota-tional broadening as a parameter for dwarf spectra.
3dr3.lamost.org
• New species (C I, P, Ti II, Co, Cu, Ge, and Rb) with reported abundances for APOGEE-1 sample.
• Stellar parameters for APOGEE-1 stars with cooler effective temperatures (Teff <3500K), derived by
an extension of the grid of synthetic spectra us-ing MARCS (Gustafsson et al. 2008) model atmo-spheres.
• Recalibrated SDSS imaging catalogs, using the hy-percalibration to PanSTARRS-1 implemented by Finkbeiner et al. (2016).
• Valued-added catalogs, see Table 2. More detail and direct links to the catalogs and their datamod-els can be found at http:\www.sdss.org/dr13/ data_access/vac.
• The most recent reductions of all data from previ-ous iterations of SDSS is included as a matter of course. For MARVELS data, these data are the same as in DR12; for SEGUE and SEGUE-2, the same as in DR9.
DR13 contains only a subset of the reduced or raw data for all surveys taken between July 2014 and July 2015. The first two years of eBOSS data are needed before useful cosmological constraints can be extracted. APOGEE-2 is using the first year of SDSS-IV data to work on science verification and targeting optimization for new classes of targets and new survey strategies. Both of these surveys will release more extensive new data in Data Release 14.
4. DATA DISTRIBUTION
The data for DR13 are distributed through the same mechanisms available in DR12, with some significant changes to the environment used to access the catalog data (see below). Raw and processed image and spectro-scopic data are available, as before, through the Science Archive Server (SAS, data.sdss.org/sas/dr13), and also for imaging data, optical spectra, and APOGEE IR spectra through an interactive web application (dr13. sdss.org, available soon). The catalogs of photomet-ric, spectroscopic, and derived quantities are available through the Catalog Archive Server or CAS (Thakar et al. 2008; Thakar 2008) via two primary modes of ac-cess: browser-based queries of the database are avail-able through the SkyServer Web application (http:// skyserver.sdss.org) in synchronous mode, and more advanced and extensive querying capabilities are avail-able through CasJobs (http://skyserver.sdss.org/ casjobs) in asynchronous or batch mode that allows time-consuming queries to be run in the background (Li & Thakar 2008).
TABLE 1
Reduced spectroscopic data in DR13
Target Category # DR12 # DR12+13
MaNGA main galaxy sample:
PRIMARY v1 2 0 600 SECONDARY v1 2 0 473 COLOR-ENHANCED v1 2 0 216 MaNGA ancillary galaxies1 0 31
MaNGA Other 0 62
SEQUELS
LRG IZW 11781 21271 LRG RIW 11691 20967 QSO EBOSS CORE 19455 33367 QSO PTF 13227 22609 QSO REOBS 1357 2238
QSO EBOSS KDE 11836 20474 QSO EBOSS FIRST 293 519 QSO BAD BOSS 59 95 QSO BOSS TARGET 59 95 DR9 CALIB TARGET 28594 49765
SPIDERS RASS AGN 162 275 SPIDERS RASS CLUS 1533 2844 TDSS A 9412 17394 TDSS FES DE 40 70 TDSS FES DWARFC 19 29
TDSS FES NQHISN 73 148
TDSS FES MGII 1 2
TDSS FES VARBAL 55 103 SEQUELS PTF VARIABLE 700 1153 APOGEE-2
All Stars 164562 164562 NMSU 1-meter stars 894 894 Telluric stars 17293 17293 Commissioning stars 11917 11917
[image:8.612.56.592.465.571.2]1Many MaNGA ancillary targets were also targeted as part of the main galaxy sample, and are counted twice in this table.
TABLE 2
Value-Added Catalogs New in DR13
Catalog Description Reference http://data.sdss.org/sas/dr13/
SPIDERS Clusters demonstration sample catalog Clerc et al. (2016) eboss/spiders/analysis/ SPIDERS AGN target selection catalog Dwelly et al. (2017) eboss/spiders/target/ SPIDERS cluster target selection catalog Clerc et al. (2016) eboss/spiders/target/
WISE Forced Photometry Lang et al. (2016) eboss/photoObj/external/WISEForcedTarget/301/ Composite Spectra of Emission-line Galaxies Zhu et al. (2015) eboss/elg/composite/v1_0/
ELG Fisher selection catalog Delubac et al. (2017) eboss/target/elg/fisher-selection/
Redmonster redshift & spectral classification catalog Hutchinson et al. (2016) eboss/spectro/redux/redmonster/v5_9_0/v1_0_1/ QSO Variability Palanque-Delabrouille et al. (2016) eboss/qso/variability/
APOGEE DR13 red-clump catalog Bovy et al. (2014) apogee/vac/apogee-rc/cat/
New services are also available to users once they regis-ter on the SciServer portal, and these services work seam-lessly with the existing tools. Most notable among the new offerings are SciDrive, a distributed DropBox-like file store; SkyQuery, a federated cross-matching service that compares and combines data from a collection (fed-eration) of multi-wavelength archives (SkyNodes); and SciServer Compute, a powerful new system for upload-ing complex analysis scripts as Jupyter notebooks (usupload-ing Python, MatLab or R) running in Docker containers.
Links to all of these methods are provided at the SDSS website (http://www.sdss.org/dr13/data_ access) The data processing software for APOGEE, BOSS, and SEGUE are publicly available at http:// www.sdss.org/dr13/software/products. A set of
tu-torial examples for accessing SDSS data is provided at http://www.sdss.org/dr13/tutorials. All flat files are available for download at http://data.sdss.org/ datamodel/
5. RECALIBRATION OF IMAGING DATA
Fig. 1.— In grey are shown the locations in equatorial coordinates of all possible plates with MaNGA galaxies, each containing 17 galaxy targets. Because the MaNGA targets are selected to have SDSS photometry, this footprint corresponds to the Data Release 7 imaging data (Abazajian et al. 2009). Approximately 30% of these will be observed in the full planned MaNGA survey. The blue shows the plates observed in the first year of MaNGA for which data cubes are released in this paper.
[image:9.612.133.484.460.631.2]by comparison with PS1 photometry and spectral energy distributions for stars with spectra, are reduced to 0.9, 0.7, 0.7 and 0.8% in the griz bands, respectively; sev-eral previously uncertain calibrations of specific runs are also now much better constrained. The resulting recali-brated imaging catalogs are the basis for the eBOSS and MaNGA targeting.
For the MaNGA target selection, we are using the NASA-Sloan Atlas (NSA; Blanton et al. 2011), a reanal-ysis of the SDSS photometric data using sky subtraction and deblending better tuned for large galaxies. Rela-tive to the originally distributed version of that cata-log, we have used the new calibrations mentioned above, increased the redshift range up to z = 0.15, and have added an elliptical aperture Petrosian measurement of flux, which MaNGA targeting is based upon. DR13 in-cludes the NSA catalog (versionv1 0 1) associated with this reanalysis as thensatlasCAS table and as a file on the SAS. For the MaNGA galaxies released in DR13, we provide the actual images (referred to in MaNGA docu-mentation as “preimaging”) on the SAS as well.
Lang et al. (2016) reanalyzed data from theWide-field InfraredSatelliteExplorer (WISE; Wright et al. 2010) to use for eBOSS targeting. They used positions and galaxy profile measurements from SDSS photometry as input structural models and constrained fluxes in the WISE 3.4 µm and 4.6 µm bands. These results agree with the standard WISE reductions to within 0.03 mag for high signal-to-noise ratio, isolated point sources in WISE. However, the new reductions provide flux measurements for low signal-to-noise ratio (< 5σ) objects detected in the SDSS but not in WISE (over 200 million objects). Despite the fact that the objects are undetected, their flux measurements are nevertheless informative for tar-get selection, in particular for distinguishing stars from quasars. This photometry is provided as a value-added catalog in thewiseForcedTargetCAS table and on the SAS as described in Table 2.
The Galactic extinction estimates published in the SDSS imaging tables (photoObjand related tables in the CAS) have been changed. The Galactic extinction still uses the Schlegel et al. (1998) models of dust absorp-tion to estimate E(B−V), but the Galactic extinction coefficients for each band have been updated as recom-mended by Schlafly & Finkbeiner (2011). The extinction coefficientsRu,Rg,Rr,Ri, andRzare changed from the values used in BOSS (5.155, 3.793, 2.751, 2.086, 1.479) to updated values (4.239, 3.303, 2.285, 1.698, 1.263). The corresponding numbers for the WISE bands areRW1=
0.184 for the WISE 3.4µm band and RW2 = 0.113 for
the 4.6µm band (Fitzpatrick 1999).
6. MANGA: INTEGRAL FIELD SPECTROSCOPIC DATA
MaNGA is investigating the internal kinematics and composition of gas and stars in low redshift (z ≤0.15) galaxies using fiber bundles to feed the BOSS spectro-graphs. Bundy et al. (2015) describe the high-level sci-entific goals, scope, and context of the survey in inves-tigating galaxy formation while Yan et al. (2016) give a detailed description of the survey design, execution, and data quality relevant to DR13. With nearly 1390 data cubes released, MaNGA’s DR13 data products represent the largest public sample to date of galaxies observed with integral field spectroscopy. This data set signifies a
valuable first step in MaNGA’s goals to reveal the inter-nal properties and dynamics of a statistically powerful sample of galaxies, that spans a broad range in stellar mass, local environment, morphology, and star formation history. Individual observations across the sample are of sufficient quality to characterize the spatially-dependent composition of stars and gas as well as their internal kinematics, thus providing important clues on growth and star formation fueling, the build-up of spheroidal components, the cessation of star formation, and the in-tertwined assembly history of galaxy subcomponents.
The survey was made possible through an instrumen-tation initiative in SDSS-IV to develop a reliable and efficient way of bundling 1423 optical fibers into tightly-packed arrays that constitute MaNGA’s IFUs (Drory et al. 2015). For each pointing, MaNGA observes 17 science targets with IFUs ranging from 19 to 127 fibers (with diameters of 12−3200). The IFU size distribu-tion was optimized in concert with the sample design (Wake et al. 2017) that targets SDSS-I/II main sam-ple galaxies at a median redshift of 0.03 to obtain in 6 years a sample of 104galaxies with uniform radial
cov-erage and a roughly flat distribution in log M∗ limited to M∗ > 109M. Careful attention was paid to opti-mizing hardware and an observing strategy that ensures high quality imaging spectroscopy (Law et al. 2015) and to surface photometric flux calibration with a precision better than 5% across most of the wavelength range, 3,622-10,354˚A(Yan et al. 2016). As described in these papers, salient aspects included protocols for constrain-ing hour-angles of observations to limit differential at-mospheric diffraction, dithering exposures to avoid gaps in the coverage of the targets because of space between the fibers, and special calibration mini-bundles to ensure reliable absolute and relative flux calibration. An au-tomated pipeline delivers sky-subtracted, flux-calibrated row-stacked-spectra (RSS) and datacubes for all sources (Law et al. 2016).
6.1. MaNGA DR13 Main Galaxy Sample
fect of changing the physical resolution systematically as a function of stellar mass, as illustrated in Figure 4. Po-tential deleterious effects of this change in sampling are addressed by an ancillary program, described below.
We also designed a Color-Enhanced supplement, as a supplement to the Primary sample, to enhance the sam-pling of galaxies with rare color-magnitude combinations, such as low-mass red galaxies, high mass blue galaxies, and green valley galaxies. This is achieved by extending the redshift limits around the Primary sample redshift band for each underpopulated region in color-magnitude space.
The combination of the Primary sample and the Color-Enhanced supplement is referred to as the Primary+ sample. We provide in our data release the redshift limits over which each galaxy is selected. This permits a correc-tion to the sample using 1/Vmaxweight to reconstruct a
volume-limited representation of the galaxy population, provided that there is negligible galaxy evolution over this limited redshift range. More details of how we ar-rived at this selection can be found in Yan et al. (2016) and Wake et al. (2017). Wake et al. (2017) provides the details of how to properly weight the sample to recon-struct a volume-limited representation.
Among the 1351 unique galaxies released in DR13, there are 600 Primary Sample galaxies, 473 Secondary Sample galaxies, and 216 Color-Enhanced supplement galaxies. There are 62 galaxies that do not belong to any of the above. Some of these are ancillary program targets (see below), some are filler objects on plates with spare bundles, and others are galaxies selected using older, ob-solete versions of the selection and observed on early plates. For most statistical analyses, these 62 galaxies should be excluded.
Which sample a given target galaxy belongs to is given by the MANGA TARGET1 bitmask (or mngtarg1 in the “drpall” file; see§5.2). Primary sample galaxies have bit 10 set to 1, Secondary Sample galaxies have bit 11 set to 1, and Color-Enhanced Supplement Galaxies have bit 12 set to 1. Bits 1-9 are for obsolete selections and should be ignored.
6.1.1. MaNGA Galaxy Ancillary Programs
Roughly 5% of the IFUs are assigned to ancillary sci-ence programs defined by and allocated through internal competition and review. This assignment takes advan-tage of sky regions with a low density of galaxies defined by our main survey criteria (above) or where certain rare classes of objects, possibly outside our selection cuts, are of sufficiently high science value to re-allocate IFUs from the main program. Such high-value targets sometimes come from the main sample, but the ancillary science goals require a different bundle size, a slightly different center positions, or higher prioritization over the random selection among the main sample galaxies. There are also science cases where using observing strategies different from standard MaNGA observations are required. These lead to dedicated plates.
We solicited ancillary proposals in all these cate-gories during the first year of survey observations, and they started to be included in plate design half way through this year. Consequently, the ancillary frac-tion in DR13 is smaller than 5%. Some ancillary programs have tens of targets approved but only a
few got observed during the first year, while some have no observations during this period. More tar-gets for these programs will be observed in the fu-ture. To identify ancillary targets, one should use the MANGA TARGET3 bitmask (or mngtarg3 in the dr-pall file). All ancillary targets have MANGA TARGET3 greater than zero. Additional information on the scien-tific jusscien-tification and targeting for each ancillary program can be found at http://www.sdss.org/dr13/managa/ manga-target-selection/ancillary-targets. Here we provide some highlights and the corresponding bit-names.
• Luminous AGN:This program increases the num-ber of host galaxies of the most luminous active galactic nuclei (AGN). The first source of targets is the BAT 70-month Hard X-ray catalog (Baumgart-ner et al. 2013). These have the bitnameAGN BAT. To increase the sample size further we used the [OIII]-selected catalog of Mullaney et al. (2013) (bitnameAGN OIII). To match the distribution of bolometric luminosities between the samples, we selected 5 [OIII] objects at comparable Lbolto each
BAT object, within a redshift range of 0.01-0.08. The bolometric corrections are from Shao et al. (2013) and Vasudevan & Fabian (2009).
• Edge-On Starbursts: We will use edge-on star-bursts to study the morphology and ionization state of large-scale outflows. To identify good tar-gets, the specific star formation rate (sSFR) and inclination of every object in the baseline MaNGA targeting catalog was calculated. The sSFR was determined using WISE photometry from Lang et al. (2016) and the calibration between the W4 filter and 22µm emission in Jarrett et al. (2013) . We then use a calibration from Cluver et al. (2014) to derive the sSFR. The axis ratio SERSIC BA in the targeting catalog was used to derive the inclination. All targets in this program have log sSFR>−8.75 and inclination > 75 deg.. The four galaxies in DR13 that have these properties, but were not in-cluded in the main galaxy target sample, have bit-nameEDGE ON WINDS.
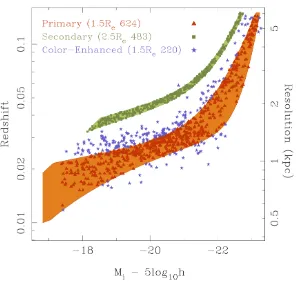
Fig. 4.— Principal selection cuts for the main MaNGA samples, whereh =H0/100 km s−1. The colored bands show the selection cuts for the Primary (orange) and Secondary (green) samples illustrating the Mi dependence of the redshift limits. More luminous, and hence typically larger galaxies are selected at higher redshift than less luminous galaxies, ensuring that the angular size (1.5Re or 2.5 Re) distribution is roughly independent of luminosity. The volume sampled also increases as the luminosity increases in such a way as to ensure a constant number density of galaxies at all luminosities. The points show the positions in this plane for the MaNGA galaxies in DR13, for the Primary (red triangles), Secondary (green squares) and Color-Enhanced samples (blue stars), although the Color-Enhanced selection also depends on NUV-icolor (see text for details). The numbers in the legend give the total number of observations of galaxies in each class, including repeat observations. The right hand y-axis gives an indication of the physical size of the mean spatial resolution element of the MaNGA data.
with PAIR SIMcomes from the Galaxy Zoo Merg-ers Sample (Holincheck et al. 2016). A critical sample comes from the ancillary program that re-quests that each galaxy be assigned a separate IFU PAIR 2IFU. Only four pairs of interacting galaxies are serendiptiously targeted in the main MaNGA galaxy sample with separate IFUs, and this sam-ple will compensate for the strong bias in the sin-gle IFU sample towards close separations or higher redshifts.
• Massive Nearby Galaxies: Because the largest MaNGA IFU covers 3200, more luminous, larger galaxies observed to the same effective radius have poorer spatial resolution. The one MASSIVE ancil-lary target in DR13 is part of a program to obtain a sample of nearby large galaxies with spatial reso-lution better than 3 kpc and similar to the faintest galaxies in the MaNGA primary sample, at the cost of spatial extent.
• Milky Way Analogs: Licquia et al. (2015) defined a sample of Milky Way analogs based on M∗, SFR, absolute magnitudes, and colors. MaNGA is
in-cluding some of these analogs in the main galaxy catalog, but they are slightly biased or deficient in certain regions of parameter space. Galaxies with the bitnameMWAare drawn from the Licquia et al. (2015) catalog to provide galaxies in those under-represented parts of parameter space.
• Dwarf Galaxies in MaNGA: The MaNGA main galaxy sample has galaxies with M∗>109M, but dwarf galaxies are the most numerous galaxies in the Universe. This ancillary program provides 2 dwarf galaxies with MaNGA observations in DR13, the first observations of a larger sample expected by the end of the survey covering a range of environ-ments. These galaxies are indicated by the bitname DWARF and are drawn from the Geha et al. (2012) galaxy catalog with stellar masses<109M
.
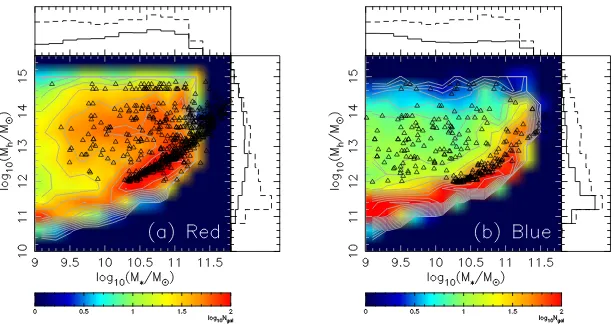
Fig. 5.—The location of MaNGA galaxies (black triangles) in this data release area in the plane of stellar mass (M∗,x-axis) versus dark matter halo mass (Mh,y-axis). The two panels show red and blue galaxies separately,which are divided by a single color cut atg−r= 0.7. Stellar masses are taken from the NASA-Sloan Atlas, and halo masses from SDSS/DR7, using the method of Yang et al. (2007). Plotted as a colormap in the background are the number of MaNGA galaxies predicted for a 6-year full survey based on mock catalogs informed by the semi-analytic model of Guo et al. (2011) and constructed as in Li et al. (2006), which are the same as Figure 3 of Bundy et al. (2015). Normalized histograms show 1D marginalized M∗distributions (top axes) and Mhdistributions (right axes), with dashed lines for the full primary sample and solid lines for the red (left) and blue (right) populations.
DR7 NYU VAGC, an update of the DR4 version of Blanton et al. (2005)
• MaNGA Resolved Stellar Populations: The ancil-lary program targets NGC 4163, a nearby dwarf galaxy with existing HST imaging and high-quality color-magnitude diagrams selected from the ACS Nearby Galaxy Survey (Dalcanton et al. 2009). This galaxy is flagged by the bitnameANGST.
6.2. MaNGA Data Products: Individual Fiber Spectra and 3-D Data Cubes
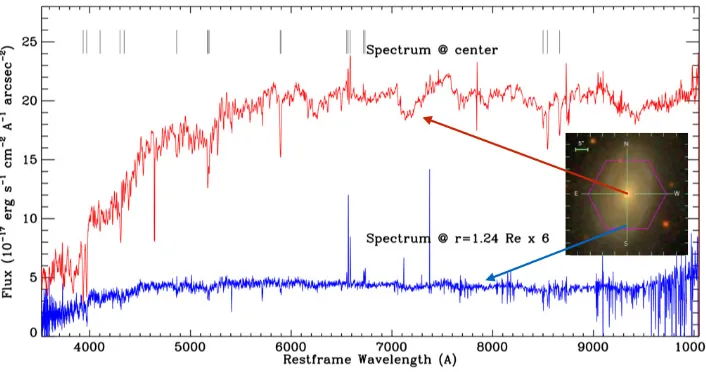
In DR13, MaNGA is releasing both raw data (in the form of individual CCD frames) and reduced data pro-duced by version 1 5 4 of the MaNGA Data Reduction Pipeline (DRP). Figure 6 illustrates the quality of the spectra from this pipeline. The MaNGA observing strat-egy is described by Law et al. (2015), and the flux cal-ibration by Yan et al. (2016). Details of the MaNGA DRP, data products, and data quality are given by Law et al. (2016) (hereafter L16). All MaNGA data are in the form of multi-extension FITS files.
The DRP data products consist of intermediate re-duced data (sky-subtracted, flux-calibrated fiber spectra with red and blue data combined for individual exposures of a plate) and final-stage data products (summary row-stacked spectra and data cubes) for each target galaxy. The summary row stacked spectra (RSS files) are two-dimensional arrays provided for each galaxy in which each row corresponds to a single fiber spectrum. For a 127-fiber IFU with 9 exposures, there are thus 127 ×
9 = 1143 rows in the RSS file. These RSS files have ad-ditional extensions giving astrometric information about the wavelength-dependent locations of each fiber on the sky.
The three-dimensional data cubes (axes R.A., Decl., wavelength) are created by combining the individual
spectra for a given galaxy together onto a regularized 0.500 grid (see L16 for more detail). Both data cubes and RSS files are provided in a version with a log wavelength scale, which is the standard extraction and is relatively smooth in velocity space, and in a version with a linear wavelength scale, created directly from the native pixel solution rather than by resampling the log-scaled spec-tra resampling. Each MaNGA data cube has associated extensions corresponding to the estimated inverse vari-ance per pixel and a bad-pixel mask containing informa-tion about the quality of a given pixel within the cube (depth of coverage, bad values, presence of foreground stars, etc). Additional extensions provide information about the instrumental spectral resolution, individual ex-posures that went into the composite data cube, recon-structed griz broadband images created from the IFU spectra, and estimates of the griz reconstructed point spread function.
The objects observed by MaNGA for which data cubes have been produced are summarized in the “drpall” file, a FITS binary table with one entry per object (including both galaxies and spectrophotometric standard stars ob-served with 7-fiber IFUs to calibrate the MaNGA data). This drpall file lists the name, coordinates, targeting in-formation (e.g., redshift as given by the NASA Sloan Atlas), reduction quality, and other quantities of inter-est to allow users to identify galaxy targets of interinter-est. We note that MaNGA adopts two naming schemes. The first, termed “mangaid” is an identifier unique to a given astronomical object (e.g., 1-266039). The second, the “plate-ifu” uniquely identifies a given observation by con-catenating the plate id with the IFU number (e.g., 7443-12701 identifies the first 127-fiber IFU on plate 7443). Since some galaxies are observed more than once on dif-ferent plates, a given mangaid can sometimes correspond to more than one plate-ifu.
TABLE 3
Summary of MaNGA Ancillary Programs with Data in DR13
Ancillary Program # of Targets in DR13 1 # of Total Targets 1,2 BITNAME binary digit value
Luminous AGN 1 267 AGN BAT 1 2
4 AGN OIII 2 4
Edge-On Star-forming Galaxies 4 166 EDGE ON WINDS 6 64 Close Pairs and Mergers 5 510 PAIR ENLARGE 7 128 10 PAIR RECENTER 8 256
1 PAIR SIM 9 512
1 PAIR 2IFU 10 1024 Massive Nearby Galaxies 1 310 MASSIVE 12 4096
Milky Way Analogs 2 250 MWA 13 8192
Dwarf Galaxies in MaNGA 2 247 DWARF 14 16384 Brightest Cluster Galaxies 2 378 BCG 17 131072 MaNGA Resolved Stellar Populations 1 4 ANGST 18 262144
1An individual galaxy can be targeted by more than one ancillary program.
2Number for each Ancillary Program refers to all targets in that program, regardless of bit name
a target was selected. The second part is the position within that catalog. For most galaxy targets the catalog id is 1 which refers to the NSA. For a small number of the early targets the catalog id is 12 and refers to an earlier version of the NSA (v1b 0 2). All galaxies from this earlier version of the NSA are also in the final version and so we release photometry etc for those targets from the final version of the NSA (v1 0 1), which is included in the data release. Other catalogs referred to in the first part of the manga-id are for SDSS standard stars.
The full data model for all MaNGA DRP data products can be found online at http://www.sdss.org/dr13/ manga/manga-data/data-model/ and is also given in Appendix B of L16.
6.3. Retrieving MaNGA Data
The raw data, reduced data, RSS, and 3-D data cubes for 1351 MaNGA galaxies are provided in DR13. From these data products, maps of line ratios, spectroscopic indices, and kinematics can be made using standard soft-ware. Because the first step in using the MaNGA data for science is to retrieve the spectra, we detail here and on the SDSS website4how to access the MaNGA spectra.
6.3.1. Reduced Data Products
MaNGA DR13 reduced data products are stored on the Science Archive Server athttp://data.sdss.org/sas/ dr13/manga/spectro/redux/v1_5_4/. The top level di-rectory contains the summary drpall FITS table and subdirectories for each plate. Inside each plate direc-tory there are subdirectories for each MJD on which the plate was observed, containing intermediate (exposure level) data products. The ‘stack’ subdirectory within each plate directory contains the final RSS and cube files for each MaNGA galaxy, sorted according to their plate-ifu identifiers. Note that the plate-ifu identifier in the filenames indicates the size of the IFU; everything in the 127 series (e.g., 12701) is a 127-fiber bundle, etc. The 700 series ifus (e.g., 701) are the twelve spectrophotometric 7-fiber minibundles that target stars on each plate.
These are the ways of getting at the data in DR13:
• Direct html browsing of the SAS at the above link. The file drpall-v1 5 4.fits can be downloaded
4http:www.sdss.org/dr13/manga/manga-data/data-access/
through the web browser and queried using any program able to read FITS binary tables. Once a set of galaxies of interest has been identified, in-dividual data cubes, summary RSS files, interme-diate data products, etc. can be downloaded by browsing through the web directory tree.
• Large downloads of many DRP data prod-ucts can be automated using rsync access to the SAS. For instance, to download all MaNGA data cubes with a logarithmic wave-length format: \rsync-aLrvz--include"*/ "--include"manga*LOGCUBE.fits.
gz"--exclude"*"rsync://data.sdss.org/ dr13/manga/spectro/redux/v1_5_4/./
• The MaNGA drpall file can also be queried on-line using the SDSS CASJobs system at http: //skyserver.sdss.org/casjobs. While this can be useful for identifying MaNGA observations of interest, CASJobs does not contain links to the MaNGA data cubes and another method must be used to download the data themselves.
• The SDSS SkyServer Explore tool at http:// skyserver.sdss.org/dr13/en/tools/explore/ will display basic information about MaNGA observations in DR13 that fall within a given cone search on the sky. The relevant explore pages also provide direct links to the FITS data cubes on the SAS.
6.3.2. Raw Data
All MaNGA data taken in the first year of SDSS-IV observations are part of Data Release 13, in-cluding data from special ancillary plates and co-observing during APOGEE-2 time that are not part of the DRP results. The raw data are stored on the SAS in the directory http://data.sdss.org/sas/ dr13/manga/spectro/data/ in subdirectories based on the MJD when the data were taken. The mangacore directory5 contains the information needed to figure out
the RA and Dec positions of fibers on plates, the dithered MJDs to be combined to make the final spectrum in
5