Full Terms & Conditions of access and use can be found at
http://www.tandfonline.com/action/journalInformation?journalCode=laps20
Download by: [University of Sheffield] Date: 04 November 2015, At: 07:37
Applied Spectroscopy Reviews
ISSN: 0570-4928 (Print) 1520-569X (Online) Journal homepage: http://www.tandfonline.com/loi/laps20
Sensitivity Advantage of QCL Tunable-Laser
Mid-Infrared Spectroscopy Over FTIR Spectroscopy
David T. D. Childs, Richard A. Hogg, Dmitry G. Revin, Ihtseham Ur Rehman,
John W. Cockburn & Stephen J. Matcher
To cite this article: David T. D. Childs, Richard A. Hogg, Dmitry G. Revin, Ihtseham Ur Rehman, John W. Cockburn & Stephen J. Matcher (2015) Sensitivity Advantage of QCL Tunable-Laser Mid-Infrared Spectroscopy Over FTIR Spectroscopy, Applied Spectroscopy Reviews, 50:10, 822-839, DOI: 10.1080/05704928.2015.1075208
To link to this article: http://dx.doi.org/10.1080/05704928.2015.1075208
© 2015 The Author(s). Published by Taylor & Francis.© David T. D. Childs, Richard A. Hogg, Dmitry G. Revin, Ihtseham Ur Rehman, John W. Cockburn, and Stephen J. Matcher
Accepted author version posted online: 28 Jul 2015.
Submit your article to this journal
Article views: 260
View related articles
Sensitivity Advantage of QCL Tunable-Laser
Mid-Infrared Spectroscopy Over FTIR Spectroscopy
DAVID T. D. CHILDS,
1RICHARD A. HOGG,
1DMITRY G.
REVIN,
2IHTSEHAM UR REHMAN,
3JOHN W. COCKBURN,
2AND STEPHEN J. MATCHER
31Department of Electronic and Electrical Engineering, University of Sheffield,
Sheffield, UK
2Department of Physics and Astronomy, University of Sheffield, Sheffield, UK 3
Department of Materials Science and Engineering, University of Sheffield, Sheffield, UK
Abstract: Interest in mid-infrared spectroscopy instrumentation beyond classical FTIR using a thermal light source has increased dramatically in recent years. Synchrotron, supercontinuum, and external-cavity quantum cascade laser light sources are emerging as viable alternatives to the traditional thermal black-body emitter (Globar), especially for remote interrogation of samples (“stand-off” detection) and for hyperspectral imaging at diffraction-limited spatial resolution (“microspectroscopy”). It is thus timely to rigorously consider the relative merits of these different light sources for such applications. We study the theoretical maximum achievable signal-to-noise ratio (SNR) of FTIR using synchrotron or supercontinuum light vs. that of a tunable quantum cascade laser, by reinterpreting an important result that is well known in near-infrared optical coherence tomography imaging. We rigorously show that mid-infrared spectra can be acquired up to 1000 times faster— using the same detected light intensity, the same detector noise level, and without loss of SNR—using the tunable quantum cascade laser as compared with the FTIR approach using synchrotron or supercontinuum light. We experimentally demonstrate the effect using a novel, rapidly tunable quantum cascade laser that acquires spectra at rates of up to 400 per second. We also estimate the maximum potential spectral acquisition rate of our prototype system to be 100,000 per second.
Keywords: Fourier transform spectroscopy, infra-red spectroscopy
Introduction
Recent years have seen a rapid growth in interest in combining vibrational spectroscopy with microscopy, especially in biology. Spatially resolved mapping of vibrational spectra
ÓDavid T. D. Childs, Richard A. Hogg, Dmitry G. Revin, Ihtseham Ur Rehman, John W. Cockburn, and Stephen J. Matcher. This is an Open Access article distributed under the terms of the Creative Commons Attribution License (http://creativecommons.org/licenses/by/3.0), which per-mits unrestricted use, distribution, and reproduction in any medium, provided the original work is properly cited. The moral rights of the named author(s) have been asserted.
Address correspondence to Stephen J. Matcher, Department of Materials Science and Engineer-ing, University of Sheffield, North Campus, Broad Lane, Sheffield S37HQ, UK. E-mail: S.J. [email protected]
822
ISSN: 0570-4928 print / 1520-569X online DOI: 10.1080/05704928.2015.1075208
can provide chemically resolved images of the distribution of key biological components, such as extracellular matrix proteins, nucleic acids, phospholipids, and so on (1). Many biological and medical applications exist for vibrational spectroscopy, deriving particular benefit from the label-free nature of the method, its nondestructiveness, and its ability to analyze comparatively small volumes of tissue. Movasaghi et al. published a comprehen-sive review both of applications and of the spectroscopic data (prominent absorption bands and their chemical origin) on which the applications are based (2). Diverse applica-tions include the rapid and automated detection of cancer cells in biopsy slides and micro-arrays, noninvasive measurement of glucose concentration in the skin, monitoring the hydration and lipid composition of the skin stratum corneum, the diagnosis of Alzheimer’s disease via spectral changes in central nervous system tissue, the detection of changes in rat brain microsomal membranes following a learning task, and the label-free discrimination between diverse microbial strains.
From a technical point of view, infrared microspectroscopy generally involves com-bining a single-point spectroscopy technique such as Raman or Fourier Transform Infra-red (FTIR) with some form of beam scanning to build up a 2-D image. Raman readily lends itself to this, because the excitation light source is a spatially coherent narrow-line laser that can readily be focused to a diffraction-limited spot. FTIR, on the other hand, originally evolved at a time when the mid-infrared (mid-IR) light source of choice was a spatially incoherent black-body and only single-element detectors were available. The sensitivity of FTIR comes from its multiplex (i.e., Fellgett) advantage relative to filtering the light source with a narrow-line monochromator (3). The lack of spatial coherence, however, is a major problem in high spatial resolution image acquisition, because the optical power per diffraction limited spot is low.
To overcome the spatial coherence barrier, a great deal of interest is currently directed toward synchrotron radiation (1). The synchrotron uses a beam of relativistic electrons to generate spatially coherent broad-band light with a spectrum extending from the x-ray to the far-IR. This is an ideal light source with which to illuminate an infrared microscope, because all the infrared power can be brought to a single, diffraction-limited focus. Recent work has shown how the mid-IR transmission spectra of individual cells can then be recorded, and if suitable algorithms are applied to separate absorption and scattering signals, excellent biochemically specific maps can be produced (4).
Synchrotron radiation is clearly impractical for the majority of lab-based experiments and all field-based work. Another type of source has recently gained attention, which is mid-infrared supercontinnum radiation (5). This approach is a direct extension of optical supercontinuum generation (6) and involves propagating a sub-ps laser pulse through a highly nonlinear medium, most practically a photonic crystal fiber. Mid-infrared super-continuum shares the high spatial coherence and broad bandwidth of synchrotron radia-tion, but in a table-top form factor. Sources using silica or fluoride fibre work best at the shorter end of the mid-infrared band, below 5 microns (7–8). Chalcogenide fiber can gen-erate supercontinuum up to 10mm, covering a major part of the biological “fingerprint” region (9).
In recent years, however, another potential light source has been developed: the external-cavity tunable quantum cascade laser (EC-QCL; 10). This device possesses the high spatial coherence properties of synchrotron and supercontinuum radiation but is also a temporally coherent source—that is, it emits all its output power in a single narrow range of wavenumbers (<1 cm¡1typically). The device consists of a quantum-cascade laser gain chip placed inside a tunable external cavity, with the tuning element typically being a diffraction grating. By mechanically rotating the diffraction grating, the precise
center wavelength of the emission can be tuned across a broad range (>100 cm¡1 typi-cally). Interest in the use of such devices to characterize biological materials has increased dramatically in the last 5 years. In part this has doubtless been driven by the commercialization of lasers (e.g., MIRCAT, Daylight Solutions Inc., San Diego USA; and LaserTune, Block Engineering Inc., Marlborough, USA) and recently complete microscope systems (e.g., SperoÒ IR microscope, Daylight Solutions Inc.). Using in-house EC-QCL devices, Lambrecht et al. demonstrated multiple applications for devices with»100 cm¡1tuning ranges, including fiber evanescent field absorption spectroscopy, vibrational circular dichroism, and photothermal emission spectroscopy (11). Combining such sources with microscopy allows the spatial mapping of vibrational spectra. Recently Kr€oger-Lui et al. performed infrared hyperspectral imaging of histological sections of mouse colon tissue using a Daylight Solutions Inc. tunable EC-QCL (12). The spectral acquisition time of 11.3 seconds allowed an entire 3£3 mm section to be imaged in 7.5 minutes using an uncooled microbolometer array detector. The spectral information at each pixel allowed the label-free identification of goblet cells. The same group used a similar system to perform label-free imaging of mouse jejunum, imaging a 3.1£2.8 mm histological slice in 5 minutes (13). This compares favorably with the time required to image the sample using an FTIR microscope equipped with a cooled 64£64 Mercury Cadmium Telluride (MCT) Focal Plane Array (FPA) (17 minutes for a 0.17£0.17 mm area). After accounting for the much larger spectral coverage of the FTIR (1000 cm¡1vs. 60 cm¡1), they nonetheless conclude that the QCL plus microbolometer solution would deliver the same spatio-spectral coverage£20 faster than the FTIR microscope. How-ever, no quantitative comparison of the actual spectral SNR achieved by the two systems was performed. Yet more recently, a newer commercial EC-QCL, the LaserTune (Block Engineering Inc.), has been used for infrared microspectroscopy. This device incorporates a different cavity tuning mechanism to reduce the spectral acquisition time to 3 seconds (14). By combining this laser with a 2-D MCT focal plane array detector, full hyperspec-tral data sets covering 0.25£0.25 mm spatially and 1000 cm¡1 spectrally could be obtained in 3 seconds. The authors went on to compare the SNR achievable by their EC-QCL system, versus a conventional imaging FTIR microscope also using an FPA detector (Stingray 620-IR, Agilent Inc., Santa Clara, CA, USA). By applying corrections for dif-fering pixel sizes and integration times, they concluded that their home-built EC-QCL microscope was£2 faster than the FPA-based Stingray FTIR system, given identical spa-tio-spectral coverage. They also pointed to a major potential advantage of the EC-QCL in that it can readily achieve spectral scans over small, targeted regions, whereas such tar-geted spectral scanning is harder to achieve by FTIR. If the information content is highly localized in the spectral domain, large increases in throughput can be achieved. Bassan et al. showed that a SperoÒmicroscope is able to collect single-wavenumber images of a breast tissue microarray that contains more than 26 million spectra in 540 seconds, com-pared with more than 17 hours using an FTIR microscope (15). This allowed an entire biopsy sample covering an area of 20£24 mm to be imaged with 4 micron pixel size in 9 minutes. Obviously, however, it is difficult to compare this fairly against the FTIR microscope, because only a single wavelength is collected, whereas the FTIR system pro-duces a true spectrum at each pixel. It is thus not clear how much chemical discrimination accuracy will be sacrificed by relying on single-wavenumber images. More wavenumbers can be added by stepping the emission wavenumber of the tunable laser obviously, with the 9 minute acquisition time then increasing proportionally with the number of addi-tional wavenumbers.
This highlights an obvious limitation of these previous studies in that they compare dissimilar systems—that is, both the source and detector in the QCL-based systems are different to those in the FTIR systems, as is the spectral range of the information. This makes a quantitative performance comparison difficult. They also do not address the issue of whether benchtop supercontinuum sources are likely to mitigate the disadvantages of thermal sources for FTIR imaging.
One of the goals of this article is to quantitatively and theoretically analyze the spectral SNR that can be achieved by the EC-QCL approach relative to FTIR. We draw attention to a major advantage that is possessed by the EC-QCL over FTIR by means of an analogy with near-infrared optical coherence tomography (OCT) imag-ing. In 2003 it was discovered that first-generation time-domain OCT was orders of magnitude less sensitive than frequency-domain OCT. We point out that time-domain OCT is a direct analogue of FTIR spectroscopy, whereas frequency-domain OCT is a direct analogue of EC-QCL spectroscopy. This means that the narrow spectral line-width of the EC-QCL fundamentally brings a spectral SNR advantage over broad-band sources, even if all other parameters are identical (spatial coherence of the source, detector size and specific detectivity, spectral coverage, and total light inten-sity onto the sample). Our results suggest that current QCL sources are probably not yet achieving their full potential, and that further optimization of source intensity noise will bring additional performance gains.
A second goal is to extend the analogy with OCT in the direction of EC-QCL source development. We demonstrate a class of EC-QCL, based entirely on commercially avail-able components, in which the spectral acquisition rate is made much higher than in com-mercially available sources. By constructing a Littmann-cavity EC-QCL, we demonstrate spectral acquisition rates of up to 400 Hz and provide evidence that this could potentially be increased to 100 kHz,£500 to£100,000 faster than in current commercial EC-QCLs. By analogy with OCT we describe this source as a “mid-infrared swept laser.” We use our mid-IR swept-laser to demonstrate the aforementioned spectral SNR advantage experimentally, using identical detector noise levels and source intensity.
Our results provide a quantitative goal toward which EC-QCL spectroscopy can aim, thereby delivering its maximum theoretical performance level.
Multiplex vs. Multi-Channel Spectral SNR
Transmission mid-IR spectroscopy measures the absorbance of a sample in absorbance units (AU), which are also known as optical densities (OD) and are calculated by the equation absorbance (AU)Dlog10(I0/I), whereI0is the intensity of the illuminating beam
andIthat of the transmitted beam. If overall noise is dominated by measurement noise on I(denotedsI), then the baseline absorbance noise in AU (i.e., the fluctuation seen on a 100% transmissive sample)sAUD0.434sI/I. Hence the absorbance noise is essentially the reciprocal of the SNR figure-of-merit, defined as the ratio of the total detectable power emanating from the sample divided by the noise on the measurement of the transmitted power. In the UV to NIR spectral region, the measurement noise is often dominated by shot noise on the detected power. In the mid-IR, however, the measurement noise is gen-erally receiver-noise limited and so is independent of the signal amplitude. The receiver noise itself is generally limited by noise in the infrared detector and generally is found to scale as the square-root of the detector area (16), leading to the introduction of the specific detectivityD* (cmxHz W¡1) as a figure by which to compare different infrared detector materials.
The classic formula for the SNR of an FTIR spectrometer illuminated by a black-body is generally quoted as follows (17):
SNRDUnð ÞT uDnD t1=2ξ
A1D=2
(1)
whereUvð ÞT is the spectral radiance of the black-body (W cm¡1sr¡1) whose absolute
temperature is T, u is the system optical etendue (cm2sr), Dn is the spectral resolution (cm¡1),tis the spectral acquisition time (s),ξ is the optical efficiency (0 to 1.0), andADis the detector area (cm2). The product on the numeratorUnuξis the continuous radiant inten-sity falling on the detector, per unit bandwidth. If, for simplicity, we assume thatUis inde-pendent of n (as thermal sources are typically far broader in bandwidth than the measurement window) and that the FTIR interferogram is recorded using radiation that spans a total ofNspectral bins, each of bandwidthDn, then the productUnuDnξ is simply fe/N, wherefeis the total radiant flux (W) falling onto the detector. In FTIR spectroscopy,
this flux has been passed through a Michelson interferometer equipped with a scanning mir-ror before illuminating the sample, and this flux is then recorded by a single-element infra-red detector. The detector records an interferogram atNequally spaced temporal sample points during the mirror scan, with each point thus being sampled for a period oft/Ni.e. with a measurement bandwidthBDN/t. BecauseA1D=2=Dis simply the noise-equivalent-power of the detector (W/xHz) and henceA1D=2B1=2=D is the noise standard deviations (W) generated during the sample period, for the FTIR spectrometer the SNR D fe= N1=2s
.
An alternative scheme to measure the N-point spectrum is using a tunable laser whose linewidth isDnand which is tuned over the spectral rangeNDn. Because the laser emits the radiant fluxfeinto this narrow bandwidth, it has a spectral powerfn(W cm) that is£Nhigher than that of a synchrotron or supercontinuum source of identical spatial coherence but that emits this radiant flux over the entire spectral rangeNDn. TheN-point spectrum is thus recorded directly (i.e., without Fourier-transforming an interferogram) by sampling the detector atNtemporal sample points. If the spectrum is collected in the same overall time t as for the previous FTIR case, the measurement bandwidth B is unchanged and hence so too is the value ofs. The SNR at a single spectral point is thus given simply by SNRDfe=s. This is clearly higher than the FTIR result by£N1=2. From equation (1) it is clear that, iffeis unchanged, then for the FTIR instrument to match the SNR of the tunable-laser spectrometer the acquisition timetmust be increased by£N. Typically, infrared spectra might be collected over a range of 1000 to 3000 cm¡1. With a resolution of 2 cm¡1Ncan potentially reach 103, and in these circumstances a tunable laser could acquire spectra of identical SNR to an FTIR instrument£1000 faster using the same detected radiant flux onto the same detector.
Relationship to Optical Coherence Tomography (OCT)
This important result has previously been recognized in the related field of near-infrared OCT (18). OCT is a reflection-mode biomedical imaging modality: an optical analogue of ultrasound imaging (19). OCT uses a near-infrared source of broad spectral bandwidth (typically about 600 cm¡1), centered around 12,000 cm¡1or 8,000 cm¡1, depending on the application, to illuminate a specimen and detect backscattered light. In this part of the spectrum absorption is very weak and OCT mainly relies on scattering of radiation from
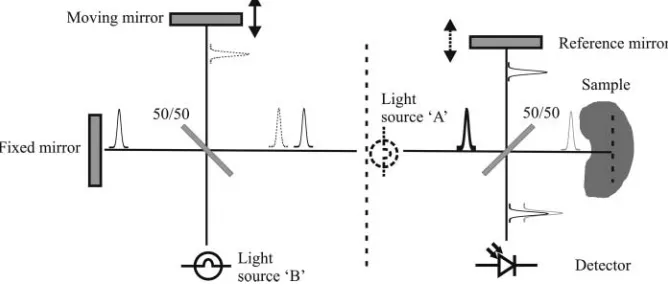
refractive index discontinuities between cell membranes and cytoplasm, for example. Radiation penetration depths into biological tissue are over 1 mm, typically£100 higher than in the mid-infrared. OCT was first applied in the “time-domain” form (TD-OCT). The light source is either a superluminescent diode or supercontinuum source, the high spatial coherence of which allows the efficient illumination of a diffraction-limited spot on the tissue. The low temporal coherence implied by the broad spectrum is used to gen-erate depth-resolved information by illuminating a Michelson interferometer, one arm of which is terminated by the sample and the other by a reference mirror. The right-hand side of Figure 1 shows the arrangement (with the superluminescent source at position “A”). Coherence theory tells us that the light beam consists of a sequence of short coher-ent wavepackets and that interference on the detector can only occur when idcoher-entical wavepackets from the sample and reference arms overlap. Hence, only radiation back-scattered from a particular depth in the sample (i.e., path length matched to the reference mirror) generates interference and is thus included in the measurement. In TD-OCT the reference mirror is mechanically moved and this moves the “coherence gate” down into the sample, thus generating a depth-resolved profile of backscattered light intensity over a depth range of»1mm typically.
An alternative approach is so-called “Fourier-domain” OCT (FD-OCT). This approach reinterprets OCT as a spectroscopic measurement. If the reference mirror is kept stationary, then the spectrum of radiation on the detectorPð Þn is related to the source spectrumSð Þn by the formula:
Pð Þn /Sð Þn 1C
Z
1¡ 1 ffiffiffiffiffiffiffiffiffi
R zð Þ
p
cos 4ð pnzÞdz
0 @
1
A; (2)
[image:7.504.86.420.440.583.2]wherezis axial depth into the sample, measured from the point of zero path length differ-ence relative to the referdiffer-ence mirror, andR(z) is the intensity reflection coefficient of the sample versus depth. The modulations present on Pð Þn (known as the “channelled
Figure 1.Schematic diagram showing the relationship between FTIR spectroscopy and OCT. OCT can be viewed as a spectroscopic measurement of the “channelled spectrum” of the interferometer on the right. Time-domain OCT involves measuring this spectrum using an FTIR approach of multi-plexing all wavenumbers simultaneously. Swept-source Fourier-domain OCT interrogates wave-numbers sequentially and is typically£100¡ £1000 faster with no SNR loss.
spectrum”) encode the cosine-transform of the image informationR(z). Hence, FD-OCT involves Fourier-transforming the measured channelled spectrum. The channelled spec-trum itself can be measured sequentially using a tunable laser or in parallel using a dif-fraction grating and linear detector array (20). In both cases it is well established that a reflecting surface can be detected with identical SNR to a TD-OCT system and using the same illumination power and receiver noise in a time that is£Nshorter.
In some TD-OCT applications it is inconvenient to move the reference mirror (e.g., because the entire interferometer is miniaturized, incorporated into the distal end of an endoscopic probe, and coupled to the source and detector via fiber-optics). In that case the use of a second “read-out” interferometer has been suggested, as shown on the left of Figure 1 with the light source now moved to position “B” (21). The light beam illuminat-ing the second (“sensilluminat-ing”) interferometer now contains two identical but temporally shifted trains of wavepackets: a “leading” wavepacket and a “trailing” wavepacket. When the illuminating beam is now split by the sensing interferometer it becomes possi-ble to generate an interference signal by overlapping, for example, the trailing wave-packet reflected from the fixed reference mirror with the leading wavewave-packet reflected from a given plane in the sample. Depth-scanning of the coherence gate is then achieved by scanning the reference mirror of the read-out interferometer and recording the result-ing interferogram on the detector of the sensresult-ing interferometer. This clearly amounts to measuring the channelled spectrum using an FTIR approach, which makes the connection between OCT and our previous calculations explicit.
Design of an Experimental Demonstration
To illustrate the SNR advantage we have constructed a system that, using the same light source and detector, can be configured as either a tunable-laser or FTIR spectrometer. The light source is an in-house EC-QCL constructed around a QCL laser chip grown and processed at the EPSRC National Centre for III-V Technologies at Sheffield. The active medium of the laser gain chip is a ridge waveguide structure 3 mm in length fabricated from an InP based AlInAs/InGaAs heterostructure material in order to lase around 7.8 microns with a bandwidth of around 60 cm¡1. This material and waveguide structure has not been optimized for broad-band operation and was selected purely because of availability (having been used to fabricate narrowly tunable QCL’s for gas sensing).
In order to avoid excessive heating, the gain chip is operated in a pulsed mode with low (0.05%) duty cycle. 100 ns pulses are generated at a rate of 5 kHz using a Avtech AVO-5A1 pulsed current source (8A max output into 50V load). The pulse repetition rate is currently limited by the available power supply.
The gain chip is placed in a Littman external cavity formed by the back facet of the waveguide at one end and a diffraction grating (100 lines per mm, 10.6mm blaze) directing its first diffracted order onto a galvanometer scanner (model 6240H, Cambridge Technology Inc., Bedford, MA, USA) at the other (Figure 2). Light is coupled into and out of the gain chip using chalcogenide-glass NA0.56 aspheric lenses (Thorlabs Inc., Newton, NJ, USA). Both facets of the ridge waveguide are coated with a broad-band antireflection coating (Helia Photonics Ltd, Livingstone, UK) in order to increase the current threshold for self-lasing by the active due to reflections from the waveguide facets (Fabry-Perot modes). Front and back facet reflectivities of 0.14% and 0.03%, respectively, were measured. By operating above the threshold for external-cavity lasing but below the threshold for Fabry-Perot lasing, tun-ability across the gain bandwidth is achieved at sweep rates of up to 400 Hz. The static line-width is measured to be 2 cm¡1across the running range. By using the source to illuminate a
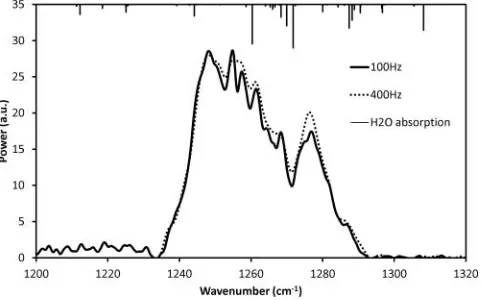
commercial FTIR whose mirror scan is made much slower than the tuning rate, we obtain measurements of the output power envelope at 100 Hz and 400 Hz (see Figure 3).
[image:9.504.90.423.63.241.2]The collimated EC-QCL output is split using a 50:50 IR beamsplitter, and the primary beam then illuminates a single-element MCT photovoltaic detector (PVI-4TE-8-0.2x0.2 Vigo Systems S.A, Ozarow Mazowiecki, Poland). This 4-stage Peltier-cooled device has aD* of 4£109Jones at 8 microns, 1.5 A/W responsivity and an 0.2£0.2 mm active area, hence an NEP of 5£10¡12W/xHz. The output photocurrent is amplified by
Figure 2.Schematic layout of our EC-QCL design. The tuning element is a conventional galva-nometer scanning mirror that can oscillate at up to 0.5 kHz, combined with a fixed diffraction grat-ing (i.e., a Littman cavity design). Radiation can be extracted both from the front facet and from the zeroth-order diffracted light from the grating. M1, 2: gold-coated beam folding and steering mirrors. L1,2: chalcogenide lenses. QCL: quantum cascade amplifier chip. DG: fixed diffraction grating. GM: moving galvanometer mirror.
Figure 3.The output spectrum of our prototype high-speed EC-QCL source, as measured using a commercial FTIR spectrometer. The spectrum is virtually identical for tuning speeds of either 100 Hz or 400 Hz, implying that the tuning speed is limited by our cavity tuning element, not by the laser gain chip. Apparent structure in the laser output spectrum largely results from atmospheric water vapor (principle water absorption bands from the HITRAN2012 database included for refer-ence). Apparent background between 1200 and 1285 cm¡1is an artefact of the FTIR system.
[image:9.504.134.375.428.578.2]an MIPDC-F-50 transimpedance detector with a transimpedance gain of 105 V/A and input noise current of<3.5 pA/xHz. Hence, the overall detector noise equivalent voltage at the output, which is dominated by the MCT detector element, is around 7.5mV/xHz. The beam path to the main detector passes through the object under test while the second beam can optionally be detected by another, matched detector. This arrangement allows for the potential reduction of noise due to pulse-to-pulse power fluctuations (e.g., fluctua-tions in the driving current source) by normalizing the first detector output by that of the second. In practice we found such an arrangement to be less effective than hoped, possi-bly because a nonideal beam quality led to different split ratios as a function of wavenum-ber and from pulse to pulse. Consequently, our measurements are unnormalized and include an effective pulse-to-pulse intensity standard deviation of around 4%.
The first measurement protocol is tunable-laser acquisition, in which we directly obtain the wavenumber of a pulse via its time of occurrence relative to the cavity tuning drive wave-form. With a pulse rate of 5 kHz and a cavity tuning rate of 100 Hz, we have 50 wavenumber sample points per spectrum. Because the EC-QCL sweeps from 1240 to 1290 cm¡1, these points are separated by 1 cm¡1and thus oversample the 2 cm¡1 linewidth by about£2. Although there is nominal synchronization between the cavity tuning and the pulsing of the laser (the pulsed current source is externally triggered using a pulse train synchronized with the galvanometer mirror drive waveform), the extremely low duty-cycle of the pulses could intro-duce errors if sampled at a rate comparable with the pulse repetition rate. Instead, the detector output (signal bandwidth 50 MHz) is digitized at 500 MSPS by a Alazartech model 9350 12-bit ADC (Alazartech Inc., Pointe-Claire, QC, Canada), and software-based pulse recognition and box-car averaging is used to circumvent this problem. The resultant data set represents the detected flux in sequential time intervals at 5 kHz rate, with each interval containing a single pulse. Successive laser sweeps are then further averaged to boost the SNR. We average 30,000 scans, corresponding to 300 seconds total acquisition time.
The second acquisition mode simulates FTIR spectroscopy. In this mode the wavenumber information carried by the pulse occurrence time is not used and the pulses are simply used to measure the brightness of the interferogram vs mirror position. Strictly, FTIR relies on a source that illuminates the sample with all wavenumbers simultaneously. We can approximate this by ensuring that the laser sweep rate is substantially higher than the time between successive tem-poral samples of the FTIR interferogram. The EC-QCL output is used to illuminate a Michel-son interferometer with one mirror mounted on a motor stage. In order to obtain 1.0 cm¡1 resolution in the FTIR spectrum, an interferogram must be recorded while the mirror is trans-lated over a distance of 0.5 cm. For this to span 1500 cm¡1in the positive half-space of the cosine transform we must acquire 3000 points. We choose a sampling time of 0.1 seconds in the interferogram. The total acquisition time is thus 300 s, during which the mirror moves at 0.00167 cm s¡1. The laser thus sweeps an order or magnitude faster than the rate at which the interferogram is sampled. Such a variation of laser wavenumber during the interferogram sam-pling interval can be shown to have a negligible effect on the resulting measured spectrum. In conventional FTIR, the mirror moving at speed v encodes wavenumberyvia the harmonic fre-quency componentcosð2py2vtÞand hence the discrete spectrumIkis encoded via its discrete cosine transform: IlI lð ÞDt D
P
nkD0Ikcosð2pkDn2vlDtÞ, l D 1. . .n. Ik represents the mean spectral density averaged over thekth spectral window of spectral bandwidthDy. In our simulated FTIR mode, the spectrum is in the form of a tunable QCL laser that sweeps over a rangey0 toy0Cdn0 with a tuning ratefsweepand a pulse repetition frequencyfpulse.
Hence, within one sampling intervalDt the EC-QCL generatesm Dfsweep.Dtsweeps and
each sweep contains n D fpulse/fsweep sequential pulses, each representing a discrete
wavenumber. The relation for the detected flux averaged over thelthsample interval is thus modified to:
IlD
X
m¡1 jD0X
n¡1kD0Iðy0Cðk¡1Þdy0=nÞ
cos 2p y0ð Cðk¡1Þdy0=nÞ2v ðjnCkÞ=fpulse
ClDt
:
(3)
Apart from minor definitional differences, this clearly reverts to the previous cosine transform relationship in the limit that m, fsweep and fpulse!1 whilst fpulse/
fsweep Dn D const. In our case, however, the dependence on k of the time variable
after the ‘v’ term will introduce a form of dispersion or “chirp” into the transform that will distort the spectral shape. To evaluate the magnitude of this effect, we use MATLAB (Mathworks Inc., Natick, MA, USA) to perform this summation for the case that Ik is a unit-magnitude Gaussian spectrum centered on 1265 cm¡1 with a FWHM of 50 cm¡1and windowed to zero outside this range, hencey0D1240 cm¡1 anddn0D50 cm¡1,Dt D0.1 s,t
max D300 s, vD0.00167 cm s¡1,fsweepD 100 Hz
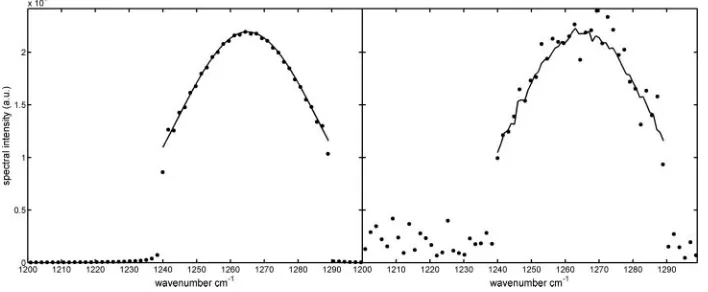
[image:11.504.78.432.411.557.2]andfpulseD5 kHz (mD10; nD50). We evaluateIlfor 3000 sample points and then calculate the FTIR spectrum by taking the absolute value of the FFT and discarding negative frequencies, yielding a 1500-point spectrum from 0 to 1500 cm¡1. For com-parison, we also calculate the emission spectrum by directly collecting the EC-QCL pulses. The left panel of Figure 4 compares these two different spectra (after normaliza-tion) over the range 1200 to 1300 cm¡1, and it is clear there is negligible difference between them. On the right is the result of performing this same calculation but now adding uniformly distributed random noise to the EC-QCL pulse train. The noise stan-dard deviation is£4 greater than the peak intensity of the Gaussian emission spectrum. The enhanced SNR of sequential wavenumber detection over multiplexed wavenumber
Figure 4.At left is a comparison between the simulated FTIR spectrum generated by illuminating the interferometer with a pulsed EC-QCL source (dots) and the emission spectrum collected by direct integration of the EC-QCL output pulse train (solid line). All parameters match those given in the experimental design (main text). At right is the same comparison after adding uniformly dis-tributed random noise to the EC-QCL pulse-train. The spectrum collected in the wavenumber multi-plexing (FTIR) mode shows considerably more noise fluctuation than the spectrum collected in the sequential wavenumber tuning mode, even though the same number of laser pulses are used in both cases.
detection is clear. The standard deviation about the mean is about£8 larger for the FTIR spectrum, in broad agreement with the expected value ofx50. This virtual exper-iment shows that our chosen experexper-imental parameters are capable of demonstrating the enhanced SNR of tunable laser spectroscopy over FTIR spectroscopy.
Experimental Results
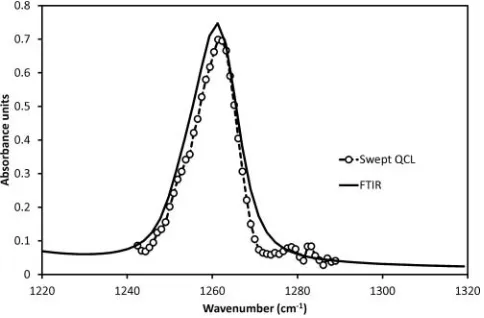
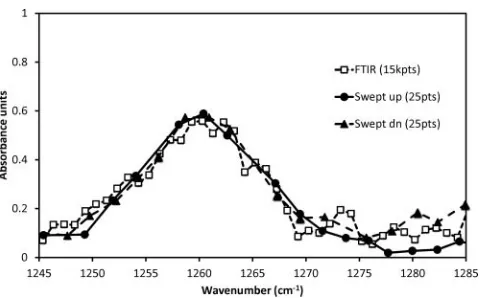
The simulated experiment was designed to be implementable experimentally using our EC-QCL. The spectral coverage of our EC-QCL laser is well matched to the absorption band of polydimethylsiloxane (PDMS) polymer. Hence, a test target was fabricated by spin-coating a 10mm thick layer of PDMS polymer onto an IR-transparent germanium substrate. A reference mid-infrared spectrum was collected using a commercial FTIR spectrometer. This sample was then placed in our home-built FTIR spectrometer and the reference arm blocked. The PDMS absorption spectrum was collected directly from the pulse train of the EC-QCL and using the wavenumber information provided by the pulse occurrence time. The spectra collected by the two instruments were in excellent agree-ment, as shown in Figure 5.
This confirms that the EC-QCL device is capable of collecting accurate infrared spectra. Next we used exactly the same EC-QCL laser output pulses but now unblocked the reference arm of the FTIR interferometer. The EC-QCL pulses are used to record the interferogram using the parameters mentioned previously and the spectrum then calcu-lated using an inverse Fourier transform. Figure 6 shows the comparison of these two approaches.
[image:12.504.131.373.452.611.2]The three sets of spectra are visibly of comparable SNR. The curves with filled sym-bols are obtained by using the EC-QCL in its wavenumber tuning mode (the filled circles represent the external cavity tuning from low to high wavenumber, whereas the filled tri-angles represent the opposite). The close similarity of these curves shows that accurate spectra can be obtained on both the rising and falling slopes of the galvanometer drive waveform—that is, the spectral acquisition rate can be twice the mirror oscillation
Figure 5.The 1250 cm¡1absorption band of PDMS as measured by a commercial FTIR spectrom-eter (solid black line) and a single sweep of our high-speed EC-QCL laser (filled circles). Note that some residual H2O absorption affects the EC-QCL measurements but not the FTIR.
frequency. Some differences, especially in the 1270–1285 cm–1range, are possibly due to elevated noise levels arising from water absorption features.
[image:13.504.134.375.62.211.2]In this experiment the mirror was driven by a 100 Hz triangle wave; hence, we col-lected 25 pulses during one wavenumber sweep and the total effective acquisition time was thus 5 ms. To collect the curve with open squares, the Alazartech digitizer was oper-ated at its maximum sample rate of 500 MSPS and used to collect each laser pulse throughout the entire 300 s mirror movement. In order to avoid exceeding the maximum buffer size of the digitizer with a potential 300 GBytes of data, the card was operated in its “multiple record acquisition” mode, whereby each pulse from the EC-QCL current driver triggered a 256 sample acquisition into the digitizer, thus reducing the data size to 0.768 GBytes. A total of 1.5£106pulses were thus acquired. One problem with this set up is the comparatively slow FTIR mirror translation speed required. The linear d.c. motor that was used (model M-125.11, Physik Instrumente GmbH, Karlsruhe, Germany) to drive the translation stage exhibits nonlinearities at such low speeds, due to the physi-cal layout of the motor coils. This results in a variation in the instantaneous speed within each revolution while the average speed per full revolution remains constant. To avoid the effect of this on positioning error, and to allow the FTIR mode to achieve a fair com-parison, our interferometer was equipped with a helium-neon (HeNe) reference laser. Digitizing the fringes from the HeNe allowed us to locate the fringe zero crossings and, as these represent points of equidistant mirror movement, we chose to use only those EC-QCL laser pulses that occur close to a zero crossing. This limited subset of 15,800 pulses is used to estimate the FTIR interferogram. Applying an inverse Fourier transform to this interferogram yields the FTIR curve in Figure 6. Because the three curves are of compa-rable quality, we can conclude that the tunable laser delivered broadly the same SNR as the FTIR mode but using£630 fewer data points. This large difference likely reflects two effects. One is the practical difficulties in implementing FTIR, in which excellent interfer-ence contrast must be maintained (requiring careful beam alignment, polarization control, equidistant fringe sampling, etc.; 22). However the other is the£Nspeed advantage of tunable laser spectroscopy that we have highlighted here.
Figure 6.Absorption spectrum of PDMS as measured by the EC-QCL source operating in FTIR mode (dashed line and open squares) vs. in its sequential wavenumber tuning mode (solid line with filled circle and solid line with filled triangle). The spectra are of comparable SNR; however, in the latter case only 25 pulses from the EC-QCL were needed, whereas in the former case 15,000 pulses were used.
Potential Limits on Tuning Speed
Our EC-QCL readily achieved 400 Hz tuning rate without any particular optimization. The limitation was purely a result of (a) the maximum achievable speed of the galvanom-eter scanner mirror in our cavity design and (b) the 5 kHz maximum pulse repetition time of our QCL driver. Recently we became aware of work using a Littrow cavity EC-QCL based on a micro-opto-electro-mechanical system (MOEMS) diffraction grating that has achieved 1 kHz tuning rate (23). It is thus interesting to consider what factors might limit the maximum achievable tuning rate, especially considering that the SNR advantage of swept-laser OCT was originally demonstrated using a 300 Hz tuning rate and ushered in a series of technical innovations that have seen tuning rates reach 5 MHz (24).
[image:14.504.78.427.368.578.2]Researchers soon realized that, in near-infrared laser amplifiers, the dynamics of gain build-up in the external cavity place an upper limit on tuning rates, independent of the achievable speed of the external cavity tuning mechanism. As the external cavity tunes, the longitudinal mode that is currently lasing must switch off and a new mode must switch on. To do so, this new mode must build up its optical power from the weak sponta-neous emission background, and this requires that the light field oscillates around the cav-ity a certain number of times. The minimum time required to build up lasing at the new wavelength thus depends on (a) how many round-trips around the external cavity are needed to achieve the required light intensity and (b) how long each cavity round-trip takes. In turn (a) depends on how much amplification of the light field is achieved for each pass through the laser gain chip (including the optical losses of the cavity) and (b) depends on the physical length of the cavity.
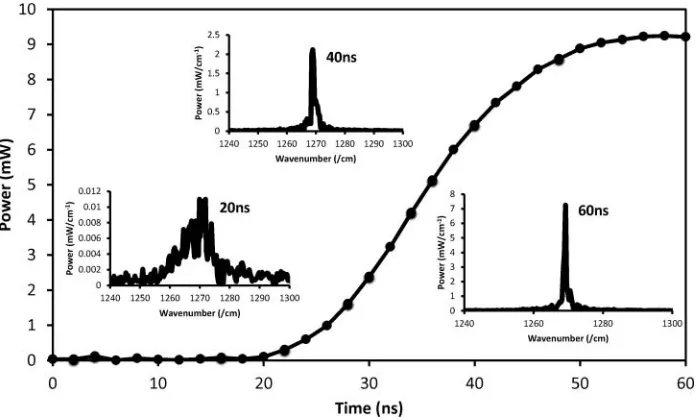
Figure 7.Time-resolved gain build up of a single pulse of our high-speed EC-QCL tunable laser following the application of a 100 ns current pulse. Also shown (insets) are the spectral evolution 20, 40, and 60 ns after the initial rising edge of the pulse. The 40 ns delay between the initial onset of lasing and full saturation of the output is thus 40 ns and represents an estimate of the time required to tune the source from one spectral point to the next, and suggests that 125 kHz tuning across 100 cm¡1of spectral range should readily be attainable.
Because our EC-QCL gain chip is pulsed, we can gain an insight into these factors by considering the time-resolved intensity and emission spectrum in a single laser pulse.
Figure 7 shows build up of optical power in our device following the application of a 100 ns current pulse. The pulse profile was measured using a fast MCT photovoltaic detector, which has a quoted rise time of<8 ns. Around 20 ns after the electronic pulse begins the light intensity due to lasing in the external cavity begins to dominate over amplified spontaneous emission (ASE), as evidenced by the narrowing of the emission line-width. After a further 40 ns (20 round-trips in the external cavity), the power satu-rates. Measurements made at higher gain (data not shown) show Fabry-Perot mode lasing due to feedback from facet reflections beginning at around 20 ns, which marks the time at which the current pulse effectively reaches the semiconductor gain material. We can therefore conclude that, as a worst case scenario, for this gain chip and this cavity length, it will take around 40 ns to switch off one wavelength and switch on the next. Thus, if we need to scan a 1000 cm¡1spectral range with 5 cm¡1increment, this will take approxi-mately 8ms and hence the spectral acquisition rate could reach 125 kHz. The experience gained with OCT swept sources suggests that this figure could be improved even further by shortening the external cavity or by increasing the net gain of the QCL amplifier.
Parallel Dispersive Multi-Channel Detection
FTIR spectroscopy was originally developed as a way of circumventing the lack of multi-element infrared array detectors, without the major loss of SNR implied by using a scan-ning monochromator. This is no longer a major limitation, as technical advances over the last two decades have yielded 1-D and 2-D array detectors with comparatively good per-formance (25). This makes dispersive parallel wavenumber detection feasible in the mid-infrared and hence a viable alternative to the EC-QCL approach discussed here. When coupled with recent advances in spatially coherent, broad-band mid-IR supercontinuum sources, this approach becomes particularly attractive for microspectroscopy. It is thus important to consider the merits of this approach compared to EC-QCL’s.
If a total radiant fluxfeis available, then the radiant flux per element is reduced tofe
/Nfor anN-element array. On the other hand, each pixel now integrates the signal for the full spectral acquisition timetrather thant/N, so the measurement bandwidth is reduced by a factor£N. Using the previous notation, wheresdenotes the noise standard deviation generated by a detector element in the timet/N, then for a spectral point measurement using the dispersive approach we have SNRDfe=N1=2s. This is identical to the result for the FTIR method in the case that the value ofsis the same. This in turn will be the case if the system is receiver-noise limited and if the detector size andD* are the same as for the FTIR approach. Practically it is difficult to make array elements smaller than about 40mm in the mid-infrared, and this can be matched to a diffraction-limited microscope voxel easily; hence, it is likely to be a value that is common to microscopes employing either approach. Where the dispersive approach performs better is when the radiant flux per element is sufficiently high (and/or D* sufficiently high) that photon shot noise becomes dominant. If the photon energy isEg and the detector quantum efficiency is 100%, then the shot-noise-limited noise standard deviation associated with a radiant flux fe and bandwidthBis
ffiffiffiffiffiffiffiffiffiffiffiffiffiffiffi 2EgfeB p
:Because both the radiant flux per pixel and the mea-surement bandwidth fall by£Nrelative to the tunable laser case, the noise standard devi-ation and signal both fall by£Nand the SNR is now identical to the tunable laser case. Hence, parallel dispersive wavenumber detection has the same SNR as multiplexed
detection when receiver noise dominates shot noise but enjoys the higher sensitivity of sequential wavenumber detection when photon shot noise dominates receiver noise.
In FD-OCT the choice between sequential and parallel wavenumber detection is largely a matter of convenience, because the SNRs are the same:D* is orders of magni-tude higher for near-infrared detectors and so optical shot noise (primarily on the refer-ence arm power) generally defines the noise floor. A popular rationale for choosing between them is that in tunable-laser FD-OCT the bulk of the engineering complexity goes into the light source, whereas in dispersive FD-OCT the bulk of the complexity goes into the detection system. Situations in which one wants to collect spectra in parallel from many discrete spatial locations are obvious cases where the tunable-laser approach offers a real practical advantage over the dispersive approach. In mid-IR spectroscopy, however, the choice is largely dependent on the absolute radiant fluxfethat is available
for the measurement. Parallel wavenumber detection enjoys an SNR advantage over mul-tiplexed FTIR detection only when the radiant flux per elementfe/Nproduces shot noise
that exceeds the receiver noise floor. It is thus likely that in low-flux regimes sequential detection will outperform parallel detection.
Discussion
The SNR of a spectral measurement is fundamentally higher when performed via multi-channel detection as compared with multiplexed detection. This gives tunable laser spec-troscopy a fundamental speed advantage over FTIR specspec-troscopy. It is perhaps worth reiterating that this advantage isin addition tothe high spatial coherence of the laser and the consequent ability to irradiate small areas with much higher intensities than when using a thermal source. It is also additional to another advantage of tunable laser spectros-copy, which is the ability to target specific narrow spectral ranges more flexibly than with FTIR spectrometers. It is a consequence of the much higher temporal coherence of the laser, and the advantage is still found even if a spatially coherent source such as a syn-chrotron or supercontinuum laser is used as the source in an FTIR microscope. It also occurs if identical spectral range and resolution are produced by both instruments.
NIR tunable-lasers do not have extremely high fractional tuning ranges by FTIR standards (900 cm¡1, i.e., around 12% of the center wavelength is typical); however, they have been optimized to offer extremely high tuning rates to allow volumetric OCT imaging at high speeds. In addition it is difficult in practice to fabricate individual NIR laser gain chips with a broad bandwidth out of semiconductor heterostructure material, because the amplification process is generated by interband transitions, the energy of which is determined by the band-gap. The band-gap is largely fixed by the composition and microstructure of the heterostructure. Although the heterostructure can be varied by appropriate fabrication steps, in practice it is difficult to combine different heterostruc-tures together in order to span a broad wavelength range in a single laser device. The sim-plest and most optically efficient way to combine heterostructures is to place them in series, so that the oscillating light field within the laser cavity passes through all regions during a cavity round-trip and is amplified by whichever heterostructure possesses gain at that wavelength. Unfortunately, interband transitions have the property that they are only transparent to radiation on the red side of the gain bandwidth: they are highly absorbing to radiation on the blue side. This introduces unacceptable cavity losses and prevents las-ing. However, the EC-QCL device exploits intersubband transitions between confined electronic states in the conduction band, and crucially these transitions are transparent to radiation on both the red and blue sides of the gain peak. It is therefore much more
practical to construct a sequence of dissimilar heterostructures and thus obtain very broad lasing bandwidths. Within our team we have previously demonstrated a gain medium design that exploits a series of 11 distinct active regions to produce gain from 6 to 8 microns (400 cm¡1) full-width at half maximum (FWHM) (26).
The SNR advantage demonstrated here can only be maximally exploited if laser intensity noise can be reduced to a level below the receiver noise floor. Pulsed QCL sources tend to show elevated levels of intensity noise, one reason being that pulsed current sources are not as stable as continuous sources. In our system this leads to a few % pulse-to-pulse fluctuations in intensity. Furthermore, mismatches in electrical impedance between the driver and the QCL chip causes ringing and overshoot of the current pulse waveform and hence adds more noise. The switching on of the drive current causes transient heating of the semiconductor material in the QCL, which changes both its gain and refractive index. Consequently, the phase, wavelength, and intensity of the optical pulse vary in a complex way on 100 ns timescales. The solu-tion to all of these less-than-ideal characteristics is to run the QCL in a continuous (c.w) mode rather than pulsed. c.w QCLs are more challenging to operate, due to much higher thermal dissipation requirements; however, they have been demon-strated operating at room temperatures (27), albeit with reduced tuning ranges rela-tive to pulsed QCLs.
FTIR spectroscopy emerged in the 1950s as a means to overcome the then major lim-itations of infrared sources and detectors, and it has remained the workhorse technique ever since. However, emerging technologies such as the external cavity quantum cascade laser now deserve serious consideration as alternative light sources for IR-spectroscopy in situations where high acquisition speeds are needed, optical throughput is low, or detector dynamic range is limited.
Conclusions
This article has emphasized the sensitivity advantage of mid-infrared tunable-laser spec-troscopy over FTIR specspec-troscopy via an analogy with near-infrared OCT. It is not an exaggeration to say that the move away from multiplexed (FTIR) detection to multichan-nel (tunable-laser or dispersive) detection has revolutionized OCT. The great sensitivity advantage of FD-OCT has driven a major technical effort in the design of high-speed tun-able lasers (“swept-lasers”) in the near-infrared. This effort has seen tuning rates, over> 600 cm¡1, reach several hundred kHz using external cavity designs (28) and multi-MHz using fiber storage ring approaches (24), while maintaining 10s of mW of output power and linewidths<2 cm¡1. A similar developmental effort applied to mid-infrared external cavity lasers will ascertain where the physical limits on tuning range and tuning rate lie. The inherent sensitivity advantage over FTIR spectroscopy may then make it the method of choice in many applications. Furthermore, the small size, low power consumption, and low cost possible from semiconductor laser systems make this an especially desirable technology in applications for which scalability beyond the laboratory is needed.
Acknowledgments
We thank Mr. Tom Patterson and Dr. Fred Claeyssens for help spin-coating PDMS onto germanium.
Funding
We acknowledge funding from EPSRC grant EP/K503563/1.
References
1. Hirschmugl, C.J., and Gough, K.M. (2012) Fourier transform infrared spectrochemical imag-ing: Review of design and applications with a focal plane array and multiple beam synchrotron radiation source.Appl. Spectrosc., 66: 475–491.
2. Movasaghi, Z., Rehman, S., and Rehman, I.U. (2008) Fourier transform infrared (FTIR) spec-troscopy of biological tissues.Applied Spectroscopy Revs., 43(2): 134–179.
3. Fellgett, P.B. The multiplex advantage, Ph.D. dissertation, 1951, University of Cambridge, Cambridge, UK.
4. Bassan, P., Kohler, A., Martens, H., Lee, J., Byrne, H.J., Dumas, P., Gazi, E., Brown, M., Clarke, N., and Gardner, P. (2010) Resonant Mie scattering (RMieS) correction of infrared spectra from highly scattering biological samples.Analyst, 135(2): 268–277.
5. Dupont, S., Petersen, C., Thogersen, J., Agger, C., Bang, O., and Keiding, S.R. (2012) IR microscopy utilizing intense supercontinuum light source. Opt. Express, 20(5): 4887–4892.
6. Wadsworth, W.J., Ortigosa-Blanch, A., Knight, J.C., Birks, T.A., Man, T.P.M., and Russell, P.S. (2002) Supercontinuum generation in photonic crystal fibers and optical fiber tapers: a novel light source.JOSA B, 19(9): 2148–2155.
7. Belal, M., Xu, L., Horak, P., Shen, L., Feng, X., Ettabib, M., Richardson, D.J., Petropoulos, P., and Price, J.H.V. (2015) Mid-infrared supercontinuum generation in suspended core tellurite microstructured optical fibers.Opt. Lett., 40(10): 2237–2240.
8. Kedenburg, S., Steinle, T., Morz, F., Steinmann, A., and Giessen, H. (2015) High-power mid-infrared high repetition-rate supercontinuum source based on a chalcogenide step-index fiber.
Opt. Lett., 40(11): 2668–2671.
9. Yuan, W. (2013) 2–10mm mid-infrared supercontinuum generation in As2Se3photonic crystal
fiber.Laser Phys. Lett., 10: 095107.
10. Hugi, A., Maulini, R., and Faist, J. (2010) External cavity quantum cascade laser.Semicond. Sci. Technol., 25: 083001.
11. Lambrecht, A., Pfeifer, M., Konz, W., Herbst, J., and Axtmann, F. (2014) Broadband spectros-copy with external cavity quantum cascade lasers beyond conventional absorption measure-ments.Analyst, 139: 2070–2078.
12. Kr€oger-Lui, N., Gretz, N., Haase, K., Kr€anzlin, B., Neudecker, S., Pucci, A., Regenscheit, A., Sch€onhals, A., and Petrich, W. (2015) Rapid identification of goblet cells in unstained colon thin sections by means of quantum cascade laser-based infrared microspectroscopy.Analyst, 140: 2086–2092.
13. Kr€oger, N., Egl, A., Engel, M., Gretz, N., Haase, K., Herpich, I., Kr€anzlin, B., Neudecker, S., Pucci, A., Sch€onhals, A., Vogt, J., and Petrich, W. (2014) Quantum cascade laser-based hyper-spectral imaging of biological tissue.J. Biomed. Opt., 19(11): 111607.
14. Yeh, K., Kenkel, S., Liu, J.-N., and Bhargava, R. (2015) Fast infrared chemical imaging with a quantum cascade laser.Anal. Chem., 87, 485¡493.
15. Bassan, P., Weida, M.J., Rowlette, J., and Gardner, P. (2014) Large scale infrared imaging of tissue micro arrays (TMAs) using a tunable Quantum Cascade Laser (QCL) based microscope.
Analyst, 139(16): 3856–3859.
16. Nudelman, S. (1962) The detectivity of infrared photodetectors.Appl. Opt., 1(5): 627–635. 17. Griffiths, P.R., and de Haseth, J.A. (2007)Fourier transform infrared spectrometry, 2nd ed.
John Wiley, New York, p. 172.
18. Choma, M., Sarunic, M.V., Yang, C., and Izatt, J.A. (2003) Sensitivity advantage of swept source and Fourier domain optical coherence tomography.Opt. Express, 11(18): 2183–2189.
19. Tomlins, P.H., and Wang, R.K. (2005) Theory, developments and applications of optical coher-ence tomography.J. Phys. D: Appl. Phys., 38: 2519–2535.
20. Leitgeb, R., Hitzenberger, C.K., and Fercher, A.F. (2003) Performance of Fourier domain vs. time domain optical coherence tomography.Opt. Express, 11(8): 889–894.
21. Oh, W.Y., Bouma, B.E., Iftimia, N., Yelin, R., and Tearney, G.J. (2006) Spectrally-modulated full-field optical coherence microscopy for ultrahigh-resolution endoscopic imaging. Opt. Express, 14(19): 8675–8684.
22. Birch, J.R., and Clarke, F.J.J. (1995) Fifty categories of ordinate error in Fourier transform spectroscopy.Spectroscopy Europe, 7(4): 16–22.
23. Grahmann, J., Merten, A., Herrmann, A., Ostendorf, R., Bleh, D., Drabe, C., and Kamenz, J. (2015) Large MOEMS diffraction grating results providing an EC-QCL wavelength scan of 20%.Proc. SPIE, 9375, 93750W, doi:10.1117/12.2079640.
24. Wieser, W., Biedermann, B.R., Klein, T., Eigenwillig, C.M., and Huber, R. (2010) Multi-mega-hertz OCT: High quality 3D imaging at 20 million A-scans and 4.5 GVoxels per second.Opt. Express, 18(14): 14685–14704.
25. Rogalski, A., Antoszewski, J., and Faraone, L. (2009) Third-generation infrared photodetector arrays.J. Appl. Phys., 105: 091101.
26. Zibik, E.A., Ng, W.H., Revin, D.G., Wilson, L.R., Cockburn, J.W., Groom, K.M., and Hopkin-son, M. (2006) Broadband 6 micron λ<8 micron superluminescent quantum cascade light-emitting diodes.Applied Physics Lett., 88: 121109.
27. Mohan, A., Wittmann, A., Hugi, A., Blaser, S., Giovannini, M., and Faist, J. (2007) Room-tem-perature continuous-wave operation of an external-cavity cascade laser. Opt. Lett., 32: 2792–2794.
28. Oh, W.Y., Vakoc, B.J., Shishkov, M., Tearney, G.J., and Bouma, B.E. (2010)>400 kHz repeti-tion rate wavelength-swept laser and applicarepeti-tion to high-speed optical frequency domain imag-ing.Opt. Lett., 35(17): 2919–2922.