This is a repository copy of
Establishing reference intervals for bone turnover markers in
healthy postmenopausal women in a nonfasting state.
.
White Rose Research Online URL for this paper:
http://eprints.whiterose.ac.uk/84570/
Version: Accepted Version
Article:
Gossiel, F., Finigan, J., Jacques, R. et al. (5 more authors) (2014) Establishing reference
intervals for bone turnover markers in healthy postmenopausal women in a nonfasting
state. Bonekey Reports, 3. 573. - .
https://doi.org/10.1038/bonekey.2014.68
eprints@whiterose.ac.uk https://eprints.whiterose.ac.uk/ Reuse
Unless indicated otherwise, fulltext items are protected by copyright with all rights reserved. The copyright exception in section 29 of the Copyright, Designs and Patents Act 1988 allows the making of a single copy solely for the purpose of non-commercial research or private study within the limits of fair dealing. The publisher or other rights-holder may allow further reproduction and re-use of this version - refer to the White Rose Research Online record for this item. Where records identify the publisher as the copyright holder, users can verify any specific terms of use on the publisher’s website.
Takedown
If you consider content in White Rose Research Online to be in breach of UK law, please notify us by
1
This is the accepted version of the following article:
F Gossiel, J Finigan, R Jacques, D Reid, D Felsenberg, C Roux, C Glueer, R Eastell. Establishing
reference intervals for bone turnover markers in healthy postmenopausal women in a
nonfasting state. BoneKEy Reports 2014; 3:573.
doi:10.1038/bonekey.2014.68
which has been published in the final form at
2
Establishing reference intervals for bone turnover markers in healthy postmenopausal
women in a nonfasting state
Fatma Gossiel1, Judith Finigan1,Richard Jacques1, David Reid 2, D Felsenberg3,Christian Roux4 Claus Glueer5, Richard Eastell1
1
University of Sheffield, Sheffield, UK 2
Univerity of Aberdeen, Aberdeen, UK 3
Charite Universitatsmedizin, Germany 4
Rene Descartes Universite, France 5
Universitatsklinikum Schleswig-Holstein, Germany
Corresponding author:
F Gossiel
Department of Human Metabolism University of Sheffield
Beech Hill Road Sheffield South Yorkshire S10 2RX
Email: f.gossiel@sheffield.ac.uk
3
Abstract
In order to interpret bone turnover markers (BTMs), we need to establish healthy reference intervals. It is difficult to establish reference intervals for older women because they commonly suffer from diseases or take medications that affect bone turnover. The aims of this study were: (1) to identify diseases and drugs that have a substantial effect on BTMs; (2) to establish reference intervals for premenopausal and postmenopausal women; and (3) to examine the effects of other factors on BTMs in healthy postmenopausal women. We studied women aged 30 39 years (n = 258) and women aged 55 79 years (n = 2419) from a five-European centre population-based study. We obtained a nonfasting serum and second morning void urine samples at a single baseline visit. BTMs were measured using automated immunoassay analysers. BTMs were higher in patients with vitamin D deficiency and chronic kidney disease. Three or more BTMs were higher in women who were osteoporotic and at least two BTMs were lower in women who were oestrogen replete, taking osteoporosis treatments or having diseases known to affect bone turnover. These were used as exclusion criteria for selecting the populations for the reference intervals. The reference intervals for BTMs were higher in postmenopausal than premenopausal women. Levels of BTMs were not
4
Introduction
Bone remodelling can be assessed easily and non-invasively by the measurement of serum and urinary biochemical bone turnover markers (BTMs). The bone resorption markers include C-terminal crosslinking telopeptides of type I collagen (CTX) and N-terminal crosslinking telopeptides of type I collagen (NTX). The bone formation markers include procollagen type I N-propeptide (PINP), bone alkaline phosphatase (bone ALP) and osteocalcin (OC) [1]. BTMs provide a dynamic assessment about the pathophysiology of metabolic bone disease, treatment monitoring and provide additional information to bone mineral density assessment measured by dual-energy X-ray absorptiometry (DXA). BTMs are increased in metabolic bone diseases such as osteoporosis where there is accelerated bone loss [2]. In some studies, high BTMs are associated with major osteoporotic fractures; for example, CTX was predictive of hip fracture in the EPIDOS cohort when patients were not fasting and samples were collected during the afternoon [3] and with bone loss [4,5].
Several BTM reference intervals for healthy premenopausal women have previously been established [6 9]. It has been proposed that the purpose of these is to monitor the response of osteoporotic patients to treatments. The proposed goal of antiresorptive treatments is to reduce BTMs to the lower part of the healthy premenopausal reference interval [10]. It is therefore essential to have a valid and robust reference interval.
BTM reference intervals for healthy postmenopausal women would also be useful. They may help clinicians to identify patients who may have secondary osteoporosis. However, they are difficult to establish because older women commonly suffer from disease or take medications that are known to affect bone metabolism, and therefore there are limited data [11]. It has been demonstrated that severe vitamin D deficiency as defined by 25 hydroxy vitamin D (25(OH)D) serum levels <12.5 nmol/L causes osteomalacia in adults [12 14]. This is associated with hypocalcaemia, impaired
mineralisation of bone, accelerated bone loss, lower bone mineral density (BMD) and increased bone turnover [15]. Vitamin D insufficiency as defined by 25(OH)D levels between 30 and 50 nmol/L is associated with an increase in parathyroid hormone (PTH) levels that is attributed to decreased calcium absorption. This may indicate secondary hyperparathyroidism in postmenopausal women [16, 17].
5 treated with antiresorptive therapies that have a significant effect on bone remodelling. The
reduction in BTMs are associated with increased bone mass and fracture risk reduction. For example, a 3-year trial of risedronate demonstrated a significant association between reduction in vertebral fracture risk and decreased levels of bone resorption markers and increased BMD [10]. The relationships between decreased bone ALP and P1NP and vertebral fracture risk were demonstrated with alendronate and zoledronic acid, respectively [21, 22]. These data have been supported by other studies [21, 22].
The usual approach to establish reference intervals is to define exclusion criteria. We have
taken a different approach; we have measured BTMs in the whole population and examined
whether the exclusion criteria are valid.
6
Materials and Methods
Study design and patients
The design of the Osteoporosis and Ultrasound (OPUS) study has previously been reported [23] and is summarised briefly here. OPUS was a five-European centre population-based study: Sheffield, Aberdeen, Berlin, Kiel and Paris. The study was M P K A investigations were conducted in accordance with the Declaration of Helsinki and ethical approval was obtained from the local ethics committees and written informed consent was obtained from each subject.
For this work we studied 2419 older women aged 55 80 years and 258 younger women aged 30 39 years from the OPUS study population. A modified version of the European Vertebral Osteoporosis Study (EVOS) risk factor questionnaire [24] was administered to each subject. From this we were able to collect medical and lifestyle information. Medical history of diseases and treatments was recorded and subjects were classified as smokers if they were current smokers and alcohol intake was recorded as number of drinks per week. BMD was measured at the spine and total hip using DXA. Nonfasting venous blood samples were collected from each subject between 12:00 and 15:00 into serum-separating tubes. The blood was left to clot for 30 min at room temperature and centrifuged at 2500 g for 10 min. The serum was then collected and stored at -80 °C until analysis. Second morning void urine samples were collected and stored at -20 °C until analysis.
Biochemical measurements
The following biochemical tests were measured in the Bone Biochemistry Laboratory, Sheffield, UK,
using automated protocol.
7 Serum creatinine was measured using the cobas c 311 automated analyser (Roche Diagnostics). This was used to calculate the estimated glomerular filtration rate (eGFR) using the formula based on the Modification of Diet and Renal Disease (MDRD) [25].
Medical conditions and treatments
We defined several diseases and treatments that may have an effect on bone remodelling. These were: (1) vitamin D deficiency if 25(OH)D was <30 nmol/L; (2) renal impairment if eGFR was < 30 mL/minute/1.73m² (CKD stages 4 and 5) as categorised by KDIGO (Kidney Disease: Improving Global Outcomes) [26, 27]; (3) osteoporosis at the spine or total hip if the BMD T-score 2.5; (4) other adverse conditions identified in the questionnaire: inflammatory bowel disease, rheumatoid arthritis, bone diseases other than osteoporosis, gastric surgery, hyperthyroidism, diabetes, liver
7.5mg prednisolone equivalent, intake >14 units per week; and (5) oestrogen replete, that is, still premenopausal, or current/recent antiresorptive treatments.
Statistical analyses
The data for CTX, NTX, bone ALP and osteocalcin had a skewed distribution and were therefore log10 transformed to achieve normality. Multiple linear regression coefficients were used to determine the association between BTMs and diseases and treatments, adjusting for age and menopause status. Subjects were categorised by the absence (0) or presence (1) of disease or treatment. The coefficients were the percentage difference in the geometric mean of the BTM associated with the presence of disease.
A 95% reference interval was calculated for each BTM as a mean ±1.96 s.d. The confidence intervals (CIs) for the upper and lower bounds of the reference interval were calculated as boundary ±1.96 s.e. where:
s e s dN N s d
8 PINP was not normally distributed after log10 transformation. Therefore, the nonparametric
reference interval was calculated, and the median and 95% bootstrap CIs were reported.
Independent sample t-tests were used to determine statistical difference between the BTM
reference intervals for postmenopausal and premenopausal women. The Mann Whitney U-test was used to determine statistical difference between the PINP reference interval for postmenopausal and premenopausal women.
9
Results
Subject characteristics
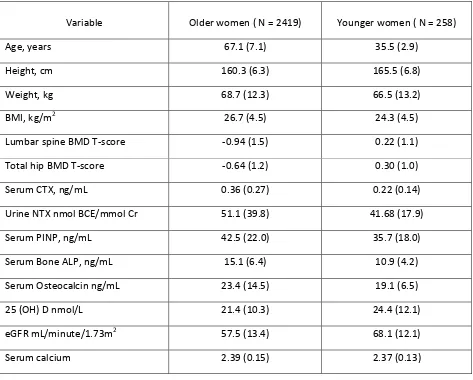
The subject characteristics for the older and younger women in the OPUS study population are shown in Table 1. Overall, mean BMD T-scores at the spine and total hip were lower and mean levels of BTMs were higher in older women compared with the younger women.
Effects of diseases and treatments on BTMs
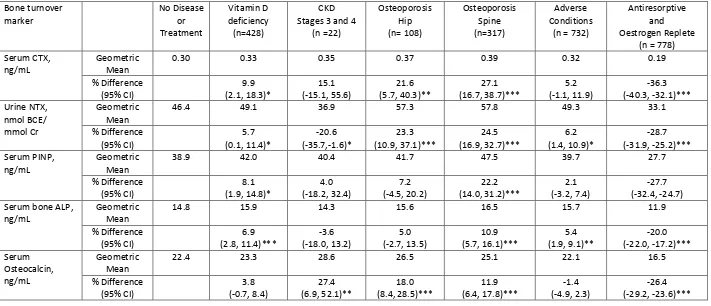
Multiple linear regression analysis was performed to assess the disease and treatments thought to influence bone turnover levels in older women, adjusting for age and menopause status Table 2. Levels of CTX, NTX, PINP and bone ALP were significantly higher by 5.7 9.9% (P < 0.050) in subjects who were vitamin D deficient compared with those who had normal levels. Levels of NTX were significantly lower by 20.6% (P < 0.050) and osteocalcin higher by 27.4% (P < 0.010) in subjects who had stage 4 or 5 CKD compared with those with a normal eGFR. All BTMs were significantly higher in subjects who were osteoporotic at the spine by 10.9 27.1% (P < 0.001) compared with those with a normal BMD T-score. All BTMs were significantly lower by 20.0 36.3% (P < 0.001) in patients who were taking antiresorptive treatments or who were oestrogen replete compared with those who were not. Levels of NTX and bone ALP were significantly higher by 5.4 6.4% (P < 0.050) in subjects who had a history of an adverse condition known to affect bone metabolism compared with those who did not. Overall, at least two BTMs were affected by each of the diseases or treatments that we investigated. Hence, it was therefore valid to use these as exclusion criteria for identifying a healthy set of subjects from whom we can determine BTM reference intervals for postmenopausal and premenopausal women.
Healthy reference intervals
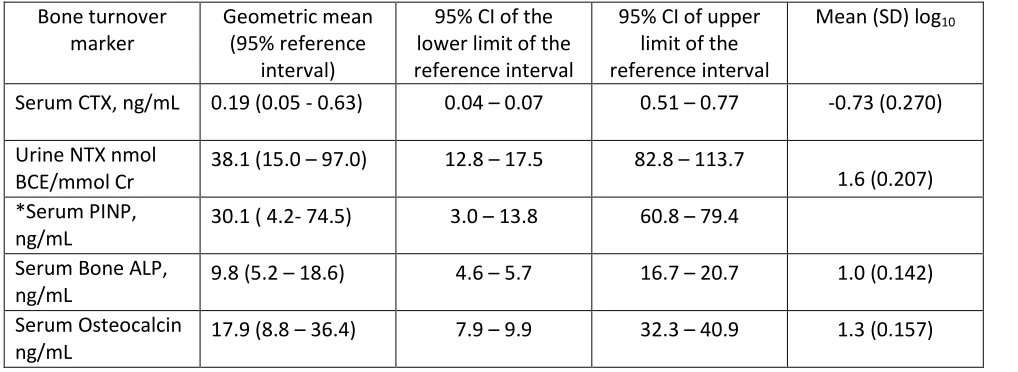
10 The lower part of the premenopausal reference intervals have been previously proposed as a target for treatment. This range was 0.05 0.19 ng/ml for CTX, 15.0 38.1 nmol bone collagen
equivalent (BCE) per mmol Cr for NTX, 4.2 30.1 ng/ml for PINP, 5.2 9.8 ng/ml for bone ALP and 8.8 17.9 for osteocalcin.
Determinants of BTMs in healthy postmenopausal women
11
Discussion
Reference intervals have been established for several clinically relevant bone resorption and
formation markers in healthy postmenopausal women. Here we have used a large well characterised healthy population that will be useful to clinicians to help identify patients who may have secondary osteoporosis. In a previous study based on a cohort of Spanish postmenopausal women, reference intervals for CTX and PINP have been established using fasting serum [11], and these are comparable to the OPUS cohort.
Several diseases and treatments influence BTMs in older women. Osteoporosis was associated with higher BTMs and antiresorptive treatments with lower BTMs. The decrease in BTMs following antiresorptive treatments has been well documented, reflecting the inhibition of bone remodelling [10, 28 30]. There is a decrease in CTX and NTX within weeks after bisphosphonate treatment and is followed by a decrease in bone formation markers.
BTMs are high in patients with vitamin D deficiency, mainly as a result of high PTH levels [16]. Osteocalcin levels are high in patients with CKD; however, there was a small number of patients in this group. This is consistent with previous work and may be related to decreased renal clearance and increased bone metabolism [31]. Median levels of PTH are 66.0 ng/ml in CKD group compared with 35.8 ng/ml in the healthy postmenopausal group, P<0.0001 (Mann Whitney test). Magnusson et al. [18] have also shown elevated levels of other BTMs cleared by renal filtration, that is, CTX and ICTP (crosslinked carboxyterminal telopeptide of type I collagen), in patients with chronic renal failure.
Our findings demonstrate that there are several adverse conditions and treatments that affect BTMs in older women. These are therefore valid exclusion criteria and must be applied when establishing healthy postmenopausal reference intervals for BTMs.
CTX has significant diurnal rhythm with a peak in the morning and a nadir in the afternoon.
12 other immunoassays. Levels of CTX in this study were lower than those established by De Papp et al. [34] and Glover et al. [6, 7] who used fasting serum samples and different assays. Levels of BTMs in postmenopausal women above the upper limit of the premenopausal reference interval are associated with an increase in the risk of fracture. Therefore, these reference intervals can also be used as a clinical tool to identify postmenopausal women who have high levels of bone turnover and increased risk of fracture [35]. Several lifestyle factors are significantly associated with bone
turnover in postmenopausal women. This study has shown that postmenopausal women with a high BMI have lower levels of circulating osteocalcin. This may be related to increased hormone secretion from adipocytes that influence osteoblast and osteoclast activity [36], and is supported further by Di Carlo et al. [37] who demonstrated that leptin is significantly negatively correlated with osteocalcin in postmenopausal women receiving oestrogen progestin therapy and also by Glover et al. [7]
We have also demonstrated that postmenopausal women who were current smokers had higher levels of circulating CTX, NTX, PINP and bone ALP compared with nonsmokers. This finding is consistent with previous studies based on premenopausal women: Glover et al. [7] demonstrated higher levels of NTX and bone ALP compared with nonsmokers in women based in Sheffield. In another study, Glover et al. [6] also demonstrated higher levels of CTX and PINP compared with nonsmokers in women based in the United Kingdom, France, Belgium and the United States. These factors should therefore be considered when reporting BTM data in clinical studies.
In conclusion, this study presents healthy postmenopausal reference intervals for clinically useful BTMs, using valid exclusion criteria. These differ from premenopausal reference intervals and, therefore, need to be determined separately.
Our study had strengths and weaknesses. We used subjects from a large population-based study cohort (n=2419) in establishing the postmenopausal and premenopausal reference intervals for BTMs. We identified, assessed and excluded the important factors known to affect bone
14
Conflict of Interest
Professor Eastell serves as a consultant, has received honoraria for speaking and has received grant support from Amgen, AstraZeneca, California Pacific Medical Center, GlaxoSmithKline, Hologic, Kyphon Inc., Immunodiagnostic System, Lilly Industries, Maxygen, Nastech Pharmaceuticals, Nestle Research Center, New Zealand Milk Limited, Novartis, Novo Nordisk, ONO-Pharma, Organon Laboratories, Osteologix, Pfizer, Procter & Gamble Pharmaceuticals, Roche Diagnostics, Sanofi-Aventis, Servier, Shire, Tethys, TransPharma Medical Limited, Unilever and Unipath. Professor Reid serves as a consultant, has received honoraria for speaking or has received grant support from Amgen, GE Lunar, GlaxoSmithKline, Lilly Industries, Novartis, Pfizer, Roche Pharmaceuticals, Servier and Shire. The remaining authors declare no conflict of interest.
Acknowledgements
15
References
1. Szulc P. The role of bone turnover markers in monitoring treatment in postmenopausal osteoporosis. Clin Biochem 2012;45:907 919.
2. Garnero P, Sornay-Rendu E, Chapuy MC, Delmas PD. Increased bone turnover in late postmenopausal women is a major determinant of osteoporosis. J Bone Miner Res 1996;11:337 349.
3. Chapurlat RD, Garnero P, Breart G, Meunier PJ, Delmas PD. Serumtype I collagen breakdown product (serum CTX) predicts hip fracture risk in elderly women: the EPIDOS study. Bone 2000;27:283 286.
4. Lofman O, Magnusson P, Toss G, Larsson L. Common biochemical markers of bone turnover predict future bone loss: a 5-year follow-up study. Clin Chim Acta 2005;356:67 75.
5. Rogers A, Hannon RA, Eastell R. Biochemical markers as predictors of rates of bone loss after menopause. J Bone Miner Res 2000;15:1398 1404.
6. Glover SJ, Gall M, Schoenborn-Kellenberger O, Wagener M, Garnero P, Boonen S et al.
Establishing a reference interval for bone turnover markers in 637 healthy, young, premenopausal women from the United Kingdom, France, Belgium, and the United States. J Bone
Miner Res 2009;24:389 397.
7. Glover SJ, Garnero P, Naylor K, Rogers A, Eastell R. Establishing a reference range for bone turnover markers in young, healthy women. Bone 2008;42:623 630.
8. Adami S, Bianchi G, Brandi ML, Giannini S, Ortolani S, DiMunno O et al. Determinants of bone turnover markers in healthy premenopausal women. Calcif Tissue Int 2008;82: 341 347.
9. Eastell R, Garnero P, Audebert C, Cahall DL. Reference intervals of bone turnover markers in healthy premenopausal women: results from a cross-sectional European study. Bone
16 10. Eastell R, Barton I, Hannon RA, Chines A, Garnero P, Delmas PD. Relationship of early
changes in bone resorption to the reduction in fracture risk with risedronate. J Bone Miner Res 2003;18:1051 1056.
11. Martinez J, Olmos JM, Hernandez JL, Pinedo G, Llorca J, Obregon E et al. Bone turnover markers in Spanish postmenopausal women: the Camargo cohort study. Clin Chim Acta 2009;409:70 74.
12. Bhan A, Rao AD, Rao DS. Osteomalacia as a result of vitamin D deficiency. Rheum Dis Clin North Am. 2012;38:81 91viii-ix.
13. Bikle DD. Vitamin D and bone. Curr Osteoporos Rep 2012;10:151 159.
14. Parfitt AM, Qiu S, Rao DS. The mineralization index--a new approach to the histomorphometric appraisal of osteomalacia. Bone 2004;35:320 325.
J D N AG H M O L PD M HA N BE ‘
between serum 25-hydroxyvitamin D and bone resorption markers in vitamin D insufficiency. Bone 2002;31:626 630.
16. Sahota O, Mundey MK, San P, Godber IM, Lawson N, Hosking DJ. The relationship between vitamin D and parathyroid hormone: calcium homeostasis, bone turnover, and bone mineral density in postmenopausal women with established osteoporosis. Bone 2004;35:312 319.
17. Seeman E. Pathogenesis of bone fragility in women and men. Lancet 2002;359:1841 1850.
18. Magnusson P, Sharp CA, Magnusson M, Risteli J, Davie MW, Larsson L. Effect of chronic renal failure on bone turnover and bone alkaline phosphatase isoforms. Kidney Int 2001;60:257 265.
19. Iimori S, Mori Y, Akita W, Kuyama T, Takada S, Asai T et al. Diagnostic usefulness of bone mineral density and biochemical markers of bone turnover in predicting fracture in CKD stage 5D patients--a single-center cohort study. Nephrol Dial Transplant 2012;27:345 351.
17 measure it at all in kidney patients? Clin J Am Soc Nephrol 2013;8:299 312.
21. Reginster JY, Adami S, Lakatos P, Greenwald M, Stepan JJ, Silverman SL et al. Efficacy and tolerability of once-monthly oral ibandronate in postmenopausal osteoporosis: 2 year results from the MOBILE study. Ann Rheum Dis 2006;65:654 661.
22. Black DM, Delmas PD, Eastell R, Reid IR, Boonen S, Cauley JA et al. Once-yearly zoledronic acid for treatment of postmenopausal osteoporosis. N Engl J Med 2007;356:1809 1822.
23. Gluer CC, Eastell R, Reid DM, Felsenberg D, Roux C, Barkmann R et al. Association of five quantitative ultrasound devices and bone densitometry with osteoporotic vertebral fractures in a population-based sample: the OPUS Study. J Bone Miner Res 2004;19:782 793.
O N TW C C C JB D L JB, Hoszowski K, Johnell O et al.
Reproducibility of a questionnaire on risk factors for osteoporosis in a multicentre prevalence survey: the European Vertebral Osteoporosis Study. Int J Epidemiol 1994;23:559 565.
25. Levey AS, Coresh J, Greene T, Marsh J, Stevens LA, Kusek JW et al. Expressing the
Modification of Diet in Renal Disease Study equation for estimating glomerular filtration rate with standardized serum creatinine values. Clin Chem 2007;53:766 772.
26. Matuszkiewicz-Rowinska J. KDIGO clinical practice guidelines for the diagnosis, evaluation, prevention, and treatment of mineral and bone disorders in chronic kidney disease. Pol Arch Med Wewn 2010;120:300 306.
27. KDIGO clinical practice guideline for the diagnosis, evaluation, prevention, and treatment of Chronic Kidney Disease-Mineral and Bone Disorder (CKD-MBD). Kidney Int Suppl 2009; S1 S130.
18 29. Jacques RM, Boonen S, Cosman F, Reid IR, Bauer DC, Black DM et al. Relationship of
changes in total hip bone mineral density to vertebral and nonvertebral fracture risk in women with postmenopausal osteoporosis treated with once-yearly zoledronic acid 5 mg: the
HORIZON-Pivotal Fracture Trial (PFT). J Bone Miner Res 2012;27:1627 1634.
30. Bauer DC, Garnero P, Hochberg MC, Santora A, Delmas P, Ewing SK et al. Pretreatment levels of bone turnover and the antifracture efficacy of alendronate: the fracture intervention trial. J Bone Miner Res 2006;21:292 299.
31. Delmas PD, Wilson DM, Mann KG, Riggs BL. Effect of renal function on plasma levels of bone Gla-protein. J Clin Endocrinol Metab 1983;57:1028 1030.
32. Lee J, Vasikaran S. Current recommendations for laboratory testing and use of bone turnover markers in management of osteoporosis. Ann Lab Med 2012;32:105 112.
33. Christgau S. Circadian variation in serum CrossLaps concentration is reduced in fasting individuals. Clin Chem 2000;46:431.
34. de Papp AE, Bone HG, Caulfield MP, Kagan R, Buinewicz A, Chen E et al. A cross-sectional study of bone turnover markers in healthy premenopausal women. Bone 2007;40:1222 1230.
35. Garnero P, Hausherr E, Chapuy MC, Marcelli C, Grandjean H, Muller C et al. Markers of bone resorption predict hip fracture in elderly women: the EPIDOS Prospective Study. J Bone Miner Res 1996;11:1531 1538.
36. Reid IR. Relationships among body mass, its components, and bone. Bone 2002;31:547 555.
37. Di Carlo C, Tommaselli GA, Gargano V, Sammartino A, Bifulco G, Tauchmanova L et al. Effects of estrogen-progestin therapy on serum levels of RANKL, osteoprotegerin, osteocalcin, leptin, and ghrelin in postmenopausal women. Menopause 2007;14:38 44.
19
Table 1: Baseline characteristics of the older (55-79 years) and younger (30-39 years) women in the OPUS study
Variable Older women ( N = 2419) Younger women ( N = 258)
Age, years 67.1 (7.1) 35.5 (2.9)
Height, cm 160.3 (6.3) 165.5 (6.8)
Weight, kg 68.7 (12.3) 66.5 (13.2)
BMI, kg/m2 26.7 (4.5) 24.3 (4.5)
Lumbar spine BMD T-score -0.94 (1.5) 0.22 (1.1)
Total hip BMD T-score -0.64 (1.2) 0.30 (1.0)
Serum CTX, ng/mL 0.36 (0.27) 0.22 (0.14)
Urine NTX nmol BCE/mmol Cr 51.1 (39.8) 41.68 (17.9)
Serum PINP, ng/mL 42.5 (22.0) 35.7 (18.0)
Serum Bone ALP, ng/mL 15.1 (6.4) 10.9 (4.2)
Serum Osteocalcin ng/mL 23.4 (14.5) 19.1 (6.5)
25 (OH) D nmol/L 21.4 (10.3) 24.4 (12.1)
eGFR mL/minute/1.73m2 57.5 (13.4) 68.1 (12.1)
Serum calcium 2.39 (0.15) 2.37 (0.13)
Abbreviations: ALP, alkaline phosphatase; BCE, bone collagen equivalent; BMD, bone mineral density; BMI, bone marrow index; CTX, C-terminal crosslinking telopeptides of type I collagen; eGFR, estimated glomerular filtration rate; N, number of subjects; NTX, N-terminal crosslinking
telopeptides of type I collagen; 25(OH)D, 25 hydroxy vitamin D, PINP, procollagen type I N propeptide.
20
Table 2: Percentage differences (95% confidence intervals) in the geometric means of BTMs from multiple linear regression coefficients: the effects of diseases and treatments on BTMs in all older women (55-79 years; n=2419)
Bone turnover marker No Disease or Treatment Vitamin D deficiency (n=428) CKD Stages 3 and 4
(n =22) Osteoporosis Hip (n= 108) Osteoporosis Spine (n=317) Adverse Conditions
(n = 732)
Antiresorptive and Oestrogen Replete
(n = 778) Serum CTX,
ng/mL
Geometric Mean
0.30 0.33 0.35 0.37 0.39 0.32 0.19
% Difference (95% CI) 9.9 (2.1, 18.3)* 15.1 (-15.1, 55.6) 21.6 (5.7, 40.3)** 27.1 (16.7, 38.7)*** 5.2 (-1.1, 11.9) -36.3 (-40.3, -32.1)*** Urine NTX, nmol BCE/ mmol Cr Geometric Mean
46.4 49.1 36.9 57.3 57.8 49.3 33.1
% Difference (95% CI) 5.7 (0.1, 11.4)* -20.6 (-35.7,-1.6)* 23.3 (10.9, 37.1)*** 24.5 (16.9, 32.7)*** 6.2 (1.4, 10.9)* -28.7 (-31.9, -25.2)*** Serum PINP, ng/mL Geometric Mean
38.9 42.0 40.4 41.7 47.5 39.7 27.7
% Difference (95% CI) 8.1 (1.9, 14.8)* 4.0 (-18.2, 32.4) 7.2 (-4.5, 20.2) 22.2 (14.0, 31.2)*** 2.1 (-3.2, 7.4) -27.7 (-32.4, -24.7) Serum bone ALP,
ng/mL
Geometric Mean
14.8 15.9 14.3 15.6 16.5 15.7 11.9
% Difference (95% CI) 6.9 (2.8, 11.4)*** -3.6 (-18.0, 13.2) 5.0 (-2.7, 13.5) 10.9 (5.7, 16.1)*** 5.4 (1.9, 9.1)** -20.0 (-22.0, -17.2)*** Serum Osteocalcin, ng/mL Geometric Mean
22.4 23.3 28.6 26.5 25.1 22.1 16.5
% Difference (95% CI) 3.8 (-0.7, 8.4) 27.4 (6.9, 52.1)** 18.0 (8.4, 28.5)*** 11.9 (6.4, 17.8)*** -1.4 (-4.9, 2.3) -26.4 (-29.2, -23.6)***
Abbreviations: ALP, alkaline phosphatase; BCE, bone collagen equivalent; BTM, bone turnover marker; CI, confidence interval; CKD, chronic kidney disease; CTX, C-terminal crosslinking telopeptides of type I collagen; NTX, terminal crosslinking telopeptides of type I collagen; PINP, procollagen type I
21
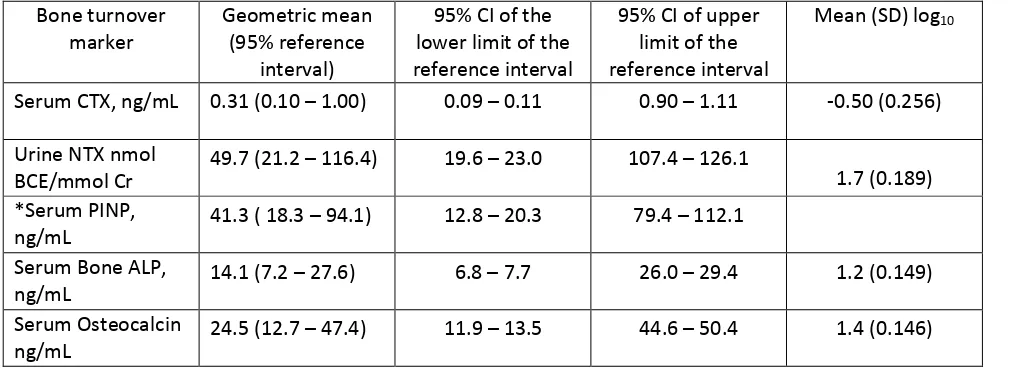
Table 3: Geometric mean (95% confidence interval) for the lower and upper limits of the reference intervals for BTMs for healthy postmenopausal women (n = 343)
Bone turnover marker
Geometric mean (95% reference
interval)
95% CI of the lower limit of the reference interval
95% CI of upper limit of the reference interval
Mean (SD) log10
Serum CTX, ng/mL 0.31 (0.10 1.00) 0.09 0.11 0.90 1.11 -0.50 (0.256)
Urine NTX nmol BCE/mmol Cr
49.7 (21.2 116.4) 19.6 23.0 107.4 126.1
1.7 (0.189) *Serum PINP,
ng/mL
41.3 ( 18.3 94.1) 12.8 20.3 79.4 112.1
Serum Bone ALP, ng/mL
14.1 (7.2 27.6) 6.8 7.7 26.0 29.4 1.2 (0.149)
Serum Osteocalcin ng/mL
24.5 (12.7 47.4) 11.9 13.5 44.6 50.4 1.4 (0.146)
Abbreviations: ALP, alkaline phosphatase; BCE, bone collagen equivalent; BTM, bone turnover marker; CI, confidence interval; CTX, C-terminal crosslinking telopeptides of type I collagen; NTX, N-terminal crosslinking telopeptides of type I collagen; PINP, procollagen type I N-propeptide.
22
Table 4: Geometric mean (95% confidence intervals) for the lower and upper limits of the reference intervals for BTMs for healthy premenopausal women (n=158)
Bone turnover marker
Geometric mean (95% reference
interval)
95% CI of the lower limit of the reference interval
95% CI of upper limit of the reference interval
Mean (SD) log10
Serum CTX, ng/mL 0.19 (0.05 - 0.63) 0.04 0.07 0.51 0.77 -0.73 (0.270)
Urine NTX nmol BCE/mmol Cr
38.1 (15.0 97.0) 12.8 17.5 82.8 113.7
1.6 (0.207) *Serum PINP,
ng/mL
30.1 ( 4.2- 74.5) 3.0 13.8 60.8 79.4
Serum Bone ALP, ng/mL
9.8 (5.2 18.6) 4.6 5.7 16.7 20.7 1.0 (0.142)
Serum Osteocalcin ng/mL
17.9 (8.8 36.4) 7.9 9.9 32.3 40.9 1.3 (0.157)
Abbreviations: ALP, alkaline phosphatase; BCE, bone collagen equivalent; BTM, bone turnover marker; CI, confidence interval; CTX, C-terminal crosslinking telopeptides of type I collagen; NTX, N-terminal crosslinking telopeptides of type I collagen; PINP, procollagen type I N-propeptide.
23
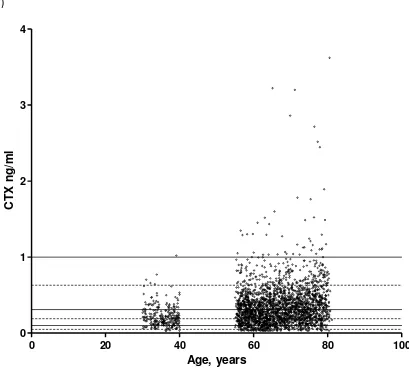
Figure 1: The effect of age on (a) CTX, (b) NTX, (c) PINP, (d) bone ALP and (e) osteocalcin in all older and younger women in the OPUS population. The solid black lines represent the upper limit, lower limit and geometric mean of the 95% reference intervals for healthy postmenopausal women. The dashed black lines represent the upper limit, lower limit and geometric mean of the 95% reference intervals for healthy premenopausal women.
(a)
Age, years
CT
X
n
g
/m
l
0 20 40 60 80 100
24 (b)
Age, years
NT
X
n
m
o
l
BC
E
/m
m
o
l
Cr
0 20 40 60 80 100
25 (c)
Age, years
P
INP
n
g
/m
l
0 20 40 60 80 100
26 (d)
Age, years
Bo
n
e
A
L
P
n
g
/m
l
0 20 40 60 80 100
27 (e)
Age, years
Os
te
o
c
a
lc
in
n
g
/m
l
0 20 40 60 80 100