Confident and sensitive phosphoproteomics using
combinations of collision induced dissociation and
electron transfer dissociation
☆
Mark O. Collins
a,1, James C. Wright
a, Matthew Jones
b, Julian C. Rayner
b, Jyoti S. Choudhary
a,⁎
aProteomic Mass Spectrometry, The Wellcome Trust Sanger Institute, Hinxton, Cambridge CB10 1SA, UKb
Malaria Programme, The Wellcome Trust Sanger Institute, Hinxton, Cambridge CB10 1SA, UK
A R T I C L E I N F O
A B S T R A C T
Article history:
Received 8 January 2014 Accepted 9 March 2014 Available online 21 March 2014
We present a workflow using an ETD-optimised version of Mascot Percolator and a modified version of SLoMo (turbo-SLoMo) for analysis of phosphoproteomic data. We have benchmarked this against several database searching algorithms and phosphorylation site localisation tools and show that it offers highly sensitive and confident phosphopeptide identification and site assignment with PSM-level statistics, enabling rigorous comparison of data acquisition methods. We analysed thePlasmodium falciparumschizont phosphoproteome using for the first time, a data-dependent neutral loss-triggered-ETD (DDNL) strategy and a conventional decision-tree method. At a posterior error probability threshold of 0.01, similar numbers of PSMs were identified using both methods with a 73% overlap in phosphopeptide identifications. The false discovery rate associated with spectral pairs where DDNL CID/ETD identified the same phosphopeptide was <1%. 72% of phosphorylation site assignments using turbo-SLoMo without any score filtering, were identical and 99.8% of these cases are associated with a false localisation rate of <5%. We show that DDNL acquisition is a useful approach for phosphoproteomics and results in an increased confidence in phosphopeptide identification without compromising sensitivity or duty cycle. Furthermore, the combination of Mascot Percolator and turbo-SLoMo represents a robust workflow for phosphoproteomic data analysis using CID and ETD fragmentation.
Biological significance
Protein phosphorylation is a ubiquitous post-translational modification that regulates protein function. Mass spectrometry-based approaches have revolutionised its analysis on a large-scale but phosphorylation sites are often identified by single phosphopeptides and therefore require more rigorous data analysis to unsure that sites are identified with high confidence for follow-up experiments to investigate their biological significance. The coverage and confidence of Keywords:
Phosphoproteomics Phosphorylation Mass spectrometry
Post-translational modifications Electron transfer dissociation Plasmodium falciparum
Abbreviations:CID, collision induced dissociation; ECD, electron capture dissociation; ETD, electron transfer dissociation; ETcaD, ETD with (supplemental activation); FDR, false discovery rate; FLR, false localisation rate; IMAC, immobilised metal affinity chromatography; LC, liquid chromatography; MS, mass spectrometry; MS/MS, tandem mass spectrometry; PEP, posterior error probability; PSM, peptide spectrum match; SCX, strong cation exchange.
☆ The authors were supported by the Wellcome Trust [079643/Z/06/Z].
⁎ Corresponding author at:Proteomic Mass Spectrometry, The Wellcome Trust Sanger Institute, The Wellcome Trust Genome Campus, Hinxton, Cambridge CB10 1SA, UK. Tel.: +44 1223 834244.
E-mail address:[email protected](J.S. Choudhary).
1Present address: The Centre for Membrane Interactions and Dynamics, Department of Biomedical Science, University of Sheffield,
Western Bank, Sheffield S10 2TN, UK.
http://dx.doi.org/10.1016/j.jprot.2014.03.010
1874-3919/Crown Copyright © 2014 Published by Elsevier B.V. This is an open access article under the CC BY license (http://creativecommons.org/licenses/by/3.0/).
A v a i l a b l e o n l i n e a t w w w . s c i e n c e d i r e c t . c o m
ScienceDirect
phosphoproteomic experiments can be enhanced by the use of multiple complementary fragmentation methods. Here we have benchmarked a data analysis pipeline for analysis of phosphoproteomic data generated using CID and ETD fragmentation and used it to demonstrate the utility of a data-dependent neutral loss triggered ETD fragmentation strategy for high confidence phosphopeptide identification and phosphorylation site localisation.
Crown Copyright © 2014 Published by Elsevier B.V. This is an open access article under the CC BY license (http://creativecommons.org/licenses/by/3.0/).
1. Introduction
Protein phosphorylation is the most studied post-translational modifications and it regulates most biological processes. A large proportion of genomes encode proteins that regulate protein phosphorylation (kinases and phosphatases) as well as many classes of protein domains that recognize it as a regulated epitope. The analysis of protein phosphorylation has been transformed in recent years with the development of methods to enrich phosphopeptides from complex mixtures[1–5], soft peptide fragmentation techniques such as electron transfer dissociation [6], as well as advances in the sensitivity and specificity of mass spectrometry instrumentation. Protein phos-phorylation was the first PTM studied on a proteome scale and since then protein acetylation [7], ubiquitination [8] and O-GlcNAcylation[9], amongst others have benefitted from similar technological developments.
CID fragmentation is generally the method of choice for peptide fragmentation and its implementation in ion trap and Q-ToF type devices allows rapid and sensitive peptide identifi-cation. Recent generations of mass spectrometers have also been enabled with various configurations of ETD sources[6,10]
enabling a type of peptide fragmentation that is considered complementary to CID [11]. CID fragmentation of peptides bearing labile modifications often result in spectra that are dominated by large neutral loss peaks[12]with compromised sequence information compared to spectra from non-modified counterparts [13]. ETD however, preserves labile side chain modifications such as phosphorylation and O-GlcNAcylation and has attracted much attention for the analysis of PTMs[14]. Generally, CID fragmentation is more suited to lower charge states and higher precursor mass, whilst ETD is better suited to higher charge but lower m/z precursor ions[15]. The duty cycle of ETD is currently slower than CID due to longer reaction times, 70–100 ms for ETD versus 10–30 ms for CID. Therefore, the combined/targeted use of these complementary methods in the same experiment can improve peptide and protein identification rates and reduce the amount of sample needed and total acquisition time[15]. Recently, it has been reported that through optimisation of ETD reaction parameters and the use of alternative reagents, ETD fragmentation can be performed at optimal efficiency in time scales similar to CID
[16]. This will further enhance the use of combined alterna-tive fragmentation methods as duty cycle constraints are lessened.
Analysis of data acquired using alternative fragmentation methods and from peptides bearing post-translational modifi-cations is not straightforward for a number of reasons. Alternative fragmentation methods can require additional processing and an increased number of fragment ion types to be considered. This leads to a higher computational overhead
with an increased risk of false positive matches. The majority of database searching algorithms were built to analyse data from CID spectra and over the years as alternative fragmentation methods have been developed, they have been modified to allow for the different ion series produced by these methods. This integration of different fragmentation types has also been implemented in post-search algorithms such as Mascot Percolator[17,18]and Protein Prospector[19], allowing scoring and accurate FDR calculations to be determined in a single pipeline regardless of fragmentation type.
For modified peptides, the search space is inflated due to additional variable modifications and an increased number of missed cleavages caused by phosphorylation sites adjacent to enzymatic cleavage sites [20]. Furthermore, phosphopeptide spectra tend to have added complexity, especially from CID, where neutral loss peaks are present. This can cause a substantial decrease in informative fragment ions and this in turn affects peptide spectrum match (PSM) scoring; modified spectra score lower than their unmodified counter-parts. Again, post-search tools such as Mascot Percolator can help to boost the scores of these spectra; however this is still reliant on the initial search being able to correctly assign the peptide sequence. Finally, localisation of phosphorylation sites using fragmentation information is not straightforward
[21]. Sites can only be assigned if fragment ions surrounding potential phosphorylation sites are present; often this is further complicated by multiple phosphorylatable residues being adjacent and single peptides having multiple modifica-tions. There are various tools to help evaluate modification site assignment including Mascot Delta Score[22], Ascore[23], PhosphoRS [24] and SloMo [25] amongst others (see[21] for detailed review). These tools have been benchmarked using data from phosphopeptide standards and it is assumed that false localisation rates are consistent between standard and biological datasets[21].
2. Experimental procedures
2.1. Preparation of parasites
P. falciparum strain 3D7 was cultured in 2.5–5% O + human erythrocytes with 0.5% Albumax II in custom-made RPMI media (Invitrogen) and parasites were collected by saponin lysis, an approach that removes the vast majority of erythrocyte material. Briefly, infected erythrocytes were pelleted and re-suspended in 5–10 ml of 0.1% Saponin lysis buffer (0.1% Saponin in PBS) and incubated at room temper-ature for 5 min before being centrifuged at 3200 ×g for 10 min. After centrifugation, the supernatant was discarded and the parasite pellet was washed with 0.1% Saponin lysis buffer and centrifuged again at 3200 ×gfor 10 min. Washes with 0.1% Saponin lysis buffer were repeated until supernatants were completely clear.
2.2. Protein extraction, digestion and clean up
Parasite pellets were re-suspended in extraction buffer (4% SDS, 0.1 M DTT, 0.1 M Tris pH 8, 0.5 mM PMSF, 2μg/ml Aprotinin/Leupeptin, 20μM ZnCl and 25 mM Sodium fluoride), homogenised in a 2 ml dounce homogeniser with 25 strokes and DNA was sheared by passing the lysate through a fine gauge needle. The sample was heated for 5 min @ 97 °C and insoluble material was pelleted by centrifugation at 14,000 rpm for 10 min. The insoluble pellet was further extracted by addition of urea (once cooled to room temperature) to a final concentration of 8 M. Homogenisation and centrifuga-tion steps were repeated and supernatants containing solubilized protein from both extractions were pooled and applied to a pre-washed Amicom-15 centrifugal filter unit (30 kD MWCO) (Millipore). The protein sample (4 mg) was processed according to the FASP procedure[26,27]in which SDS was removed by buffer exchange with urea and cysteine alkylation was performed in situ with iodoacetamide and proteins were digested with Trypsin Gold (Promega) for 4 h at 37 °C at an enzyme substrate ratio of 1:20 with a urea concentration of 1.8 M and 100 mM ammonium bicarbonate. Peptides were collected by centrifugation and addition of 100 mM ammonium bicarbonate to the upper chamber of the unit and further centrifugation. Collected peptides were adjusted to a 0.4% TFA and desalted using a Sep-Pak® Light C18 cartridge (Waters) and dried down using a SpeedVac (Thermo Scientific).
2.3. IMAC purification
IMAC purifications were performed as described[28], with the following modifications. Peptides were re-suspended in IMAC loading buffer (50% acetonitrile, 0.1% TFA) and incubated with pre-equilibrated Phos-Select beads (Sigma) for 1 h at room temperature. The beads were then transferred to a TopTip (Glygen) and washed once with IMAC loading buffer, 1% acetic acid and then water. Phosphopeptides were eluted with 100μl ammonia water pH 11 and acidified using formic acid. Phosphopeptides from two IMAC purifications were pooled and split into 6 aliquots for LC–MS/MS analysis.
2.4. LC–MS/MS analysis
Phosphopeptide samples were analysed online using an Ultimate 3000 nano/Capillary LC System (Dionex) coupled to an LTQ Orbitrap Velos hybrid mass spectrometer (Thermo Scientific) equipped with a nanospray ion source. Peptides were desalted on-line using a micro-Precolumn cartridge (C18 Pepmap 100, LC Packings) (with 0.5% acetic acid) and then separated using a 320 min RP gradient (4–30% acetonitrile/ 0.1% formic acid) on an Acclaim PepMap100 C18 analytical column (3μm, 75μm id × 50 cm) (Dionex) with a flow rate of 0.3μl/min. The mass spectrometer was operated in standard data dependent acquisition mode controlled by Xcalibur 2.1. The instrument was operated with a cycle of one MS (in the Orbitrap) acquired at a resolution of 60,000 at m/z 400, with the top 10 most abundant multiply-charged (2 + and higher) ions in a given chromatographic window subjected to either CID or ETD fragmentation in the linear ion trap with supplemental activation enabled. An FTMS target value of 1e6 and an ion trap MSn target value of 1e4 were used. Dynamic exclusion was enabled with a repeat duration of 45 s with an exclusion list of 500 and exclusion duration of 30 s. Lock mass of 445.120025 was enabled for all experiments. Triplicate DT experiments were performed using the standard charge and mass/charge settings in the instrument method file. Triplicate DDNL experiments were performed when neutral loss peaks corresponding to the loss of phosphoric acid from precursor ions in CID were observed within the top 5 most intense CID peaks. We also performed proteome profiling experiments (1μg of desalted FASP digest) using direct LC–MS/MS analyses; triplicate experiments using CID fragmentation and triplicate DT experiments with 4-hour LC gradients using the same LC setup and acquisition parame-ters described above.
2.5. Data processing and database searching
0.01 was applied to the data to generate a higher confidence dataset with a less than 1% FDR at the PSM level. Only top ranked hits were reported. Phosphorylation site localisation was performed using an in-house version of SLoMo [25], Ascore [23] and the Mascot Delta score [22]. To allow high-throughput analysis of the data several in-house changes were made to the original SLoMo modification site localisation tool to generate our version of the software, turbo-SLoMo (http://www.sanger.ac.uk/resources/software/). SLoMo was adapted to read spectra in MGF format, and to also generate a single combined output results summary file. New command line options were added to allow all or a subset of modifications (such as all phosphorylation modifications) to be processed in a single run. Options were also added to run the tool in a batch mode that allowed a single analysis to be split over many computational nodes. Finally, we also added additional filtering to exclude spectra with low Mascot Percolator PEP scores and with large numbers of variable modifications. Mascot delta scores were calculated as the ion score difference between rank 1 PSMs and the next same sequence rank ion score within the top 10 ranks reported by Mascot. In cases where an additional same sequence rank hit was not found, a delta score could not be calculated and therefore was not considered a PSM with a localised phosphor-ylation site. Delta score thresholds for CID and ETD (with supplemental activation) equating to 1% and 5% false localisation rates were taken from[22]. CID and ETD spectra from DT experiments and CID spectra from DDNL experiments were also searched with the addition of Phospho Y to identify putative tyrosine phosphorylation sites. PSMs (PEP < 0.01) with confidently localised tyrosine phosphorylation sites (5% FLR) were accepted and in cases where a spectrum also matched an alternative Phospho (ST) site then the PSM with the highest turbo-SLoMo score was chosen and the score difference between potential pY and pST sites included in Table S6. Mascot dat files were converted to PRIDE XML files with PRIDE Converter v2.0.9 and uploaded to the ProteomeXchange Con-sortium (http://proteomecentral.proteomexchange.org) via the PRIDE partner repository [29] with the dataset identifier PXD000070 and DOI http://dx.doi.org/10.6019/PXD000070 and available in the PRIDE database (http://www.ebi.ac.uk/pride/) with accession numbers 27915-27926.
3. Results and discussion
3.1. A data analysis workflow for phosphopeptide characteri-sation using CID and ETD fragmentation
In order to obtain robust peptide identifications using multiple fragmentation techniques, data should be processed, database searched and scored using a single robust, global and PSM specific FDR analysis pipeline. We have recently adapted Mascot Percolator, a machine learning method for rescoring database search results from ETD[18]as well as CID data[17]. Mascot Percolator increases the number of CID PSMs by up to 80% and ETD PSMs by up to 60% at a 0.01q-value (1% FDR) threshold over a standard Mascot search [18]. We benchmarked Mascot Percolator's performance to other data-base search and scoring algorithms for phosphopeptide
identification. Details of the extended feature set that we use for SVM training in our implementation of Mascot Percolator can be found here [18]. We reanalysed published human phos-phoproteomic data (phosphopeptides enriched from a human cell line), which was acquired by sequential CID and ETD analysis on an Orbitrap mass spectrometer[30], using Mascot Percolator. 5277 and 3543 phosphopeptide PSMs (0.01q-value threshold) were identified for CID and ETD datasets, respectively (Fig. 1). This represents an increase in significant assignments of 45.5% and 53.1% compared to Mascot, 137.2% and 280.9% compared to SEQUEST and 84.8% and 304.5% compared to X! Tandem for CID and ETD data, respectively. The gain in phosphopeptide identifications using Mascot Percolator for both CID and ETD data is substantial however, the performance of Mascot Percolator for phosphopeptide data is slightly lower than we previously reported for data from unmodified peptides (22) reflecting the increased complexity of spectra from modified peptides. Whilst we would expect improvement in the overall performance of SEQUEST and X!Tandem when hyphenated with percolator[31,32], it is important to note that Mascot (and Mascot Percolator) performs significantly better than SEQUEST and X!Tandem for analysis of ETD data, a feature that is particularly important if CID/ETD spectral pairs are to be analysed.
In order to assess the accuracy of Mascot Percolator for CID and ETD phosphopeptide data, we processed data from a human phosphopeptide library that was analysed using CID and ETD on an Orbitrap mass spectrometer[22]. 99.2% of ETD spectra and 99.4% of CID spectra identified by Mascot Percolator (at a 0.01 PEP threshold) were matched to the phosphopeptide library and some additional common contaminant proteins (e.g. BSA, keratin, and trypsin). This equates to a false discovery rate of well below 1% which is similar to that reported for unmodified peptides[18].
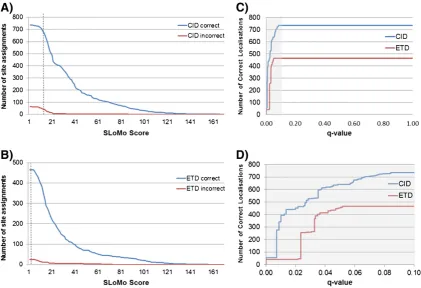
We next compared a number of phosphorylation site localisation tools by benchmarking them using the same phosphopeptide library dataset [22]. We began by assessing the false localisation rate (FLR) associated with phosphorylation site assignments made by Mascot (the assignment of phos-phorylation sites in rank 1 peptides). For the 1062 CID spectra and 685 ETD spectra (phosphoPSMs) identified at 0.01 PEP threshold by Mascot Percolator (Fig. 2), 894 (84.73%) CID PSMs and 624 (91.36%) of ETD PSMs identified the correct site of phosphorylation indicating that phosphorylation sites are more readily localised in ETD spectra. However, in order to reach an acceptable FLR of 5%, an increase in specificity of assignment of 10% and 5% over the standard Mascot assignment is needed for CID and ETD spectra, respectively.
corresponded to a measured FLR of 0.92% for CID spectra and 1.82% for ETD spectra. Lastly, at a turbo-SLoMo score of 19, the FLR was found to be 2.11% for CID and 1.99% for ETD spectra. All four tools gave a similar FLR of <5% which we regard as acceptable for PTM localisation. However, the striking observa-tion was that at these thresholds only a modest porobserva-tion of spectra in some cases (42.98% of CID spectra and 67.50% of ETD spectra (Mascot Delta score), 58.91% of CID spectra (Ascore), 60.79% of CID spectra and 71.16% of ETD spectra (PhosphoRS) and 61.17% of CID spectra and 43.19% of ETD spectra (turbo-SLoMo)) were confidently localised at these thresholds which is a considerable sacrifice in sensitivity to gain modest increases in specificity over standard Mascot assignments. The observation that ETD spectra are inherently more likely to identify correct sites of phosphorylation[33]has been exploited to allow the use of a much lower Mascot delta score threshold for ETD spectra (delta score of 4 for 1% and 0 for 5% FLR) compared to CID data (delta score of 11 for 1% and 4 for 5%) with comparable false localisation rates[22]and explains the increased performance of the Mascot delta score compared to turbo-SLoMo for ETD data. We therefore investigated whether we could adjust turbo-SLoMo score thresholds to further increase the proportion of spectra for which we could confidently assign phosphorylation sites. Fig. 1–Comparison of search algorithms for identification of
phosphopeptides using CID and ETD fragmentation. Numbers of phosphoPSMs identified using Sequest, X!Tandem, Mascot and Mascot Percolator for a dataset of sequential CID and ETD spectra are shown at a 1% FDR.
[image:5.595.55.286.53.221.2] [image:5.595.78.525.342.633.2]We found that as we dropped the score threshold from 19 that the FLR was maintained at < 5% for CID spectra until we reached a score threshold of 13 at which point 76.53% of the spectra were confidently localised (Figs. 2 and 3). Repeating the same procedure with the ETD data, we found that a much lower threshold (score of 2.2 (all scored by turbo-SLoMo)) could be used whilst still maintaining a FLR of 5% as which point 76.28% of spectra were confidently localised. The relationship between the site localisationq-value (FLR) and localisation rate is plotted inFig. 3. It can be seen that whilst the FLR continues to increase with decreasing score for CID data, the FLR does not go beyond 5% for ETD data. The lowest score that turbo-SLoMo reported was 2.2, beyond this it reported a score of 0 indicating multiple top hits. Therefore, it appears that if turbo-SLoMo assigns a score to an ETD spectrum then the associated FLR will not exceed 5%. As this library contains tryptic peptides with real phosphorylation sites (they exist in nature) it is likely to be more similar to real phosphoproteomic datasets than the degenerate phosphopep-tide libraries that previously had been used to optimize and test PTM localisation tools and associated false localisation rates
[25]. The use of adjusted score thresholds in turbo-SLoMo to maximise site localisation whilst maintaining FLR rates of 5% significantly enhances its performance to the point where it out performs the Mascot delta score and Ascore and is comparable in performance to the leading commercially available tool, PhosphoRS.
3.2. Large scale phosphopeptide identification using Mascot Percolator
Next, we sought to investigate the performance of combina-tions of CID and ETD fragmentation for analysis of complex phosphoproteome samples. Two acquisition strategies were employed to identify phosphopeptides from IMAC enriched P. falciparumphosphopeptide samples. A data dependent neutral loss triggered ETD (DDNL) acquisition method in which every precursor is fragmented by CID and if a characteristic neutral loss of phosphoric acid is observed, the same precursor is also triggered for ETD analysis. In this way, CID scans act as
‘phosphopeptide filter’ to invest more time consuming ETD analysis on bona fide phosphopeptides. A similar approach implemented with neutral loss triggered ECD fragmentation was developed for phosphopeptide characterisation[34]but was somewhat limited by the speed and sensitivity of ECD and is therefore not suitable for phosphoproteome analysis. We com-pared this DDNL strategy to the decision tree method developed by Coon and co-workers [15]in which CID or ETD is used to fragment peptides depending on precursor charge and m/z (Fig. S2). Triplicate experiments were performed using both the DT and DDNL strategies in which the most abundant top 10 precursor ions were subjected to CID/ETD fragmentation. Similar numbers of fragmentation spectra were acquired for both methods with 163,820 for the DT and 159,294 for the DDNL triplicate datasets (Tables 1, S1).
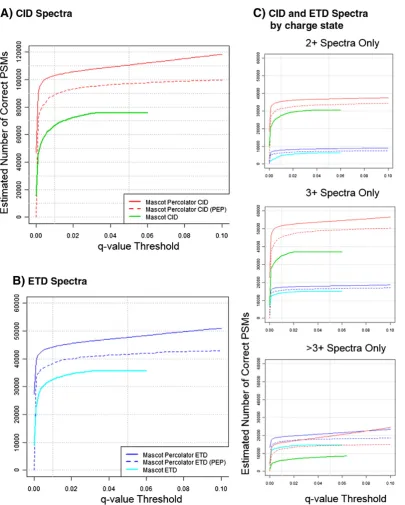
[image:6.595.84.506.398.686.2]We evaluated the performance of Mascot Percolator over standard Mascot results for over 227,000 CID spectra and over 95,000 ETD spectra from the combined set of DT and DDNL experiments. At a 1% FDR (0.01 q-value threshold) Mascot Percolator gave an overall 54.5% increase in CID PSMs over the standard Mascot search (0.01q-value threshold) with 22.6, 64.4 and 150.6% gains for 2+, 3+ and >3+ charges states respectively (Fig. 4, Table S1). A similar gain in matched PSMs was observed with ETD data with an overall increase of 35.9% in significant PSMs over the standard Mascot search (0.01q-value threshold) with 45.6, 23.7 and 45.0% gains for 2+, 3+ and >3+ charge states, respectively (Fig. 4 (Table S1)). We chose to use a more conservative cut off than the usual 1% FDR (0.01 q-value threshold) used for protein identification as we believe that when dealing with modified peptides, PSM specific scoring should be used to ensure high confidence at the individual PSM level[35]. We therefore chose to use a 0.01 PEP threshold for reporting phosphopeptide identifications, this equates to a more conservative statistical cut-off equivalent to an overall FDR of 0.14%[36](Table S1). It can be seen inFig. 4that this threshold results in approximately a 15% reduction in PSMs compared to a global FDR threshold (qvalue) of 1%.
3.3. Combinations of CID and ETD for phosphopeptide identification
In the DT strategy, 163,820 spectra were acquired in three experiments (Table 1), with 45,862 CID PSMs and 18,123 ETD PSMs identified by Mascot Percolator at a 0.01 PEP threshold (Tables S1 & S3). In total, the DT method identified 3798 unique phosphopeptide sequences (0.01 PEP threshold) with 3272 identified from CID spectra and 1361 identified from ETD spectra (Table 2). The overlap in phosphopeptide identifications between CID and ETD spectra using this method was 21.99% (Table 2, Fig. S3) which is similar to that reported previously (17.9%) for phosphopeptide analysis with this method[15].
159,294 spectra were acquired in three DNNL experiments (Table 1), with 43,183 CID PSMs (assignment rate of 39.1%) and
20,140 (assignment rate of 41.1%) ETD PSMs identified by Mascot Percolator at a 0.01 PEP threshold (Tables S1 & S2). In total, the DDNL method identified 3808 unique phosphopep-tide sequences (0.01 PEP threshold) with 3272 identified from CID spectra and 2996 identified from ETD spectra (Table 2). The overlap in phosphopeptide identifications between CID and ETD spectra for this method was 64.5% (Table 2, Fig. S3). 71% of PSMs (0.01 PEP threshold) (CID and ETD spectra) in the DT method were matched to phosphopeptides. This contrasts with an increase in phosphoPSMs to 89% for ETD spectra in the DDNL strategy which employs a phosphorylation selec-tion step in the form of the neutral loss trigger. Overall, the DT and DDNL methods identified similar numbers of unique phosphopeptides however; given that a large proportion of the DDNL data is composed of consecutive CID and ETD spectra of the exact same precursor, confidence in phospho-peptide identification by both fragmentation methods is increased.
60% of the acquired spectra in DDNL experiments belonged to CID/ETD spectral pairs (95,282 spectra, 47,641 pairs) (Table 2
&Fig. 5). Of these spectral pairs, 44.8% (21,341) identified the same peptide sequence using Mascot Percolator without any score filtering. 18,874 of these spectral pairs identified the same phosphopeptide sequence and notably the majority correspond to high confidence assignments; 97.5% (18,407) had a PEP less than 0.05 and 94.3% (17,802) had a PEP less than 0.01 (Fig. 5) in at least one fragmentation method. Therefore, we observe that if the same phosphopeptide sequence is identified (no score filtering) by both CID and ETD in a spectral pair acquired in DDNL experiments, it is almost certainly a correct identification, equating to an overall dataset FDR of less than 1% without any score based filtering (0.01q-value). This is also a good measure of the performance of Mascot Percolator as it confidently identified nearly all of the same phosphopeptide sequence matching spectral pairs which are highly likely to be real self-validating phosphopeptide identifications.
In agreement with previous reports[15], we observed that more PSMs were identified for lower m/z and higher charge
Table 1–Summary of spectra acquired and results of Mascot and Mascot Percolator analysis.
Replicate 1 Replicate 2 Replicate 3 Total Assignment rate
A) Decision tree
CID Spectra acquired 39,904 38,227 39,290 117,421
MP PSMs (q0.01) 17,595 17,796 17,870 53,261 45.4
MP PSMs (PEP 0.01) 15,305 15,327 15,230 45,862 39.1
Mascot (q0.01) 10,803 11,996 11,617 34,416 29.3
ETD Spectra acquired 15,804 15,356 15,239 46,399
MP PSMs (q0.01) 6977 6758 6577 20,312 43.8
MP PSMs (PEP 0.01) 6156 6107 5860 18,123 39.1
Mascot (q0.01) 5416 5173 5069 15,658 33.7
B) Data dependent neutral loss triggered ETD
CID Spectra acquired 36,865 37,446 36,006 110,317
MP PSMs (q0.01) 17,191 16,627 15,870 49,688 45.0
MP PSMs (PEP 0.01) 14,918 14,291 13,974 43,183 39.1
Mascot (q0.01) 11,374 10,561 10,269 32,204 29.2
ETD Spectra acquired 16,286 14,338 18,353 48,977
MP PSMs (q0.01) 7367 7954 8642 23,963 48.9
MP PSMs (PEP 0.01) 6081 6663 7396 20,140 41.1
Mascot (q0.01) 5314 5617 5976 16,907 34.5
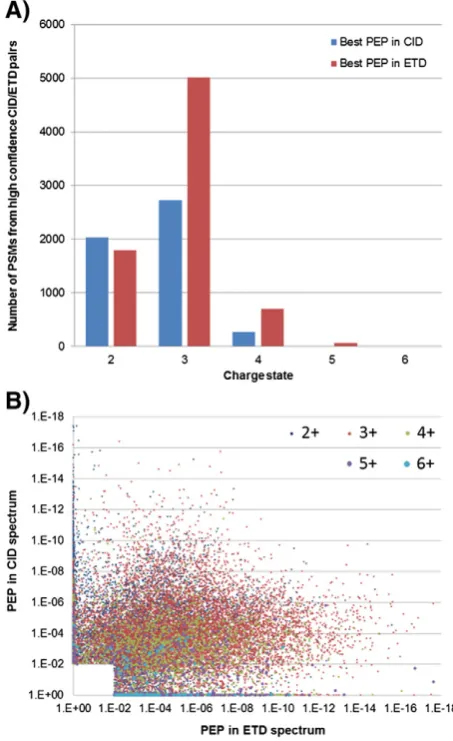
state in ETD than for CID (Fig. S4). However, the distribution of charge states for these phosphopeptides is higher than that typically observed for non-modified peptides generated using trypsin, with triply charged precursors being the most abundant. Fig. 6A compares the numbers of PSMs assigned from DDNL CID/ETD pairs using the best Mascot Percolator score of each pair. Fragmentation of doubly charged phosphopeptides gives similar numbers of best scoring PSMs
[image:8.595.97.503.59.565.2]The overall distribution of PEP values for spectral pairs (with a PEP of 0.01 in either CID or ETD) is plotted inFig. 6B and is strongly skewed towards PSMs having better PEP scores from ETD spectra. The median PEP for ETD PSMs was almost two-fold smaller than that for paired CID spectra and a significant portion of spectral pairs (29%) had a PEP of 0.01 by only one fragmentation method (Fig. 6B,Table 3A). Therefore, even with the superior performance of Mascot Percolator for identification of doubly charged peptides from ETD spectra compared to OMSSA[18](Figs. 6, S4), there is still significant complementarity between CID and ETD for phosphopeptide identification and a clear utility for combinations of these fragmentation methods for phosphoproteome analysis.
3.4. Phosphorylation site assignment using turbo-SLoMo
We analysed our P. falciparumCID and ETD datasets using turbo-SLoMo with adjusted score thresholds to give a FLR of 5%. Of the very high confidence set (0.01 PEP threshold for both) of 12,618 CID/ETD pairs identified in DDNL experiments, 10,902 (86.4%) phosphorylation site assignments (rank 1 assignment from Mascot Percolator) were identical for both fragmentation methods (Table 3a). Overall, sites in 11,622 (92.1%) high confidence spectral pairs were localised using turbo-SLoMo (FLR 5%) by either CID or ETD (Table 3b,Fig. 5). 9063 (71.8%) of these spectral pairs had the same phosphor-ylation site assignments using turbo-SLoMo (no score cut off applied). Strikingly, 9049/9063 (99.8%) of those spectral pairs
scored by turbo-SLoMo had scores above the adjusted thresholds (5% FLR) for at least one member of CID/ETD spectral pairs. Therefore, if phosphorylation site assignments from CID/ETD pairs are the same, then they are highly likely to be correct. This mirrors the near certainty of matching peptide identifications from CID/ETD pairs that we and others [37]
have observed and highlights the utility of sequential frag-mentation of the same precursor by different methods. Furthermore, as almost all (99.85%) spectral pairs that were scored by turbo-SLoMo and identified the same site, were in fact localised with a FLR of 5% by either CID or ETD, there is little utility in combining site localisation scores for spectral pairs to boost site identification rates from turbo-SLoMo. Integration of site localisation scores from spectral pairs has recently been reported [38] and was shown to outperform A-score results from CID or ETD data individually but not compared to aggregate results from both CID and ETD. However, the use of an adjusted threshold for this combined score could potentially improve site localisation rates[38].
[image:9.595.54.556.80.402.2]The remaining 2573 high confidence CID/ETD pairs did not give the same phosphorylation site assignment at a 5% FLR by turbo-SLoMo. The majority of the site assignments (1900, 73.8%) scored above threshold only in ETD members of the spectral pairs, again reflecting the increased utility of ETD for phosphor-ylation site assignments[33]. Crucially, only 258 CID/ETD pairs gave confident site assignments that were on alternative residues in the same peptide, corresponding to 2% of pairs that were analysed using turbo-SLoMo with adjusted score Table 2–Comparison of CID and ETD in DT and DDNL experiments.
Replicate 1 Replicate 2 Replicate 3 Total
A) Decision tree
CID PSMs (PEP < 0.01) 15,305 15,327 15,230 45,862
PhosphoPSMs (PEP < 0.01) 10,567 10,962 10,984 32,513
% phosphoPSMs 69% 72% 72% 71%
Unique phosphopeptide sequences 2525 2610 2674 3272
ETD PSMs (PEP < 0.01) 6156 6107 5860 18,123
PhosphoPSMs (PEP < 0.01) 4396 4229 4299 12,924
% phosphoPSMs 71% 69% 73% 71%
Unique phosphopeptide sequences 1115 1087 1076 1361
CID/ETD overlap (unique phosphopeptides) 628 633 638 835
Overlap % 20.86% 20.67% 20.51% 21.99%
Total phosphoPSMs 14,963 15,191 15,283 45,437
Total unique phosphopeptides 3010 3062 3110 3798
B) DDNL
CID PSMs (PEP < 0.01) 14,918 14,291 13,974 43,183
PhosphoPSMs (PEP < 0.01) 8962 9667 9307 27,936
% phosphoPSMs 60% 68% 67% 65%
Unique phosphopeptide sequences 2342 2538 2443 3272
ETD PSMs (PEP < 0.01) 6081 6663 7396 20,140
PhosphoPSMs (PEP < 0.01) 5862 5429 6666 17,957
% phosphoPSMs 96% 81% 90% 89%
Unique phosphopeptide sequences 2061 1957 2200 2996
CID/ETD overlap (unique phosphopeptides) 1646 1611 1744 2458
Overlap % 59.70% 55.92% 60.20% 64.55%
Total phosphoPSMs 14,824 15,096 15,973 45,893
Total unique phosphopeptides 2757 2881 2897 3808
DT/DDNL overlap 3197
DT/DDNL total unique phosphopeptide sequences 4409
thresholds. In order to identify the most likely sites of phosphorylation from these CID/ETD pairs with confident but conflicting site assignments, the sites with the highest turbo-SLoMo scores were chosen. We sought to verify if this approach was valid by checking if any of these sites could be confirmed by other confidently assigned/localised spectra (turbo-SLoMo 0.05 in DT or DDNL experiments) and we found that 237/258 of these assignments (based on the highest turbo-SLoMo score) were validated by other spectra. Of the remaining 21 conflicting spectral pairs for which we could not validate the site assignment, 20 were assigned by a higher scoring CID spectrum and one by a higher scoring ETD spectrum Fig. 5–Confidence of CID and ETD spectral pair identifications
in DDNL experiments. Venn diagrams showing the breakdown of spectral pairs in DDNL experiments; of the 47,641 spectral pairs acquired, 21,341 (44.8%) identified the same peptide sequence by both CID and ETD without any filtering of Mascot Percolator scores (all PSMs irrespective of peptide confidence). 88.4% of these sequence matching pairs identified
phosphopeptides, 97.5% (18,407) of which had a PEP of 0.05 or less and 94.3% (17,802) had a PEP of 0.01 or less. This result indicates that if the same peptide sequence is identified by both CID and ETD in a spectral pair that the identification is highly likely to be correct as assessed by Mascot Percolator. Of 12,618 high confidence spectral pairs (PEP of 0.01 in CID and ETD, 11,622 (92.11%)) could be assigned exact sites of phosphorylation using turbo-SLoMo (FLR 0.05).
[image:10.595.54.281.52.533.2] [image:10.595.308.535.67.438.2]pointing perhaps to the increased false localisation rate associated with assignments from CID spectra. The very small number of confidently assigned (by turbo-SLoMo) sites that are conflicting between CID and ETD spectral pairs supports the notion that there is little gas-phase relocation of phosphate groups in CID fragmentation[39,40].
In total, 11,622 (92.1%) high confidence CID/ETD pairs resulted in confident phosphorylation site assignment (Table 3a). By comparison, of 15,321 spectral pairs in which only the CID spectrum gave a confident peptide identification (0.01 PEP threshold), 7650 (49.9%) gave a confident phosphorylation site assignment. Of 5336 spectral pairs in which only the ETD spectrum gave a confident peptide identification (0.01 PEP threshold), 4146 (76.9%) gave a confident phosphorylation site assignment. For the DT experiments, application of adjusted turbo-SLoMo score thresholds resulted in confident site assign-ment of 17,873 (54.9%) CID spectra and 8334 (64.5%) ETD spectra (Table 3b). Overall, we have shown that ETD is better for
phosphorylation assignment than CID (Table 3) at 5% FLR, if adjusted turbo-SLoMo score thresholds are used.
3.5. TheP. falciparumproteome and phosphoproteome
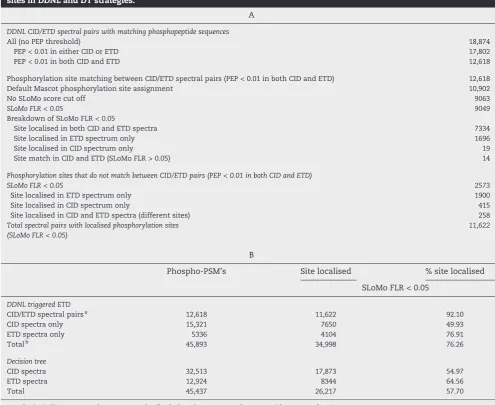
[image:11.595.51.547.81.486.2]The combined use of triplicate DT and DDNL analyses resulted in the identification of 4409 unique phosphopeptide sequences (mapping to 1225 unique phosphoproteins) with an overlap in identifications of 72.5% (Fig. S3c). This is a significant number of phosphopeptide identifications given that the P. falciparum genome contains only approximately 5300 genes[41]and extensive phosphopeptide fractionation was not employed. In total, 2899 unique phosphorylation sites (0.01 PEP, 5% FLR thresholds) were localised at high confidence (Table S4). We also performed proteome profiling experiments from schizont digests (starting material that was used for phosphorylation analysis) using direct LC–MS/MS analyses; triplicate experiments using CID fragmentation and triplicate Table 3–(A) Phosphorylation site assignment for high confidence spectral pairs. (B): Summary of localised phosphorylation sites in DDNL and DT strategies.
A
DDNL CID/ETD spectral pairs with matching phosphopeptide sequences
All (no PEP threshold) 18,874
PEP < 0.01 in either CID or ETD 17,802
PEP < 0.01 in both CID and ETD 12,618
Phosphorylation site matching between CID/ETD spectral pairs (PEP < 0.01 in both CID and ETD) 12,618
Default Mascot phosphorylation site assignment 10,902
No SLoMo score cut off 9063
SLoMo FLR < 0.05 9049
Breakdown of SLoMo FLR < 0.05
Site localised in both CID and ETD spectra 7334
Site localised in ETD spectrum only 1696
Site localised in CID spectrum only 19
Site match in CID and ETD (SLoMo FLR > 0.05) 14
Phosphorylation sites that do not match between CID/ETD pairs (PEP < 0.01 in both CID and ETD)
SLoMo FLR < 0.05 2573
Site localised in ETD spectrum only 1900
Site localised in CID spectrum only 415
Site localised in CID and ETD spectra (different sites) 258
Total spectral pairs with localised phosphorylation sites (SLoMo FLR < 0.05)
11,622
B
Phospho-PSM's Site localised % site localised
SLoMo FLR < 0.05
DDNL triggered ETD
CID/ETD spectral pairsa 12,618 11,622 92.10
CID spectra only 15,321 7650 49.93
ETD spectra only 5336 4104 76.91
Totalb 45,893 34,998 76.26
Decision tree
CID spectra 32,513 17,873 54.97
ETD spectra 12,924 8344 64.56
Total 45,437 26,217 57.70
Results in italics were used to generate the final phosphoproteome datasets with an FLR of <5%.
a Spectral pairs.
DT experiments with 4-hour LC gradients. 1857 proteins were identified in CID-only experiments and 1770 proteins identi-fied in DT experiments with an overlap of 1630 (82%) proteins (Fig. S5 & Table S5).
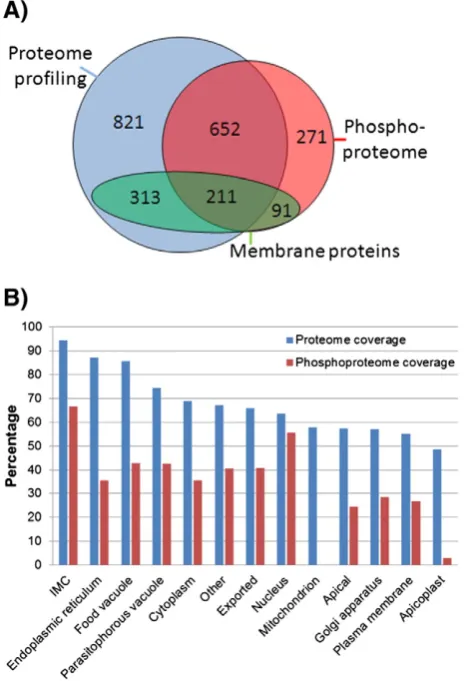
Overall, we report identification of 2359 P. falciparum schizont proteins (Fig. 7), almost half of the predicted proteome. 70% of proteins identified in phosphorylation experiments were also identified in proteome profiling experiments and an additional 362 phosphoproteins (15% of total protein identifica-tions) were only identified in the phosphorylation experiments, most likely comprising proteins expressed at low levels that are only identified after an enrichment step such as IMAC. In addition, we observed good coverage of membrane protein phosphorylation, 615 proteins with transmembrane domains were identified, 49% of which we identified with phosphoryla-tion sites, which is a good indicaphosphoryla-tion that efficient protein extraction and sufficient phosphoproteome depth were achieved (Fig. 7A). Furthermore, comparison of this dataset to
the palmitoylated complement of the P. falciparumproteome
[42] reveals that 184 proteins are both phosphorylated and palmitoylated indicating potential dual regulation of these proteins at membranes.
We assessed the coverage of our proteome and phos-phoproteome data in terms of experimentally annotated protein localisation using the ApiLoc database (Fig. 7B). The highest coverage (identified/annotated) was observed for inner membrane complex proteins; 95% of annotated IMC proteins were identified in proteome profiling experiments and 67% were identified in phosphorylation experiments. The IMC is a complex cytoskeletal structure that plays a role in both the development of merozoites within an infected erythrocyte and also the invasion of new host erythrocytes after merozoites are released. The enrichment of phosphorylation sites in IMC proteins implies that the IMC is a dynamically regulated organelle, with phosphorylation potentially regulating the merozoite shape changes that accompany development and invasion. The largest class of phosphoproteins was localised to the nucleus (35 proteins), closely followed by cytoplasmic (32 proteins) and exported proteins (31 proteins). We found a striking lack of phosphorylation in proteins localised to the Apicoplast (17 proteins identified, 1/17 phosphorylated) and to the mitochondrion (15 proteins identified, 0/15 proteins phos-phorylated). This may be explained by the ancestral origins of these subcellular structures, in which phosphorylation is not as widespread[43,44].
Until recently[44–46], it was thought that tyrosine phos-phorylation did not occur on plasmodium proteins because genes coding for tyrosine kinases could not be identified in their genomes. However, phosphoproteomic identification of putative tyrosine phosphorylation has been validated for two proteins [45]. We have also analysed our data to look for tyrosine phosphorylation and we have generated a putative list of 70 tyrosine phosphorylation sites (Table S6). Of these, four are from contaminating human proteins (all four are known phosphorylation sites) and another four were also identified as being tyrosine phosphorylated inP. falciparumby Treeck and co-workers [44]. Our set of 70 putative tyrosine phosphorylation sites contains 18 that were identified by multiple PSMs, and are therefore more confident and would be a good starting point for further experimental validation.
4. Conclusions
The combined use of multiple fragmentation methods for analysis of complex peptide mixtures has been an attractive approach to increase proteome coverage but has been limited by appropriate data analysis pipelines to efficiently analyse and score different data types[30,37,47]. The use of Mascot Percolator to analyse CID and ETD spectral pairs allowed us to perform a direct comparison of these fragmentation tech-niques for large-scale phosphoproteomics. The overlap in phosphopeptide identifications for high confidence CID/ETD spectral pairs was over 70% but generally ETD produced PSMs with significantly better PEP scores than paired CID spectra. Although, both fragmentation methods can lead to confident identification of the same phosphopeptide in many cases, confident assignment of phosphorylation sites benefits from Fig. 7–ThePlasmodium falciparumproteome and
phosphoproteome. A: Venn diagram of the overlap of proteins identified in proteome profiling experiments with
[image:12.595.51.284.302.643.2]acquisition of spectral pairs and in particular fragmentation by ETD. The use of merged CID/ETD spectra[30]and hybrid fragmentation techniques such as EThcD[47,48]offers potential routes to maximise complementarity of alternative fragmenta-tion methods, particularly for phosphorylafragmenta-tion site localisafragmenta-tion
[48]. These approaches are currently limited by increased spectral complexity and the increased number of ion series necessary for database searching which ultimately require increased score thresholds necessary to maintain false discov-ery rates.
Targeted analysis of phosphopeptides by CID and ETD as implemented in the DDNL strategy allows acquisition of spectral pairs that self-validate both at the level of phosphopeptide identification and phosphorylation site localisation. This extra confidence comes without loss in sensitivity and represents a straightforward approach for stringent phosphoproteome anal-ysis. Importantly, data from DDNL experiments allowed us to validate our data analysis workflow (using data from biological samples) though using self-validation of identifications and phosphorylation site assignments from spectral pairs. We conclude that Mascot Percolator and turbo-SLoMo are ideally suited for large scale analysis of protein phosphorylation using CID and ETD fragmentation.
Supplementary data to this article can be found online at
http://dx.doi.org/10.1016/j.jprot.2014.03.010.
Conflicts of interest
All authors declare no financial/commercial conflicts of interest.
Acknowledgements
We would like to thank Graeme McAlister for advice on decision tree acquisition, Simone Lemeer for advice on calculating Mascot delta scores, Bernhard Kuster for access to phospho-peptide library data, Min-Sik Kim for providing detailed results of search engine comparisons described in[30] and Rachael Bashford-Rogers for assisting in preliminary analysis of phosphoproteomic data.
R E F E R E N C E S
[1] Ficarro SB, McCleland ML, Stukenberg PT, Burke DJ, Ross MM, Shabanowitz J, et al. Phosphoproteome analysis by mass spectrometry and its application toSaccharomyces cerevisiae. Nat Biotechnol 2002;20:301–5.
[2] Larsen MR, Thingholm TE, Jensen ON, Roepstorff P, Jorgensen TJ. Highly selective enrichment of phosphorylated peptides from peptide mixtures using titanium dioxide microcolumns. Mol Cell Proteomics 2005;4:873–86.
[3] Villen J, Beausoleil SA, Gerber SA, Gygi SP. Large-scale phosphorylation analysis of mouse liver. Proc Natl Acad Sci U S A 2007;104:1488–93.
[4] McNulty DE, Annan RS. Hydrophilic interaction chromatography reduces the complexity of the phosphoproteome and improves global phosphopeptide isolation and detection. Mol Cell Proteomics 2008;7:971–80.
[5]Thingholm TE, Jensen ON, Robinson PJ, Larsen MR. SIMAC (sequential elution from IMAC), a phosphoproteomics strat-egy for the rapid separation of monophosphorylated from multiply phosphorylated peptides. Mol Cell Proteomics 2008;7:661–71.
[6]Syka JE, Coon JJ, Schroeder MJ, Shabanowitz J, Hunt DF. Peptide and protein sequence analysis by electron transfer dissociation mass spectrometry. Proc Natl Acad Sci U S A 2004;101:9528–33.
[7]Choudhary C, Kumar C, Gnad F, Nielsen ML, Rehman M, Walther TC, et al. Lysine acetylation targets protein complexes and co-regulates major cellular functions. Science
2009;325:834–40.
[8]Wagner SA, Beli P, Weinert BT, Nielsen ML, Cox J, Mann M, et al. A proteome-wide, quantitative survey of in vivo ubiquitylation sites reveals widespread regulatory roles. Mol Cell Proteomics 2011;10:013284-1–013284-13.
[9]Wang Z, Gucek M, Hart GW. Cross-talk between GlcNAcylation and phosphorylation: site-specific phosphorylation dynamics in response to globally elevated O-GlcNAc. Proc Natl Acad Sci U S A 2008;105:13793–8.
[10] McAlister GC, Phanstiel D, Good DM, Berggren WT, Coon JJ. Implementation of electron-transfer dissociation on a hybrid linear ion trap–orbitrap mass spectrometer. Anal Chem 2007;79:3525–34.
[11] Good DM, Wirtala M, McAlister GC, Coon JJ. Performance characteristics of electron transfer dissociation mass spectrometry. Mol Cell Proteomics 2007;6:1942–51.
[12] Hunter AP, Games DE. Chromatographic and mass spectrometric methods for the identification of phosphorylation sites in phosphoproteins. Rapid Commun Mass Spectrom 1994;8:559–70.
[13] DeGnore JP, Qin J. Fragmentation of phosphopeptides in an ion trap mass spectrometer. J Am Soc Mass Spectrom 1998;9:1175–88.
[14] Mikesh LM, Ueberheide B, Chi A, Coon JJ, Syka JE,
Shabanowitz J, et al. The utility of ETD mass spectrometry in proteomic analysis. Biochim Biophys Acta 2006;1764:1811–22.
[15] Swaney DL, McAlister GC, Coon JJ. Decision tree-driven tandem mass spectrometry for shotgun proteomics. Nat Methods 2008;5:959–64.
[16] Compton PD, Strukl JV, Bai DL, Shabanowitz J, Hunt DF. Optimization of electron transfer dissociation via informed selection of reagents and operating parameters. Anal Chem 2012;84:1781–5.
[17] Brosch M, Yu L, Hubbard T, Choudhary J. Accurate and sensitive peptide identification with Mascot Percolator. J Proteome Res 2009;8:3176–81.
[18] Wright JC, Collins MO, Yu L, Kall L, Brosch M, Choudhary JS. Enhanced peptide identification by electron transfer dissociation using an improved mascot percolator. Mol Cell Proteomics 2012;11:478–91.
[19] Baker PR, Medzihradszky KF, Chalkley RJ. Improving software performance for peptide electron transfer dissociation data analysis by implementation of charge state- and sequence-dependent scoring. Mol Cell Proteomics 2010;9:1795–803.
[20] Molina H, Horn DM, Tang N, Mathivanan S, Pandey A. Global proteomic profiling of phosphopeptides using electron transfer dissociation tandem mass spectrometry. Proc Natl Acad Sci U S A 2007;104:2199–204.
[21] Chalkley RJ, Clauser KR. Modification site localization scoring: strategies and performance. Mol Cell Proteomics
2012;11:3–14.
[22] Savitski MM, Lemeer S, Boesche M, Lang M, Mathieson T, Bantscheff M, et al. Confident phosphorylation site localization using the Mascot Delta Score. Mol Cell Proteomics 2011;10 [M110 003830].
phosphorylation analysis and site localization. Nat Biotechnol 2006;24:1285–92.
[24] Taus T, Kocher T, Pichler P, Paschke C, Schmidt A, Henrich C, et al. Universal and confident phosphorylation site localization using phosphoRS. J Proteome Res 2011;10:5354–62.
[25] Bailey CM, Sweet SM, Cunningham DL, Zeller M, Heath JK, Cooper HJ. SLoMo: automated site localization of modifications from ETD/ECD mass spectra. J Proteome Res 2009;8:1965–71.
[26] Manza LL, Stamer SL, Ham AJ, Codreanu SG, Liebler DC. Sample preparation and digestion for proteomic analyses using spin filters. Proteomics 2005;5:1742–5.
[27] Wisniewski JR, Zougman A, Nagaraj N, Mann M. Universal sample preparation method for proteome analysis. Nat Methods 2009;6:359–62.
[28] Kokubu M, Ishihama Y, Sato T, Nagasu T, Oda Y. Specificity of immobilized metal affinity-based IMAC/C18 tip enrichment of phosphopeptides for protein phosphorylation analysis. Anal Chem 2005;77:5144–54.
[29] Vizcaino JA, Cote R, Reisinger F, Barsnes H, Foster JM, Rameseder J, et al. The Proteomics Identifications database: 2010 update. Nucleic Acids Res 2010;38:D736–42.
[30] Kim MS, Zhong J, Kandasamy K, Delanghe B, Pandey A. Systematic evaluation of alternating CID and ETD fragmentation for phosphorylated peptides. Proteomics 2011;11:2568–72.
[31] Kall L, Canterbury JD, Weston J, Noble WS, MacCoss MJ. Semi-supervised learning for peptide identification from shotgun proteomics datasets. Nat Methods 2007;4:923–5.
[32] Yang P, Ma J, Wang P, Zhu Y, Zhou BB, Yang YH. Improving X! Tandem on peptide identification from mass spectrometry by self-boosted Percolator. IEEE/ACM Trans Comput Biol Bioinform 2012;9:1273–80.
[33] Swaney DL, Wenger CD, Thomson JA, Coon JJ. Human embryonic stem cell phosphoproteome revealed by electron transfer dissociation tandem mass spectrometry. Proc Natl Acad Sci U S A 2009;106:995–1000.
[34] Sweet SM, Creese AJ, Cooper HJ. Strategy for the identification of sites of phosphorylation in proteins: neutral loss triggered electron capture dissociation. Anal Chem 2006;78:7563–9.
[35] Kall L, Storey JD, MacCoss MJ, Noble WS. Posterior error probabilities and false discovery rates: two sides of the same coin. J Proteome Res 2008;7:40–4.
[36] Brosch M, Saunders GI, Frankish A, Collins MO, Yu L, Wright J, et al. Shotgun proteomics aids discovery of novel protein-coding genes, alternative splicing, and“resurrected”pseudogenes in the mouse genome. Genome Res 2011;21:756–67.
[37] Molina H, Matthiesen R, Kandasamy K, Pandey A.
Comprehensive comparison of collision induced dissociation and electron transfer dissociation. Anal Chem
2008;80:4825–35.
[38] Hansen TA, Sylvester M, Jensen ON, Kjeldsen F. Automated and high confidence protein phosphorylation site localization using complementary collision-activated dissociation and electron transfer dissociation tandem mass spectrometry. Anal Chem 2012;84:9694–9.
[39] Aguiar M, Haas W, Beausoleil SA, Rush J, Gygi SP. Gas-phase rearrangements do not affect site localization reliability in phosphoproteomics data sets. J Proteome Res
2010;9:3103–7.
[40] Mischerikow N, Altelaar AF, Navarro JD, Mohammed S, Heck AJ. Comparative assessment of site assignments in CID and electron transfer dissociation spectra of phosphopeptides discloses limited relocation of phosphate groups. Mol Cell Proteomics 2010;9:2140–8.
[41] Gardner MJ, Hall N, Fung E, White O, Berriman M, Hyman RW, et al. Genome sequence of the human malaria parasite
Plasmodium falciparum. Nature 2002;419:498–511.
[42] Jones ML, Collins MO, Goulding D, Choudhary JS, Rayner JC. Analysis of protein palmitoylation reveals a pervasive role in
Plasmodiumdevelopment and pathogenesis. Cell Host Microbe 2012;12:246–58.
[43] Gnad F, Forner F, Zielinska DF, Birney E, Gunawardena J, Mann M. Evolutionary constraints of phosphorylation in eukaryotes, prokaryotes, and mitochondria. Mol Cell Proteomics 2010;9:2642–53.
[44] Treeck M, Sanders JL, Elias JE, Boothroyd JC. The
phosphoproteomes ofPlasmodium falciparumandToxoplasma gondiireveal unusual adaptations within and beyond the parasites' boundaries. Cell Host Microbe 2011;10:410–9.
[45] Solyakov L, Halbert J, Alam MM, Semblat JP, Dorin-Semblat D, Reininger L, et al. Global kinomic and phospho-proteomic analyses of the human malaria parasitePlasmodium falciparum. Nat Commun 2011;2:565.
[46] Lasonder E, Green JL, Camarda G, Talabani H, Holder AA, Langsley G, et al. ThePlasmodium falciparumschizont phospho-proteome reveals extensive
phosphatidylinositol and cAMP–protein kinase A signalling. J Proteome Res 2012;11:5323–37.
[47] Frese CK, Altelaar AF, van den Toorn H, Nolting D, Griep-Raming J, Heck AJ, et al. Toward full peptide sequence coverage by dual fragmentation combining electron-transfer and higher-energy collision dissociation tandem mass spectrometry. Anal Chem 2012;22:9668–73.