high-intensity parasite outbreaks
.
White Rose Research Online URL for this paper:
http://eprints.whiterose.ac.uk/95766/
Version: Published Version
Article:
Fox, Naomi J, Marion, Glenn, Davidson, Ross S et al. (2 more authors) (2015)
Climate-driven tipping-points could lead to sudden, high-intensity parasite outbreaks.
Royal Society Open Science. ISSN 2054-5703
https://doi.org/10.1098/rsos.140296
[email protected]
https://eprints.whiterose.ac.uk/
Reuse
This article is distributed under the terms of the Creative Commons Attribution (CC BY) licence. This licence
allows you to distribute, remix, tweak, and build upon the work, even commercially, as long as you credit the
authors for the original work. More information and the full terms of the licence here:
https://creativecommons.org/licenses/
Takedown
If you consider content in White Rose Research Online to be in breach of UK law, please notify us by
rsos.royalsocietypublishing.org
Research
Cite this article:Fox NJ, Marion G, Davidson RS, White PCL, Hutchings MR. 2015 Climate-driven tipping-points could lead to sudden, high-intensity parasite outbreaks.
R. Soc. open sci.2: 140296.
http://dx.doi.org/10.1098/rsos.140296
Received: 9 September 2014 Accepted: 23 April 2015
Subject Category:
Biology (whole organism)
Subject Areas:
ecology/health and disease and epidemiology/theoretical biology
Keywords:
climate change, helminth, livestock, nematode, parasite, temperature
Author for correspondence:
Naomi J. Fox
e-mail:[email protected]
Climate-driven
tipping-points could lead to sudden,
high-intensity parasite
outbreaks
Naomi J. Fox
1,2,3
, Glenn Marion
2
, Ross S. Davidson
1
,
Piran C. L. White
3
and Michael R. Hutchings
1
1Disease Systems Team, SRUC, King’s Building, West Mains Road,
Edinburgh EH9 3JG, UK
2Biomathematics and Statistics Scotland, King’s Buildings, West Mains Road,
Edinburgh EH9 3JZ, UK
3Department of Environment, University of York, Heslington, York YO10 5DD, UK
Parasitic nematodes represent one of the most pervasive and significant challenges to grazing livestock, and their intensity and distribution are strongly influenced by climate. Parasite levels and species composition have already shifted under climate change, with nematode parasite intensity frequently low in newly colonized areas, but sudden large-scale outbreaks are becoming increasingly common. These outbreaks compromise both food security and animal welfare, yet there is a paucity of predictions on how climate change will influence livestock parasites. This study aims to assess how climate change can affect parasite risk. Using a process-based approach, we determine how changes in temperature-sensitive elements of outbreaks influence parasite dynamics, to explore the potential for climate change to influence livestock helminth infections. We show that changes in temperate-sensitive parameters can result in nonlinear responses in outbreak dynamics, leading to distinct ‘tipping-points’ in nematode parasite burdens. Through applying two mechanistic models, of varying complexity, our approach demonstrates that these nonlinear responses are robust to the inclusion of a number of realistic processes that are present in livestock systems. Our study demonstrates that small changes in climatic conditions around critical thresholds may result in dramatic changes in parasite burdens.
1. Introduction
The distribution and abundance of livestock helminths (parasitic worms) has been shifting and increasing in temperate regions [1–3], with climate change implicated as one of the main
2
rsos
.ro
yalsociet
ypublishing
.or
g
R.
Soc
.open
sc
i.
2
:1
40
29
6
...
drivers [1,4,5]. With potential for further climate-driven increases in parasite prevalence and intensity, and the consequent welfare and economic implications, there is a need to understand the impacts of climate change on macro-parasite transmission. Helminth infections in temperate regions were historically limited to species better adapted to colder climes e.g. Ostertagia ostertagi, Teladorsagia circumcincta,Cooperiaspp.,Trichostrongylusspp. andNematodirusspp. However, helminth abundance and species composition have changed in temperate regions [1,2,6], with an increase in tropically adapted species such asHaemonchus contortus, which typically dominates in regions with hot summers [7].
Although the range ofH. contortushas expanded, outbreak intensity remains low across much of its new range [6,8]. With parasite burdens not high enough to cause clinical cases in most of this new range, few stakeholders are taking proactive measures to limit parasite spread, remaining unconcerned about gradual range expansions. However, heavy infections are now occurring sporadically in newly affected areas and pathological heamonchosis cases are becoming an increasing problem for farmers [6]. Changing outbreak patterns are thus physically and economically damaging, as parasitism is characterized by weight loss, lower milk yield, condition loss, abortion and infertility, with heavy infections causing host mortality [9,10]. It is not yet understood what is driving this pattern of increasingly widespread low level infection with sporadic high-intensity outbreaks, although changing climate is a possible driver.
Climate change will impact various elements of helminth growth and transmission, and the influence of abiotic conditions on key life cycle parameters has been extensively studied [7,11]. Temperature is the predominant influence on free-living stages; increased temperatures drive an increase in parasite development rate for a majority of livestock helminths [12,13]. However, extreme temperatures can be inimical to larval survival [13], with thermal tolerance ranges varying between parasite species [7]. In addition to influencing larval survival and development within a grazing season, temperature also affects over-winter survival and thus availability of infective larvae at the start of the following grazing season. It is these larvae that initiate infections early in the year when naive hosts are turned out to pasture [14].
A number of studies have aimed to link past changes in helminth distributions and abundance with climate change [1–3,15], yet lack of long-term active surveillance data means the relationship between climate and outbreak patterns has yet to be quantified [16]. Given the lack of data, we address this issue using a process-based modelling approach to explore the potential for climate change to influence the dynamics of livestock helminth infections. The basis of this approach is that where key processes are sufficiently well understood, models can be used to explore the potential behaviour of a system under new conditions. Such an approach allows predictions of likely outcomes under future scenarios, and assessment of the robustness of such conclusions under a range of assumptions.
Our approach is based on a generic model of helminth transmission dynamics developed by Roberts & Grenfell [17] which has previously been shown to recreate general helminth infection patterns observed in managed grazing systems [17–19]. One criticism of this work is that the exposure sub-model fails to account for spatial and temporal heterogeneity in parasite risk generated by the interaction of variations in host burden, individual grazing and avoidance behaviour and the dynamics and spatial distribution of parasites. It is important to incorporate these elements when exploring the effects of changing larval development times, as the risk to hosts depends jointly on the rate at which parasite larvae become infective and the rate at which a patch is grazed. We therefore combine this helminth transmission dynamics model with a model describing the spatial and temporal dynamics of host grazing. This grazing model is based on empirical rules of thumb describing grazing and faecal avoidance behaviour [20–24] and has been shown to reproduce emergent patterns observed at the field scale in experimental systems [22,25–28].
Using this process-based approach, we aim to determine how changes in temperature-sensitive elements of outbreaks influence macro-parasite dynamics, to explore the potential for climate change to influence livestock helminth infections. Specifically, we explore the influence of: (i) changing development rates of parasites’ free-living stages; (ii) changing death rates of free-living stages; (iii) host grazing behaviours under a changing climate; and (iv) over-winter survival of the parasites’ free-living stages.
2. Material and methods
3
rsos
.ro
yalsociet
ypublishing
.or
g
R.
Soc
.open
sc
i.
2
:1
40
29
[image:4.522.51.477.61.140.2]6
...
Table 1.Summary of states in the non-spatial, population-level model.
states notation
free-living pre-infective larvae l
. . . .
free-living infective larvae L
. . . .
adult parasites in host A
. . . .
acquired immunity r
. . . .
population-level model (based on that developed by Roberts & Grenfell [17]) is initially used to explore the fundamental influence of changing key temperature-sensitive parameters (larval development and survival) on parasite burdens. Through an extension of this model, these fundamental patterns are then explored within the context of a wider system of interacting processes that have been shown to influence outbreak dynamics [29]. These models represent nematode parasites transmitted via the faecal oral route, within a managed livestock production system. Both models were simulated as stochastic, discrete state-space event-based Markov processes using the Gillespie algorithm [30].
2.1. Non-spatial, population-level model
The non-spatial, population-level model encapsulates the dynamics of directly transmitted gastro-intestinal nematode infection in managed ruminant populations. It is based on that proposed by Roberts & Grenfell [17] and later developed by Marionet al.[19], who used a stochastic formulation to better reflect the variability in biological systems. Roberts & Grenfell [17] distilled helminth transmission down to three variables (adult parasites in the host, parasite larvae on pasture and host immunity), and were able to recreate the general infection patterns observed in managed grazing systems. However, the inclusion of additional elements was required to address how changing temperatures could affect outbreak dynamics. Helminth parasites can spend a large part of their life cycle outside of the definitive host, and survival and development of the free-living stages is affected by changes in temperature. Hence, exploring effects of temperature changes on outbreak patterns requires inclusion of survival and development of the parasites’ free-living stages.
In our model, the principal features of parasite transmission are represented by four state variables: mean population of free-living pre-infective larvae,l, mean population of free-living infective larvae,
L, mean intensity of adult parasites in the host,Aand the level of acquired immunity, r. The model incorporates the probability that any egg will hatch, q, the rate at which host immunity is lost in the absence of infection, σ, the probability of larvae dying, ρ, contact rate, β and the rate of larval development on pasture,α, as well as the rate of egg production,λ(r), adult mortality rate,µ(r) and the probability ingested larvae become adults,p(r), which are functions of the level of immunity in the host. Tables1–3summarize all states, parameters and events in the non-spatial, individual-level model.
The influence of changes in temperature-sensitive elements on outbreak dynamics (larvae survival and development) were first explored with this simple, non-spatial, population-level model. For gastro-intestinal nematodes of herbivores, development times vary from less than one week to over a month [11,13,32,33]. The development rate of parasites on pasture, from non-infective to infective stages, increases with temperature [12,34,35]. Mean temperatures are projected to increase under climate change, and an increase in extreme weather events is also expected [36]. This increase in temperature will increase the development rates of the parasites’ free-living stages. Here, we explore the potential impacts of increasing temperatures on parasite burden implicitly through changes in the development rate of the parasite’s free-living stages. Larval development rates were varied to give on-pasture development times ranging from no development to a fast development time of around 3 days (development rate of 0.0002 min−1;figure 2). Larval death rates were varied to give average on-pasture survival times ranging
from around 3 days (death rate of 0.0002 min−1) to around 35 days (death rate of 0.00002 min−1;figure 3).
4
rsos
.ro
yalsociet
ypublishing
.or
g
R.
Soc
.open
sc
i.
2
:1
40
29
[image:5.522.54.468.72.214.2] [image:5.522.56.485.260.427.2]6
...
Table 2.Summary of parameters in the non-spatial, population-level model. (All parameters are in units of min−1, exceptp,qandr which are dimension free.)
parameter notation value
death of larvae ρ 0.000015 [11,31]
. . . .
contact rate β 6.9×10⁻⁷[17]
. . . .
larval development α 0.00005 [11,13,32,33]
. . . .
egg hatch probability q 0.35 [17]
. . . .
loss of immunity σ 1.9×10⁻⁸[17]
. . . .
rate of egg production λ(r) 2 [17]
. . . .
probability ingested larvae become adults p(r) 0.65 [17]
. . . .
death of adult larvae µ(r) 0.0000047 [17]
. . . .
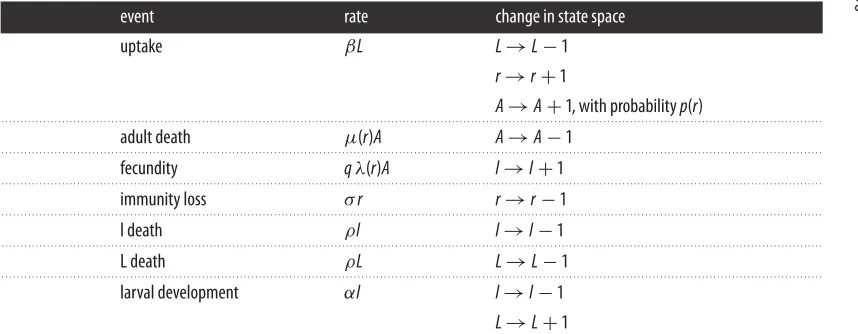
Table 3.Summary of events for non-spatial, population-level model.
event rate change in state space
uptake βL L→L−1
r→r+1
A→A+1, with probabilityp(r)
. . . .
adult death µ(r)A A→A−1
. . . .
fecundity qλ(r)A l→l+1
. . . .
immunity loss σr r→r−1
. . . .
l death ρl l→l−1
. . . .
L death ρL L→L−1
. . . .
larval development αl l→l−1
L→L+1
. . . .
detailed above. Over the range of simulations, both measures provided qualitatively similar results. Peak parasite intensity is used as a measure of infection here as it is a more intuitive measure than the area under the curve, and can be compared to empirical data. If cumulative burden was chosen instead as a measure of parasitism, the trends shown in the results, and the conclusions, would remain the same.
2.2. Spatially explicit, individual-level model
The non-spatial, population-level model detailed above captures the basic processes in helminth infections and highlights fundamental trends in outbreak dynamics that result from changes in larval survival and development. However, it is imperative to consider climate-sensitive elements of transmission within the context of a wider system of interacting processes.
5
rsos
.ro
yalsociet
ypublishing
.or
g
R.
Soc
.open
sc
i.
2
:1
40
29
[image:6.522.150.373.43.176.2]6
...
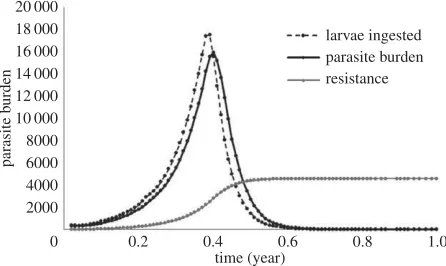
20 000 18 000 16 000 14 000 12 000 10 000 8000 6000 4000 2000
0 0.2 0.4
time (year)
parasite b
urden
0.6 0.8 1.0
larvae ingested parasite burden resistance
Figure 1.Parasite dynamics over one grazing season. Host–parasite burden, L3 ingested per day and host resistance level over one grazing season, for one run of the non-spatial, individual-based model, using the standard parameter values detailed above.
rules to recreate grazing behaviours observed at multiple scales. At the bite scale host grazing decisions regarding faecal avoidance and sward selection matched empirical observations of grazing behaviour, while at the field scale resource distribution matched that observed in set stocked grazing systems [20]. This element of the model is described in detail in [22,25–28].
In Foxet al.[29], this model was further developed to incorporate helminth parasite transmission. This work demonstrated that host grazing behaviour affects both the timing and magnitude of peak parasite burdens [29]. Foxet al.[29] also demonstrated that the spatial clumping of parasites on pasture shown in the model matches empirically measured distributions of parasites [40]. If this spatial heterogeneity in risk is not incorporated, then outbreak severity can be underestimated [29]. The ability if the model to recreate these grazing behaviours and the spatio-temporal variation in risk and resources is fundamental, as it determines the timing at which hosts contact the free-living parasite larvae.
To determine the impact of host grazing behaviour when exploring changes in survival and development of the parasites’ free-living stages we use the spatially explicit, individual-based model developed by Foxet al. [29]. This model is a further development of the non-spatial model but also incorporates the wider elements of the transmission process. These include development of parasites within hosts, spatial heterogeneity of resources, pathogens and perceived pathogen risk, and host grazing behaviours, in addition to all elements incorporated in the simpler model described above.
The spatially explicit, individual-based model incorporates the key elements of pathogen population dynamics on pasture and in the host in addition to host grazing behaviour. The model was developed by Marionet al. [25] and Foxet al. [29]. A cohort ofDanimals (labelledk=1. . .D) move around a lattice of
Npatches (labelledi=1. . .N), making grazing decisions based on the sward heighthiat that patch and the level of faecal contaminationfi. The patch and animal state variables are outlined intable 1. All state variables within the model are assumed to be integers.
The rate of movement from patchito patchjis modelled as (v/z(i))F(i,j)hj, wherevis the intrinsic movement rate andhjis the sward height at patchj, using the normalization factor
z(i)=
j∈Ni
F(i,j).
The search kernelF(i,j) follows the power-lawF(i,j)= |i−j|−αin which|i−j|is the Euclidean distance between patchiandj. Sward growth is modelled logistically with the rate of increase at patchigiven by
γhi
1− hi hmax
,
whereγ is the intrinsic growth rate of the sward, andhmaxis the maximum sward height attainable. A
self-limiting growth function is used to prevent exponential growth of ungrazed patches. This logistic growth function also allows for the variation in grass growth rate with changing sward height [41]. Sward height is measured in units of bite size, where one unit is equal to one cattle bite of 0.001 m2[42],
and each patch is set at 0.5 m2as this is the typical area affected by cattle faecal contamination and the
6
rsos
.ro
yalsociet
ypublishing
.or
g
R.
Soc
.open
sc
i.
2
:1
40
29
[image:7.522.55.472.59.276.2]6
...
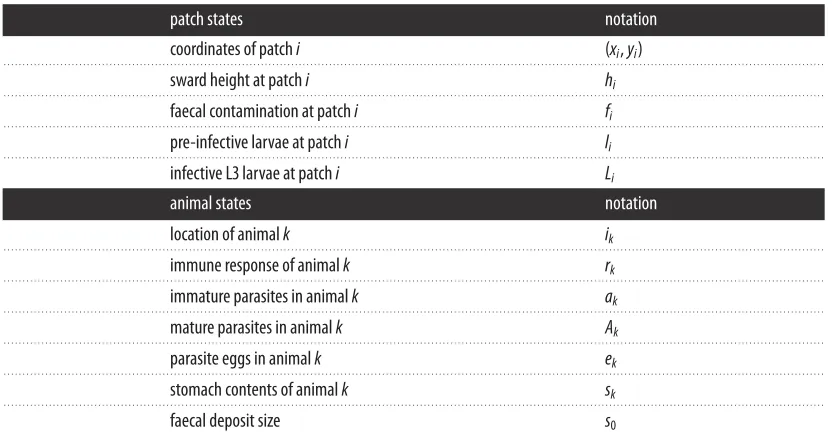
Table 4.Summary of state variables in the spatial, individual-based model.
patch states notation
coordinates of patchi (xi,yi)
. . . .
sward height at patchi hi
. . . .
faecal contamination at patchi fi
. . . .
pre-infective larvae at patchi li
. . . .
infective L3 larvae at patchi Li
animal states notation
. . . .
location of animalk ik
. . . .
immune response of animalk rk
. . . .
immature parasites in animalk ak
. . . .
mature parasites in animalk Ak
. . . .
parasite eggs in animalk ek
. . . .
stomach contents of animalk sk
. . . .
faecal deposit size s0
. . . .
livestock typically graze sward to a minimal level. For example, cattle typically graze sward down to 2 cm [42], leaving a portion of ungrazed sward to recover. This is reflected here, with an ungrazeable portion of grass (h0) being considered when calculating the probability of a bite occurring at a certain
patch. Each 0.5 m2patch contains a minimum of 50 bites of forage, each patch has an initial sward height of 200 bites and a maximum sward height of 400 bites. The sward growth rate is calculated to provide a set stock scenario where sward growth is equal to an overall herbivore intake of 30 000 bites per day [42]. The bite rate function leads to a linear relationship between number of bites per visit to a patch, and the sward height at that patch upon arrival. This is consistent with the behavioural observation that bite depth is proportional to sward height [43].
The sward height of a given patch is reduced byBwhen an animal grazes at that location, while the stomach contentskof the corresponding animal is increased by one unit of sizeB. An individual takes a bite on its current patch at a rate
β(hi−h0)e−µfi(ak+Ak),
wherefirepresents the level of faecal contamination at patchi,µis the level of faecal avoidance,ak+Ak is the total number of parasites in hostk, andhois the minimum grazable portion in each patch. Thus, the bite rate is monotonically decreasing with the amount of faecal contamination and level of avoidance. The model also includes a daily intake requirementRkfor each animal [44]. The intake of each animal accumulates until its requirementRkis reached and is reset at the end of each day.
Each patch (labelledi=1. . .N) is assigned a numberliof pre-infective larvae as well as a numberLi of infective L3 stage larvae. Similarly, within each host (labelledk=1. . .D) separate variablesak,Akand
ekare introduced for the number of immature parasites, mature parasites and eggs, respectively. When an animal takes a bite of sizeB, the number of non-infective (li) and infective larvae (Li) on its current patch, decrease by
B hili and
B hiLi.
When an animal takes a bite of sizeB, the number of immature parasites in hostk,ak, increases by
θ(rk)B
hiLi,
whereθis the probability of ingested L3 larvae establishing and becoming immature larvae in the host, and is a monotonic non-increasing function ofr, representing the detrimental effect of resistance on parasite establishment. When infective larvae are ingested, the resistancerkof hostkincreases by
Li
7
rsos
.ro
yalsociet
ypublishing
.or
g
R.
Soc
.open
sc
i.
2
:1
40
29
[image:8.522.55.477.55.459.2]6
...
Table 5.Summary of events in the spatial, individual-based model, for patchiand hostk.
each patch event rate rei change in state variables
growth of sward at patchi γhi(1−(hi/hmax)) hi→hi+1
. . . .
development of larvae at patchi εli li→li−1
Li→Li+1
. . . .
death of pre-infective larvae at patchi ωli li→li−1
. . . .
death of infective L3 at patchi ρLi Li→Li−1
. . . .
decay of faeces at patchi ϕfi fi→fi−1
animal event rate rek change in state variables
bite at current patchi, potential β(hi−h0)e−µkfi(ak+Ak) hi→hi−1
ingestion of infective and pre-infective larvae, Li→Li−(B/hi)Li
potential establishment of infective larvae li→li−(B/hi)li
and gain in immunity sk→sk+1
rk→rk+(B/hi)li ak→ak+θ(rk)(B/hi)Li
. . . .
death of immature adults in hostk ζak ak→ak−1
. . . .
maturity of adults in hostk χak ak→ak−1
Ak→Ak+1
. . . .
death of adults in hostk τ(rk)Ak Ak→Ak−1
. . . .
gain of immunity in hostkdue to parasite burden (ak+Ak)η rk→rk+1
. . . .
loss of immunity in hostk σrk rk→rk−1
. . . .
egg production in hostk λ(rk)Ak/2 ek→ek+1
. . . .
defecation by hostk fdep (sk−s0)Θ(sk−s0) ek→ek−((s0/sk)ek) ek→ek+((s0/sk)ek) sk→sk−so fi→fi+so
. . . .
movement of animalk v/(z(i))F(i,j)hj ik=i→ik=j
. . . .
whereψ is a resistance gain coefficient.rkalso increases as a function of the current parasite burden, at rate (ak+Ak)η, whereηis a second resistance gain coefficient. Death of immature parasites in the host occurs at a rateζak. Immature parasites develop into mature, egg producing adult parasites at a rateχak. Death of adults in hostkoccurs at rateτ(rk)Ak, whereτ(rk)>0 is a monotonic non-decreasing function which models the influence of acquired immunity on parasite mortality in the host. In the absence of exposure resistance in hostkdecays at rateσrk, following the model design of Roberts & Grenfell [17] and Marionet al.[19].
The number of eggs,ek, in hostkis affected by egg production from the dioecious parasites within the host at a rate
λ(rk)Ak
2 ,
whereλ(rk), the rate of egg production per adult parasite, is a monotonic non-increasing function ofrk. The rate of defecation for an individual in its current patch is fdep(sk−s0)Θ(sk−s0) where the
Heaviside function Θ(sk−s0) is unity if the stomach contents, sk, are greater than the faecal deposit size,s0, and is otherwise zero. Each faecal deposit is equivalent to 2000 bites of sward to reflect the cattle
8
rsos
.ro
yalsociet
ypublishing
.or
g
R.
Soc
.open
sc
i.
2
:1
40
29
[image:9.522.100.430.44.234.2] [image:9.522.59.469.302.600.2]6
...
16 000
14 000
12 000
10 000
8000
6000
4000
2000
0
development time (day)
larval development rate (× 105min–1)
peak parasite b
urden
35 10 7 5 4 3.5
0 2 4 6 8 10 12 14 16 18 20
Figure 2.Peak parasite burden over diferent larval development rates (±s.d.).
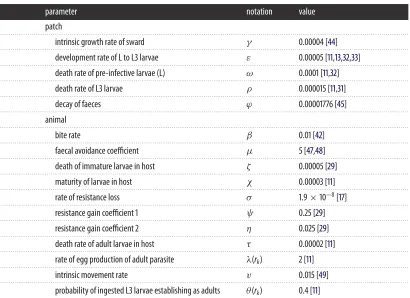
Table 6.Summary of parameters in the spatial, individual-based model. (All parameters are in units of min−1, exceptp,qandrwhich are dimension free.)
parameter notation value
patch
. . . .
intrinsic growth rate of sward γ 0.00004 [44]
. . . .
development rate of L to L3 larvae ε 0.00005 [11,13,32,33]
. . . .
death rate of pre-infective larvae (L) ω 0.0001 [11,32]
. . . .
death rate of L3 larvae ρ 0.000015 [11,31]
. . . .
decay of faeces ϕ 0.00001776 [45]
. . . .
animal
. . . .
bite rate β 0.01 [42]
. . . .
faecal avoidance coeicient µ 5 [47,48]
. . . .
death of immature larvae in host ζ 0.00005 [29]
. . . .
maturity of larvae in host χ 0.00003 [11]
. . . .
rate of resistance loss σ 1.9×10⁻⁸[17]
. . . .
resistance gain coeicient 1 ψ 0.25 [29]
. . . .
resistance gain coeicient 2 η 0.025 [29]
. . . .
death rate of adult larvae in host τ 0.00002 [11]
. . . .
rate of egg production of adult parasite λ(rk) 2 [11]
. . . .
intrinsic movement rate v 0.015 [49]
. . . .
probability of ingested L3 larvae establishing as adults θ(rk) 0.4 [11]
. . . .
model is simulated on the state-space variables (table 4) using the events and associated rates described intable 5, following the Gillespie algorithm [46]. Model parameters are listed intable 6.
For non-climate-driven parameters, parameter values were taken from Fox et al. [18]. When
9
rsos
.ro
yalsociet
ypublishing
.or
g
R.
Soc
.open
sc
i.
2
:1
40
29
[image:10.522.163.354.42.187.2] [image:10.522.144.380.243.382.2]6
...
35 000
30 000
25 000
20 000
15 000
10 000
5000
20 18 16 14 12 10 8 6 4 2 0
18 14 10 6 2
larval death rate (× 105min–1)
peak parasite b
urden
larv al de
velopment
rate (× 10
5min –1)
Figure 3.Inluence of larvae death and development rates on peak parasite burden.
25 000
20 000
15 000
10 000
5000
0 2 4 6 8 10 12 14
no faecal avoidance
realistic faecal avoidance levels
larval development rate (× 105min–1)
peak parasite b
urden
Figure 4.Peak parasite burdens over difering larval development rates for hosts with no faecal avoidance, and realistic levels of faecal avoidance behaviour (±s.d.).
24 000 infective larvae, distributed over 0.3% of randomly selected patches to reflect the aggregated distribution of larvae on pasture [40]. Each scenario was repeated over 10 realizations to account for the stochastic nature of the model.
When considering the importance of over-wintering larvae (figure 5), larvae development and death times varied from 10 weeks to one week. Simulations were initialized with uninfected hosts on pasture with low (12 000), medium (24 000) and high (48 000) numbers of infective larvae, distributed over 0.3% of randomly selected patches on the field.
3. Results
3.1. Outbreak dynamics
Using values outlined in table 2, the model successfully reproduces parasite dynamics observed in grazing livestock systems [17,51–54], with one run of the model shown infigure 1. The introduction of naive hosts onto contaminated pasture leads to a rapid rise in ingestion and establishment of infective parasite larvae, leading to a rise in parasite burden. The consequent increase in immunity then deleteriously affects parasite establishment and fecundity, leading to the subsequent decline in parasite burden.Figure 1illustrates the distinctive peak which is referred to here as the peak parasite burden.
3.2. Larval development
10
rsos
.ro
yalsociet
ypublishing
.or
g
R.
Soc
.open
sc
i.
2
:1
40
29
[image:11.522.151.372.41.442.2]6
...
10 000
8000
6000
4000
2000
0
10 000
8000
6000
4000
2000
0
10 000
8000
6000
4000
2000
0
10 9 8 7 6
5 4 3 2 1 3 5 7
9
larval death rate (× 105min–1
) larval de
velopment rate (×
105min
–1)
10 9 8 7 6 5 4
3 2 1 3 5 7 9 larval death rate (×
105min–1
) larval de
velopment rate (×
105min
–1)
10 9 8 7 6 5
4 3 2 1 3
5 7 9
larval death rate (× 105min–1
) larval de
velopment
rate (× 105min
–1)
peak parasite b
urden
peak parasite b
urden
peak parasite b
urden
(b)
(a)
(c)
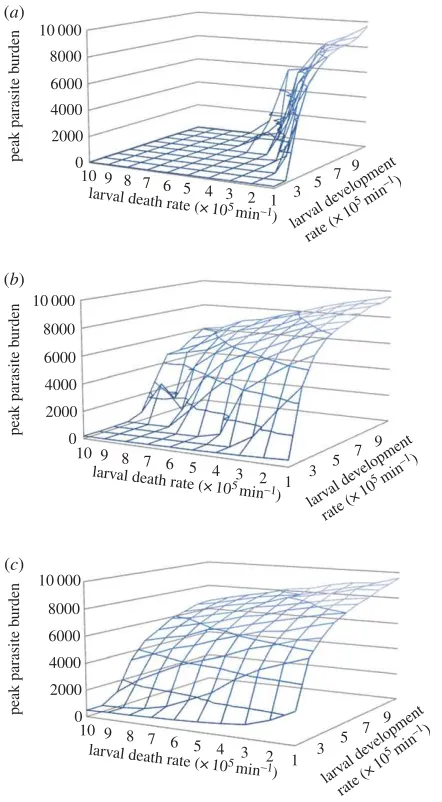
Figure 5.Inluence of larvae development and death rates on parasite burden. Initial infective larvae concentration on pasture (a) low (12 000 per ield), (b) medium (24 000 per ield), and (c) high (48 000 per ield).
times vary from less than one week to over five months [11,13,32,33]. To investigate how temperature-driven changes in development rate influence host–parasite burdens, simulations were run using the non-spatial, population-level model, across a range of values of the development rate parameter.
Simulations show that increasing development rates results in a nonlinear increase in parasite burdens, with a distinct tipping-point (figure 2).
3.3. Larval death rate
Increased summer temperatures can affect the death rates of free-living larvae [7]. Three-dimensional plots exploring changes in both larval development and death rates (again using the non-spatial, population-level model) show how these parameters influence parasite levels (figure 3).
Figure 3 illustrates that parasite burden is dependent on the relationship between parasite development and death rates, with the tipping-point for a specific development rate being pushed back as death rates increase.
3.4. The importance of livestock grazing behaviour and management
11
rsos
.ro
yalsociet
ypublishing
.or
g
R.
Soc
.open
sc
i.
2
:1
40
29
6
...
(larval development and survival) on parasite burden were again evident in this spatial, individual-based model, showing that the presence of the tipping-point is robust to spatial- and individual-level effects. Although the qualitative patterns observed are independent of which model is used, it remains important to consider wider elements of the system.Figure 4 shows how grazing behaviour (in this example, host faecal avoidance) influences both the position of the tipping-point and magnitude of peak parasite burdens.
3.5. Changes in over-winter larvae survival
Climate change will also influence over-winter larval survival, and thus the concentration of infective larvae at the start of the grazing season. To explore the influence of over-winter survival on transmission dynamics, the spatial individual-based model was used, as the aggregation of larvae on pasture can have significant impacts on outbreak likelihood and magnitude [29]. Runs were initiated with low, medium and high numbers of infective larvae on the field, distributed over 0.3% of randomly selected patches, reflecting the typically aggregated distribution of free-living larvae [40]. The influence of initial contamination levels was explored over the full range of larval death and development rates, with hosts showing realistic faecal avoidance levels.
The position of the tipping-point is influenced by the initial level of infective-larvae contamination on pasture at the start of the grazing year (figure 5), with higher initial levels giving rise to high-intensity outbreaks across a broader range of development and death rates.
4. Discussion
To explore the potential for climate change to influence outbreaks of livestock helminths, we determine the impact of variations in temperature-sensitive elements of the transmission process on host–parasite burdens.
4.1. Larval development
Temperature affects the development rates of parasites’ free-living stages, and simulations demonstrate that acceleration of larval development can lead to a nonlinear increase in parasite burdens, with a distinct tipping-point. This sudden rise is due to decreased development times allowing multiple generations of larvae to accumulate on pasture over one season, with the resultant feedback causing high-intensity outbreaks for parasites that would pose minimal risk under cooler climatic conditions. Consequently, a small change in temperature could result in a critical level being exceeded, leading to a sudden increase in parasite burdens with little warning. This could drive substantial increases in clinical cases of parasites that are currently widespread but at low intensities. The identification of this tipping-point provides a possible explanation for observed patterns ofH. contortusinfection in the UK (present at low levels across a wide thermal range, with occasional high-intensity outbreaks [6]), as inter-annual variability leads to the tipping-point being exceeded during warmer years. As summer temperatures continue to rise, high-intensity pathologicalH. contortusoutbreaks are likely to occur in more years and across a greater geographical range. Once the tipping-point has been exceeded, outbreak intensity is increasingly dependent on the host immune response.
12
rsos
.ro
yalsociet
ypublishing
.or
g
R.
Soc
.open
sc
i.
2
:1
40
29
6
...
4.2. Larval death rate
Survival of the parasites free-living stages will also be influenced by changing climatic conditions. Increased minimum temperatures will reduce death rates of species of tropical origin, which are vulnerable to low temperatures (e.g. H. contortus). Conversely, increased temperatures are likely to increase death rates of temperate species which are impervious to prolonged cold conditions but vulnerable at high temperatures (e.g.O. ostertagi) [13]. Changes in larval death rates will impact on parasite transmission and cause shifts in the tipping-point’s position (figure 3). The balance between development and death rates determines whether enough infective larvae are maintained for infections to perpetuate; climate change will sway the balance in opposing directions for different parasite species. Owing to the predominant influence of temperature on larval development and survival, we have focused on this aspect of climate change. However, transmission is affected by wider abiotic elements, and climate change is about more than just rising temperatures. Further changes in rainfall patterns and moisture availability are also predicted, and relative humidity has been shown to influence larval survival and development [31,55,56]. Hence, changes in rates explored above could be seen as representative of changes in both temperature and rainfall patterns. However, many helminth species avoid the main impacts of reduced moisture availability as humidity inside host faeces is sufficient to allow hatching, and shelter the larvae from desiccation; so temperature remains the most important climatic determinant of larval levels [12,55].
4.3. The importance of livestock grazing behaviour and management
Using the spatially explicit, population model, it was demonstrated that the presence of the tipping-point is robust to spatial and individual-level effects. Although the indicative patterns observed are independent of model complexity, there is a need for models which incorporate wider elements of the system as the differences in quantitative effects give indications of how specific control and management strategies will influence outbreaks in a changing climate. For example, host grazing behaviour influences both the magnitude of peak parasite burdens and the position of the tipping-point (figure 4). Hence changes in the host’s ability to demonstrate natural grazing behaviours, which is affected by its physiological state and management decisions [23,50], will influence parasite outbreaks. The importance of faecal avoidance on outbreak trends is due to changes in the timing of ingestion of free-living parasites. Grazing species have high faecal avoidance behaviours and are more at risk from pathogens that develop slowly in the environment and reach peak infectivity when faeces have decayed and grass has grown tall. By contrast, in the absence of faecal avoidance behaviour, hosts are at increased risk from parasites which develop quickly on pasture, while effectively diminishing risk from slow developing parasites by ingesting them before they become infective.
4.4. Changes in over-winter larvae survival
13
rsos
.ro
yalsociet
ypublishing
.or
g
R.
Soc
.open
sc
i.
2
:1
40
29
6
...5. Conclusion
Our results indicate that climate change can lead to nonlinear responses in infection dynamics, such that minor alterations in temperature around critical thresholds could cause dramatic shifts in outbreak intensity. This could lead to an increase in the frequency and geographical range of pathological cases for pathogens that are currently widespread but at low incidence levels. The relationship between survival and development of the parasites’ free-living stages, over-winter larval survival and behavioural characteristics of the host are pivotal determinants of outbreak intensity.
Data Accessibility. There are no archived data to accompany this paper as the work is based on a mechanistic,
process-based model, using data extracted from previously published papers for model parametrization.
Authors’ Contributions. N.F., G.M., P.W., R.D. and M.H. contributed to conception and design. N.F., G.M. and R.D. were
involved in model development. N.F., G.M., R.D. and M.H. were involved in the analysis and interpretation of model outputs. N.F., G.M., P.W., R.D. and M.H. were involved in drafting the article and its critical revision. All authors gave final approval for publication.
Competing Interests. We declare we have no competing interests.
Funding. SRUC and BioSS receive funding from the Scottish Government.
References
1. Kenyon F, Sargison ND, Skuce PJ, Jackson F. 2009 Sheep helminth parasitic disease in south eastern Scotland arising as a possible consequence of climate change.Vet. Parasitol.63, 293–297. (doi:10.1016/j.vetpar.2009.03.027)
2. Mitchell GBB, Somerville DK. 2005 Efects of climate change on helminth diseases in Scotland.SAC Publ. 1, 1–11.
3. Pritchard GC, Forbes AB, Williams DJL, Salimi-Bejestani MR, Daniel RG. 2005 Emergence of fasciolosis in cattle in East Anglia.Vet Rec.157, 578–582. (doi:10.1136/vr.157.19.578)
4. Van Dijk J, David GP, Baird G, Morgan ER. 2008 Back to the future: developing hypotheses on the efects of climate change on ovine parasitic gastroenteritis from historical data.Vet. Parasitol.158, 3–84. (doi:10.1016/j.vetpar.2008.08.006) 5. Van Dijk J, Sargison ND, Kenyon F, Skuce PJ. 2010
Climate change and infectious disease: helminthological challenges to farmed ruminants in temperate regions.Animal4, 377–392. (doi:10.1017/S1751731109990991)
6. Burgess CGS, Bartley Y, Redman E, Skuce PJ, Nath M, Whitelaw F, Tait A, Gilleard JS, Jackson F. 2012 A survey of the trichostrongylid nematode species present on UK sheep farms and associated anthelmintic control practices.Vet. Parasitol. 189, 299–307. (doi:10.1016/j.vetpar.2012. 04.009)
7. O’Connor LJ, Walkden-brown SW, Kahn LP. 2006 Ecology of the free-living stages of major trichostrongylid parasites of sheep.Vet. Parasitol. 142, 1–15. (doi:10.1016/j.vetpar.2006.08.035) 8. Bartley DJ, Jackson E, Johnston K, Coop RL, Mitchell
GB, Sales J, Jackson F. 2003 A survey of anthelmintic resistant nematode parasites in Scottish sheep locks.Vet. Parasitol.117, 61–71. (doi:10.1016/j. vetpar.2003.07.023)
9. Bisset SA. 1994 Helminth parasites of economic importance in cattle in New Zealand.New Zeal. J. Zool.21, 9–22. (doi:10.1080/03014223.1994. 9517972)
10. Mckellar QA. 1993 Interactions ofOstertagiaspecies with their bovine and ovine hosts.Int. J. Parasitol. 23, 451–462. (doi:10.1016/0020-7519(93)90033-U)
11. Kao RR, Leathwick DM, Roberts MG, Sutherland IA. 2000 Nematode parasites of sheep: a survey of epidemiological parameters and their application in a simple model.Parasitology121, 85–103. (doi:10. 1017/S0031182099006095)
12. Fiel CA, Fernández AS, Rodríguez EM, Fusé LA, Stefan PE. 2012 Observations on the free-living stages of cattle gastrointestinal nematodes.Vet. Parasitol.187, 217–226. (doi:10.1016/j.vetpar.2012. 01.011)
13. Pandey VS. 1972 Efect of temperature on development of the free-living stages ofOstertagia ostertagi.J. Parasitol.58, 1037–1041. (doi:10.2307/ 3278128)
14. Waller PJ, Thomas RJ. 1978 Nematode parasitism in sheep in north-east England: the epidemiology of Ostertagiaspecies.Int. J. Parasitol.4, 275–283. (doi:10.1016/0020-7519(78)90091-7) 15. Mas-Coma S, Valero MA, Bargues MD. 2008 Efects
of climate change on animal and zoonotic helminthiases.Rev. Sci. Tech. Int. Des. Epizoot.27, 443–452.
16. Fox NJ, Marion G, Davidson RS, White PCL, Hutchings MR. 2012 Livestock helminths in a changing climate: approaches and restrictions to meaningful predictions.Animals2, 93–107. (doi:10.3390/ani2010093)
17. Roberts MG, Grenfell BT. 1991 The population dynamics of nematode infections of ruminants: periodic perturbations as a model for management. IMA J. Math. Appl. Med. Biol.8, 83–93. (doi:10.1093/ imammb/8.2.83)
18. Roberts MG, Grenfell BT. 1992 The population dynamics of nematode infections of ruminants: the efect of seasonally in the free-living stages.IMA J. Math. Appl. Med. Biol.9, 29–41. (doi:10.1093/ imammb/9.1.29)
19. Marion G, Renshaw E, Gibson G. 1998 Stochastic efects in a model of nematode infection in ruminants.IMA J. Math. Appl. Med. Biol.15, 97–116. (doi:10.1093/imammb/15.2.97)
20. Hutchings MR, Gordon IJ, Kyriazakis I, Jackson F. 2001 Sheep avoidance of faeces-contaminated patches leads to a trade-of between intake rate of forage and parasitism in subsequent foraging
decisions.Anim. Behav.62, 55–64. (doi:10.1006/ anbe.2001.1837)
21. Hutchings MR, Kyriazakis I, Anderson DH, Gordon IJ, Coop RL. 1998 Behavioural strategies used by parasitized and non-parasitized sheep to avoid ingestion of gastro-intestinal nematodes associated with faeces.Anim. Sci.67, 97–106. (doi:10.1017/ S1357729800009838)
22. Smith LA, Marion G, Swain DL, White PCL, Hutchings MR. 2009 The efect of grazing management on livestock exposure to parasites via the faecal-oral route.Prev. Vet. Med.91, 95–106. (doi:10.1016/j.prevetmed.2009.05.026) 23. Hutchings MR, Kyriazakis I, Papachristou TG, Gordon
IJ. 2000 The herbivores’ dilemma: trade-ofs between nutrition and parasitism in foraging decisions.Oecologia124, 242–251. (doi:10.1007/ s004420000367)
24. Hutchings MR, Milner JM, Gordon IJ, Kyriazakis I, Gordon J, Jackson F. 2002 Grazing decisions of Soay sheep,Ovis aries, on St Kilda : a consequence of parasite distribution?Oikos96, 235–244. (doi:10.1034/j.1600-0706.2002.960205.x) 25. Marion G, Swain DL, Hutchings MR. 2005
Understanding foraging behaviour in spatially heterogeneous environments.J. Theor. Biol.232, 127–142. (doi:10.1016/j.jtbi.2004.08.005) 26. Swain DL, Hutchings MR, Marion G. 2007 Using a
spatially explicit model to understand the impact of search rate and search distance on spatial heterogeneity within an herbivore grazing system. Ecol. Model.203, 319–326. (doi:10.1016/j. ecolmodel.2006.11.031)
27. Smith LA, Marion G, Swain DL, White PCL, Hutchings MR. 2009 Inter- and intra-speciic exposure to parasites and pathogens via the faecal–oral route: a consequence of behaviour in a patchy environment.Epidemiol. Infect. 137, 630–643. (doi:10.1017/S0950268808 001313)
14
rsos
.ro
yalsociet
ypublishing
.or
g
R.
Soc
.open
sc
i.
2
:1
40
29
6
...29. Fox NJ, Marion G, Davidson RS, White PCL, Hutchings MR. 2013 Modelling parasite transmission in a grazing system : the importance of host behaviour and immunity.PLoS ONE8, e77996. (doi:10.1371/journal.pone.0077996) 30. Gillespie DT. 1977 Exact stochastic simulation of
coupled chemical reactions.J. Phys. Chem.81, 2340–2361. (doi:10.1021/j100540a008) 31. Pandey VS, Chaer A, Dakkak A. 1993 Efect of
temperature and relative humidity on survival of eggs and infective larvae ofOstertagia circumcincta. Vet. Parasitol.49, 219–227. ( doi:10.1016/0304-4017(93)90121-3)
32. Leathwick DM, Barlow ND, Vlassof A. 1992 A model for nematodiasis in New Zealand lambs.Int. J. Parasitol.22, 789–799. (doi:10.1016/0020-7519 (92)90129-9)
33. Smith G, Grenfell BT, Anderson RM. 1986 The development and mortality of the non-infective free-living stages ofOstertagia ostertagiin the ield and in laboratory culture.Parasitology92, 471–482. (doi:10.1017/S0031182000064222)
34. Chaparro MAE, Canziani GA. 2010 A discrete model for estimating the development time from egg to infecting larva ofOstertagia ostertagiparametrized using a fuzzy rule-based system.Ecol. Model. 221, 2582–2589. (doi:10.1016/j.ecolmodel.2010. 07.007)
35. Le Jambre LF, Whitlock JH. 1973 Optimum temperature for egg development of phenotypes in Haemonchus contortus cayugensis as determined by Arrhenius diagrams and Sacher’s entropy function. Int. J. Parasitol.3, 299–310. (doi:10.1016/0020-7519 (73)90107-0)
36. UKCP09. 2009 UK climate projections. See
http://ukclimateprojections.defra.gov.uk. 37. Grenfell BT, Dobson AP. 1995Ecology of infectious
diseases of natural populations. Princeton, NJ: Publications of the Newton Institute. 38. Black JL, Kenney PA. 1984 Factors afecting diet
selection by sheep 2: height and density of pasture. Aust. J. Agric. Res.35, 565–578. (doi:10.1071/ AR9840565)
39. Arnold GW. 1987 Inluence of the biomass, botanical composition and sward height of annual pastures on foraging behaviour by sheep.J. Appl. Ecol.24, 759–772. (doi:10.2307/2403979)
40. Boag B, Topham PB, Webster R. 1989 Spatial distribution on pasture of infective larvae of the gastro-intestinal nematode parasites of sheep. Int. J. Parasitol.19, 681–685. ( doi:10.1016/0020-7519(89)90047-7)
41. Johnson IR, Thornley JHM. 1984 A model of instantaneous and daily canopy photosynthesis. Theor. Biol.107, 531–545. ( doi:10.1016/S0022-5193(84)80131-9)
42. Phillips CJC. 1993Cattle behaviour. Ipswich, UK: Farming Press Books.
43. Carrere P, Louaurt F, De Faccio Carvalho PC, Lafarge M, Soussana JF. 2001 How does the vertical and horizontal structure of a perennial ryegrass and white clover sward inluence grazing?Grass Forage Sci.56, 118–130. (doi:10.1046/j.1365-2494.2001. 00257.x)
44. Smith LA, White PCL, Marion G, Hutchings MR. 2008 Livestock grazing behavior and inter- versus intraspeciic disease risk via the fecal–oral route. Behav. Ecol.20, 426–432. (doi:10.1093/beheco/ arn143)
45. Haynes RJ, Williams PH. 1993 Nutrient cycling and soil fertility in the grazed pasture ecosystem.Adv. Agron.49, 119–199. (doi:10.1016/S0065-2113 (08)60794-4)
46. Keeling MJ, Rohani P. 2008Modelling infectious diseases in humans and animals. Princeton, NJ: Princeton University Press.
47. Smith LA, Wells KL, Marion G, Swain DL, Hutchings MR. 2011 Efects of group composition on the grazing behaviour of herbivores.Anim. Behav.80, 527–534. (doi:10.1016/j.anbehav.2010.06.016) 48. Hutchings MR, Gordon IJ, Kyriazakis I, Robertson E,
Jackson F. 2002 Grazing in heterogeneous environments: infra- and supra-parasite distributions determine herbivore grazing decisions.Oecologia132, 453–460. (doi:10.1007/ s00442-002-0971-z)
49. Lazo A, Soriguer RC. 1993 Size-biased foraging behaviour in feral cattle.Appl. Anim. Behav. Sci. 36, 99–110. (doi:10.1016/0168-1591(93) 90002-7)
50. Hutchings MR, Kyriazakis I, Gordon IJ, Jackson F. 1999 Trade-ofs between nutrient intake and faecal avoidance in herbivore foraging decisions: the efect of animal parasitic status, level of feeding motivation and sward nitrogen content.J. Anim. Ecol.68, 310–323. (doi:10.1046/j.1365-2656. 1999.00287.x)
51. Hilderson H, Vercruysse J, de Graaf DC, Bastiaensen P, Fransen J, Berghen P. 1993 The presence of an early L4 larvae population in relation to the immune response of calves againstOstertagia ostertagi.Vet. Parasitol.4, 255–266. (doi:10.1016/ 0304-4017(93)90027-K)
52. Smith G, Grenfell BT. 1985 The population biology of Ostertagia ostertagi.Parasitol. Today1, 76–81. (doi:10.1016/0169-4758(85)90047-X) 53. Williams JC, Knox JW, Loyacano AF. 1993
Epidemiology ofOstertagia ostertagiin weaner-yearling cattle.Vet. Parasitol.46, 313–324. (doi:10.1016/0304-4017(93)90069-Y) 54. Claerebout E, Vercruysse J, Dorny P, Demeulenaere
D, Dereu A. 1998 The efect of diferent infection levels on acquired resistance to gastrointestinal nematodes in artiicially infected cattle.Vet. Parasitol.75, 153–167. ( doi:10.1016/S0304-4017(97)00218-5)
55. Krecek RC, Groeneveld HT, Maritz JI. 1992 A preliminary study of the efect of microclimate on third-stage larvae ofHaemonchus contortusand Haemonchus placeion irrigated pasture.Int. J. Parasitol.22, 747–752. (doi:10.1016/0020-7519 (92)90123-3)