This is a repository copy of
Vascular autorescaling of fMRI (VasA fMRI) improves
sensitivity of population studies : A pilot study
.
White Rose Research Online URL for this paper:
http://eprints.whiterose.ac.uk/126988/
Article:
Kazan, Samira M., Mohammadi, Siawoosh, Callaghan, Martina F. et al. (6 more authors)
(2015) Vascular autorescaling of fMRI (VasA fMRI) improves sensitivity of population
studies : A pilot study. Neuroimage. pp. 794-805. ISSN 1053-8119
https://doi.org/10.1016/j.neuroimage.2015.09.033
[email protected]
https://eprints.whiterose.ac.uk/
Reuse
Items deposited in White Rose Research Online are protected by copyright, with all rights reserved unless
indicated otherwise. They may be downloaded and/or printed for private study, or other acts as permitted by
national copyright laws. The publisher or other rights holders may allow further reproduction and re-use of
the full text version. This is indicated by the licence information on the White Rose Research Online record
for the item.
Takedown
If you consider content in White Rose Research Online to be in breach of UK law, please notify us by
Vascular autorescaling of fMRI (VasA fMRI) improves sensitivity of
population studies: A pilot study
Samira M. Kazan
a,⁎
, Siawoosh Mohammadi
a, Martina F. Callaghan
a, Guillaume Flandin
a, Laurentius Huber
b,
Robert Leech
c, Aneurin Kennerley
d, Christian Windischberger
e, Nikolaus Weiskopf
a,fa
Wellcome Trust Centre for Neuroimaging, UCL Institute of Neurology, University College London, London WC1N 3BG, United Kingdom
b
NMR-Unit, Max Planck Institute for Human Cognition and Brain Sciences, Leipzig, Germany
c
Cognitive, Clinical and Computational Neuroimaging Lab, Imperial College, Hammersmith Hospital, University of London, London W12 0NN, United Kingdom
d
Department of Psychology, University of Sheffield, Western Bank, Sheffield S10 2TN, United Kingdom
eMR Centre of Excellence, Centre for Medical Physics and Biomedical Engineering, Medical University of Vienna, Waehringer Guertel 18-20, Vienna A-1090, Austria f
Department of Neurophysics, Max Planck Institute for Human Cognitive and Brain Sciences, Leipzig, Germany
a b s t r a c t
a r t i c l e
i n f o
Article history: Received 9 April 2015 Accepted 17 September 2015 Available online 28 September 2015
Keywords: BOLD fMRI Group analysis
Vascularization differences Autorescaling
ALFF
The blood oxygenation level-dependent (BOLD) signal is widely used for functional magnetic resonance imaging (fMRI) of brain function in health and disease. The statistical power of fMRI group studies is significantly hampered by high inter-subject variance due to differences in baseline vascular physiology. Several methods have been pro-posed to account for physiological vascularization differences between subjects and hence improve the sensitivity in group studies. However, these methods require the acquisition of additional reference scans (such as a full rest-ing-state fMRI session or ASL-based calibrated BOLD). We present a vascular autorescaling (VasA) method, which does not require any additional reference scans. VasA is based on the observation that slow oscillations (b0.1 Hz) in arterial blood CO2levels occur naturally due to changes in respiration patterns. These oscillations yield fMRI signal
changes whose amplitudes reflect the blood oxygenation levels and underlying local vascularization and vascular responsivity. VasA estimates proxies of the amplitude of these CO2-driven oscillations directly from the residuals
of task-related fMRI data without the need for reference scans. The estimates are used to scale the amplitude of task-related fMRI responses, to account for vascular differences. The VasA maps compared well to cerebrovascular reactivity (CVR) maps and cerebral blood volume maps based on vascular space occupancy (VASO) measurements in four volunteers, speaking to the physiological vascular basis of VasA. VasA was validated in a wide variety of tasks in 138 volunteers. VasA increasedt-scores by up to 30% in specific brain areas such as the visual cortex. The number of activated voxels was increased by up to 200% in brain areas such as the orbital frontal cortex while still controlling the nominal false-positive rate. VasA fMRI outperformed previously proposed rescaling approaches based on rest-ing-state fMRI data and can be readily applied to any task-related fMRI data set, even retrospectively.
© 2015 The Authors. Published by Elsevier Inc. This is an open access article under the CC BY license (http://creativecommons.org/licenses/by/4.0/).
Introduction
Functional magnetic resonance imaging (fMRI) is a non-invasive brain imaging technique that offers high spatial and temporal resolu-tion. As such, it enables studies of brain function segregation and inte-gration in large groups and allows for inferences about cognitive function at the population level.
The great majority of fMRI studies are based on the blood oxygena-tion level-dependent (BOLD) effect. The measured BOLD response indi-rectly reflects the underlying neuronal activity (Logothetis, 2008). It depends on a complex interaction between changes in cerebral blood
flow (CBF), blood volume (CBV), and blood oxygenation (Buxton et
al., 2004) that are coupled to neuronal activity (Villringer and Dirnagl,
1995; Logothetis and Wandell, 2004; Lauritzen, 2005). The baseline of
these different physiological parameters varies across different individ-uals and across different brain regions. Such variations affect the BOLD response amplitude and cerebrovascular reactivity (CVR) (Ainslie and
Duffin, 2009). Thus, the variations increase the inter-individual
variabil-ity beyond differences in neuronal processing and consequently reduce the statistical power of fMRI group studies (D'Esposito et al., 1999;
Huettel and McCarthy, 2001).
The low sensitivity of fMRI group studies and concomitant high false-negative rate (Type II error) is recognized as a central issue
(Lieberman and Cunningham, 2009) since it obscures small effects as
frequently encountered in cognitive and emotion processing. Attempts to increase the sensitivity have included improving the signal-to-noise ratio (SNR) of fMRI by, e.g., improved radio-frequency (RF) receive
⁎ Corresponding author. Fax: +44 20 78131420. E-mail address:[email protected](S.M. Kazan).
http://dx.doi.org/10.1016/j.neuroimage.2015.09.033
1053-8119/© 2015 The Authors. Published by Elsevier Inc. This is an open access article under the CC BY license (http://creativecommons.org/licenses/by/4.0/).
Contents lists available atScienceDirect
NeuroImage
coils (Wiggins et al., 2006) or increased static magneticfields (Yang et
al., 1999; Fera et al., 2004). Post-processing techniques have also been
used to reduce the impact of physiological noise (Hutton et al., 2011), which becomes more important with higher image SNR (Triantafyllou
et al., 2005; Hutton et al., 2011). All approaches effectively increased
the BOLD sensitivity in the individual, but the increased functional sen-sitivity at the single subject level only partly translated into an increased statistical power in group analyses. For example, increasing thefield strength from 1.5 T to 3 T improved the functional sensitivity by only up to 30% in group analyses as quantified by t-value increases (Kruger
et al., 2001; Krasnow et al., 2003; Garcia-Eulate et al., 2011), which is
much less than the improvements of ~100% observed in single subject analyses (e.g., 1.5 T vs. 4 T in (Gati et al., 1997)). Although increasing the number of RF receive coils and channels from 12 to 32 increased the sensitivity in single subject analyses by about 25% (Kaza et al., 2011), again only small and equivocal differences were found in group analyses (Kaza et al., 2011).
The disappointingly small increases in functional sensitivity in group studies, despite the significant increases in sensitivity at the individual subject level, is related to inter-individual biological variance rather than noise in the data acquisition. Differences in structural anatomy and functional organization across individuals are also important sources of variation (Mueller et al., 2013), even when state of the art inter-subject registration methods or spatial normalization methods are used (Ashburner and Friston, 2011). This study addresses the inter-individual differences in vascularization, which is one major source of inter-individual biological variance. In particular, the ampli-tude of the BOLD response varies significantly across the population, i.e., the same level of neuronal activity can generate different BOLD sig-nal amplitudes in different individuals. Previous approaches mapped and calibrated for these vascular response differences using separate reference scans based on CBF measurements, hypercapnia experiments, or resting-state fMRI experiments (rsfMRI) (Bandettini and Wong,
1997; Kannurpatti and Biswal, 2008; Kalcher et al., 2013).
All calibration methods address the complication that the BOLD fMRI signal is a measure of the hemodynamic activity in the brain and serves as an indirect indicator of the neural processes, which are the primary focus of most functional studies. It is therefore necessary to account for the hemodynamic responsivity to reveal the underlying neural inter-actions and make inferences. One established method to untangle these interactions is calibrated BOLD (Davis et al., 1998). The Davis model rep-resents the foundation of these calibration methods where the BOLD signal is represented by a non-linear interaction between the fractional changes in CBF and cerebral metabolic rate of oxygen (CMRO2)
multi-plied by a vascularization parameterM(Davis et al., 1998). The
param-eterM(seeMaterials and Methods, Theory), is multiplicative and hence
can be used to calibrate a voxel's BOLD signal. Because neuronal-driven BOLD signal changes are influenced by the same vascular mechanisms as CO2-driven changes (Bandettini and Wong, 1997; Davis et al.,
1998; Cohen et al., 2004), theMparameter can be estimated by
manipulating CO2levels. However, this requires additional scans for
manipulating CO2 levels, often involving respiratory challenges
(e.g., Hypercapnia—increased fractional inspired carbon dioxide, FiCO2), which are impractical in many situations. They can be
particular-ly stressful for patients or impossible in some disease conditions. We propose a vascular autorescaling (VasA) method that maximizes the functional sensitivity in population studies without the need for any additional reference scans. VasA fMRI is based on the concept that changes in breathing patterns induce slow (b0.1 Hz) variations in arte-rial blood CO2levels (Van den Aardweg and Karemaker, 2002; Wise et
al., 2004; Chang and Glover, 2009). The variations in blood CO2levels
cause significant changes in the amplitude of the BOLD signal.Wise et
al. (2004)showed that the resting-statefluctuation amplitude (RSFA)
%BOLD oscillations of around 0.2%, while for 5% CO2%BOLD signal
changes are around 2–3% (Yezhuvath et al., 2009; Donahue et al., 2014) and similarly for breath-hold paradigms (Murphy et al., 2011)
at 3 T. The innovation of VasA lies in the realization that this vasculari-zation map may be derived from the residuals of the task-related fMRI (tfMRI) data after removing task-related variance and slow drifts.
Previously, the power estimates of the CO2-driven low-frequency
fluctuations (0.01–0.08 Hz) were extracted from rsfMRI reference scans as a vascular marker by (Di et al., 2013; Kalcher et al., 2013)—named Amplitude of low-frequencyfluctuations (ALFF) or (con-ceptually identical) RSFA. These estimates were then used to scale the amplitude of tfMRI data in the same individual (Kannurpatti and
Biswal, 2008; Kannurpatti et al., 2012; Tsvetanov et al., 2015). The
pro-posed VasA method extracts similar ALFF maps directly from the tfMRI data and thus makes additional reference scans unnecessary and, im-portantly, can be applied to any data set, even retrospectively. We note that the calculation of ALFF was originally introduced byZang et
al. (2007)studying baseline activity in ADHD but is used here and in
the previous studies as a vascular marker (Di et al., 2013; Kalcher et
al., 2013; Tsvetanov et al., 2015).
We apply the VasA fMRI analysis technique to a variety of large fMRI data sets including different tasks and acquisition protocols (Price et al.,
2010; Barch et al., 2013; Glasser et al., 2013; Larson-Prior et al., 2013).
We demonstrate that it increases sensitivity at the group level as reflected in an increase of activated voxels by up to 42% for specific tasks and an increase of localt-scores of more than 30%, while retaining full control of false positives (Type I error). Comparisons of VasA maps to CVR and CBV maps suggest that VasA captured the intra- and inter-individual vascularization differences in BOLD fMRI.
Materials and methods
Theory
The BOLD fMRI signal depends on the complex coupling between neuronal activity, changes in cerebral bloodflow, blood volume, and ox-ygenation in the activated brain regions (Buxton et al., 2004). Changes in BOLD signal amplitude can be directly related to variations in CBF, CBV, and CMRO2or combinations of these (Davis et al., 1998). The
rela-tionship between these parameters can be expressed analytically using the Davis model (Davis et al., 1998). If we define the BOLD fMRI signal change with activation (ΔSact) as the difference between the resting
state (Srest) and activated state (Sact), which is then normalized to
rest-ing state (Srest) (Davis et al., 1998; Buxton et al., 2004), the Davis model
predicts the following:
ΔSact
Srest ≈
M 1− CB Fact
CB Frest
α−β
CMRO2act
CMRO2rest
β
" #
ð1Þ
whereais the Grubb's law exponent (Grubb et al., 1974) andβis a mag-neticfield-dependent parameter.Mis a combined vascularization pa-rameter that describes the variations that occur among different brain regions and across different time points and individuals.Mcan be theo-retically derived:
M¼kTEVrestðErestB0Þβ ð2Þ
wherekis a proportionality constant, TE is the echo time,Vrestis the
baseline blood volume,Erestis the baseline oxygen extraction fraction,
andB0is the magneticfield strength.
The parameterMdepends mainly on the baseline deoxyhemoglobin blood content, and thus it varies within subjects over time and within different brain regions and between subjects (Davis et al., 1998).
Mcan be directly estimated from hypercapnia calibration experi-ments, if it is assumed that changes are purely CO2 driven (i.e.,
CMRO2act=CMRO2rest) without changes in neuronal activity as
Handwerker et al., 2007; Wise et al., 2013). Then Eq.(1)reduces to
ΔSCO2
Srest ≈
M 1− CB FCB FCO2
rest
α−β
" #
ð3Þ
with ΔSCO2 being the CO2-related signal change. A previous study
(Kannurpatti and Biswal, 2008) has shown that the RSFA, estimated
from rsfMRI data and conceptually identical to ALFF, is proportional to
Mand can be used as an alternative to hypercapnic experiments to de-termineΔSCO2.
Since RSFA and the task-related BOLD signal change are influenced by the same vascular physiology,M(Bandettini and Wong, 1997;
Davis et al., 1998; Cohen et al., 2004; Kannurpatti and Biswal, 2008), a
calibrated BOLD response amplitudeΔScalcan be derived that is
inde-pendent of inter-individual variations inMby dividing the tfMRI re-sponse amplitudesΔSactby RSFAΔSCO2(i.e., Eq.1divided by Eq.3):
ΔScal¼
ΔSact
ΔSCO2
¼
1− CB Fact CB Frest α−β
CMRO2act CMRO2rest
β
1− CB FCB FCO2rest
α−β
ð4Þ
In most tfMRI experiments, it is not a single response amplitude ΔSactthat is estimated but rather multiple response amplitudes for
dif-ferent tasks or task components using a general linear model (GLM). Multiple task components are modeled with a set of regressors and re-sult in the same number of estimated regression coefficients. Effects of interest are often summarized using contrasts, which are formed from a linear combination of the regression coefficients of the GLM. Contrasts can also be calibrated by dividing byΔSCO2as shown in Eq.4since they
are linearly related to the single responses. Assuming that the CO2
-relat-ed signal changeΔSCO2and experimental effects (e.g., task responses)
are additive,ΔSCO2 can be directly estimated from the tfMRI data as
the residuals of the GLM describing the experimental variance (i.e., the difference between the data and model prediction; see“ExtractingΔ
SCO2from the tfMRI data”).
Methods
fMRI experiments
Data sets for validation of VasA fMRI.Since specialized data are not
re-quired by the proposed VasA fMRI approach, we used existing data from two different databases to assess its performance (the HCP and the PLORAS databases). The HCP data set (Barch et al., 2013; Glasser et
al., 2013) included two sets of rsfMRI data (1200 frames per run; run
duration 14 min 33 s) acquired on two separate days and tfMRI data sets for each participant (n= 80; age range: 22–35 years old; 58 are fe-male, 19 are fe-male, and 3 are not reported). Details about the tfMRI data sets used are provided inTable 1. Whole-brain multi-band single-shot echo planar imaging (EPI) acquisitions were acquired with a 32-channel RF receive head coil on a 3-T Siemens Skyra scanner with an enhanced gradient system. Imaging parameters were as follows: repetition time (TR) = 720 ms, echo time (TE) = 33.1 ms,flip angle = 52°, in-plane
field of view (FOV) = 208 × 180 mm, 72 slices, 2 mm isotropic voxels, with a multi-band acceleration factor of 8. All HCP tasks and acquisition protocols are detailed in (Barch et al., 2013). Pre-processed HCP data were used (as described byGlasser et al., 2013; Parker Jones et al., 2014), ranging from 176 to 405 image volumes per time series depend-ing on the task. The tfMRI data sets were acquired on two consecutive days at approximately 1:30 pm each day within approximately 30 min. The PLORAS data set (Price et al., 2010) included tfMRI data (n= 58; 32 females, 26 males age range: 20–75; mean age 44). A two-dimen-sional single-shot EPI sequence was used with 3 × 3 mm in-plane reso-lution (TR/TE/flip angle = 3080 ms/30 ms/90°, FOV = 192 mm, matrix size = 64 × 64, 44 slices, slice thickness = 2 mm, inter-slice gap = 1 mm, 62 image volumes per time series). The PLORAS data were pre-processed using SPM12 (as described in (Hope et al., 2014)).
Rescaling of fMRI experiments.The HCP data sets were analyzed in three
[image:4.595.35.554.494.708.2]different ways: standard group statistics, rescaling using a rsfMRI refer-ence data set, and the VasA fMRI approach. Since the PLORAS data sets did not include rsfMRI, they were only analyzed using standard statistics and VasA fMRI.
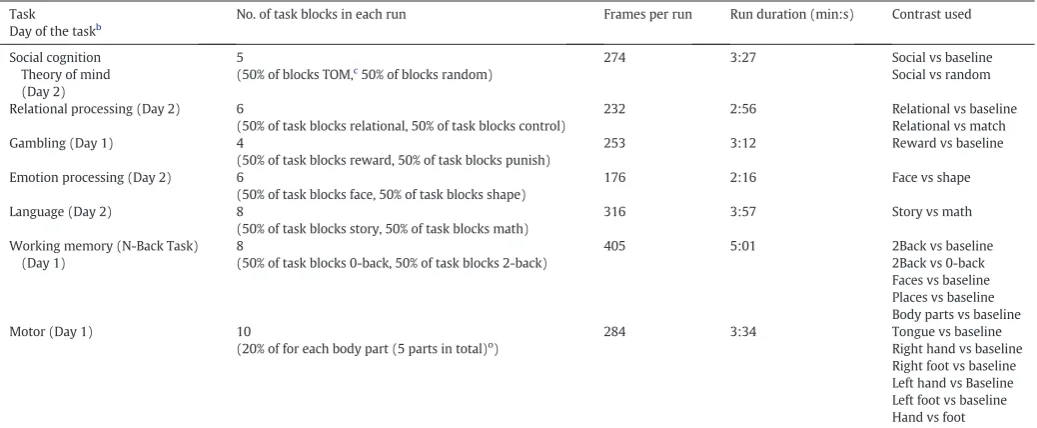
Table 1
tfMRI HCP data (Barch et al., 2013).a
Task Day of the taskb
No. of task blocks in each run Frames per run Run duration (min:s) Contrast used
Social cognition Theory of mind (Day 2)
5
(50% of blocks TOM,c
50% of blocks random)
274 3:27 Social vs baseline Social vs random
Relational processing (Day 2) 6
(50% of task blocks relational, 50% of task blocks control)
232 2:56 Relational vs baseline Relational vs match Gambling (Day 1) 4
(50% of task blocks reward, 50% of task blocks punish)
253 3:12 Reward vs baseline
Emotion processing (Day 2) 6
(50% of task blocks face, 50% of task blocks shape)
176 2:16 Face vs shape
Language (Day 2) 8
(50% of task blocks story, 50% of task blocks math)
316 3:57 Story vs math
Working memory (N-Back Task) (Day 1)
8
(50% of task blocks 0-back, 50% of task blocks 2-back)
405 5:01 2Back vs baseline 2Back vs 0-back Faces vs baseline Places vs baseline Body parts vs baseline Motor (Day 1) 10
(20% of for each body part (5 parts in total)o)
284 3:34 Tongue vs baseline Right hand vs baseline Right foot vs baseline Left hand vs Baseline Left foot vs baseline Hand vs foot
obody parts included: Right hand, left hand, right foot, left foot, tongue. a
Adapted fromBarch et al. (2013).
b
Tasks were carried out in two consecutive days (Day 1 and Day 2)
c
tfMRI data analysis for task-related activation maps.For the tfMRI data, we analyzed all available pre-processed data sets provided by the HCP
(Glasser et al., 2013; Larson-Prior et al., 2013) and PLORAS (Price et
al., 2010) studies using Statistical Parametric Mapping (SPM12;
Wellcome Trust Centre for Neuroimaging, UCL, London, UK), imple-mented in MATLAB 7.14. Statistical analyses of the functional images were performed in two steps. Each subject's pre-processed tfMRI time series (unsmoothed data) underwent afixed effects analysis,fitting the GLM at each voxel. Each event was convolved with a canonical he-modynamic response function. The data were high-passfiltered with a cutoff period of 128 s and were also corrected for serial autocorrelations using an autoregressive model. The contrasts of interest at the single-subject (first) level for each task were chosen as in (Barch et al., 2013) for the HCP data (Fig. 4). The contrasts of interest for the PLORAS data are presented inFig. 4(Hope et al., 2014).
ExtractingΔSCO2from the rsfMRI reference data.ALFF maps were
comput-ed for each subject using linearly detrendcomput-ed resting-state data (available only for HCP data sets). The ALFF map of the low-frequency power with-in the frequency band from 0.01 to 0.08 Hz was then estimated with-in each voxel for each subject and smoothed using an isotropic Gaussian smoothing kernel with 4 mm FWHM.
ExtractingΔSCO2from the tfMRI data using VasA.For tfMRI data (HCP and
PLORAS), we used the residuals, i.e., the differences between the spatial-ly unsmoothed tfMRI time series data and the GLM prediction. VasA low-frequencyfluctuation maps were estimated from the residuals (after they were linearly detrended) in an analogous way to ALFF esti-mation (Zang et al., 2007). The time series for each voxel of the residuals map was Fourier transformed and the power spectrum was obtained. The averaged square root of the power within the frequency band of 0.01–0.08 Hz was then calculated at each voxel. The resulting low-fre-quencyfluctuation maps were smoothed with an isotropic Gaussian kernel with 4 mm FWHM.
Rescaling the BOLD response and analysis of contrasts.For each individual,
a contrast image describing the activation in each task (Fig. 4) was cre-ated. The contrast image was then smoothed using an isotropic Gauss-ian kernel with 4 mm FWHM and was either not calibrated (standard approach) or calibrated, i.e., the voxel-wise contrast estimate was divid-ed byΔSCO2, i.e., the respective ALFF or VasA residual estimates. The
standard or rescaled contrasts were then entered into a second-level analysis (i.e., uniform effect analysis using a summary statistic ap-proach) to enable inferences at the group level.T-statistics were esti-mated for each contrast at the group level and thresholded atpb0.05 (with family-wise error (FWE) correction for multiple comparisons). Thet-scores (for the positive contrast) from either ALFF calibration or VasA fMRI were plotted against thet-scores from the standard analysis for all voxels that survived FWE correction withpb0.05. The percentage change int-score due to rescaling was derived from a linear regression of these scatter plots.
Determining false-positive rates of VasA-based fMRI analyses.Ten
thou-sand simulations were performed, each of them using the 80 subjects from the HCP data for an arbitrarily selected motor mapping task. For each simulation, a subject-specific random regressor was added to each design matrix at thefirst level. The random regressor was formed by convolving normally distributed noise,Ɲ(0,1), with the canonical hemodynamic response function (HRF) implemented in SPM12. The convolution with the HRF was performed to closely mimic typical BOLD responses and simulate the covariance structure of fMRI data. A contrast testing for the explanatory power of the random regressor, which should be zero, was specified for every subject and the null hy-pothesis that its population mean is zero was tested at the group level usingF-statistics withpb0.05 (FWE corrected).
Optimal frequency band for estimatingfluctuations relevant for rescaling.
VasA maps were computed using a range of different frequency bands by varying the upper limit from 0.02 to 1.2 Hz in increments of 0.01 Hz (whilstfixing the lower frequency to 0.01 Hz). Normalization of the BOLD response and the analysis of the contrasts were performed as described above in a motor task from the HCP data set (Table 1). The percentage increase in the number of activated voxels was then used as a measure of improved sensitivity for each tested frequency band.
Comparison of VasA fMRI to CBV VASO and CVR maps.In order to elucidate
the physiological underpinnings of the VasA method, VasA maps from a visual checkerboard stimulation experiment were compared to relative CBV estimates from VAscular Space Occupancy (VASO) acquisitions (ex-periment 1,n= 3 volunteers) and CVR estimates (experiment 2,n= 1 volunteer). Both experiments were performed at 7 T at the Max Planck Institute for Human Cognitive and Brain Sciences, Leipzig.
Experiment 1: CBV VASO.The applied fMRI sequence consisted of an
in-terleaved acquisition scheme of combined T1and T2* weighting
provid-ing a CBV weighted VASO contrast in addition to the BOLD signals at rest by combining a T1 preparation module with a multi-echo readout
(Huber et al., 2014). tfMRI data were acquired on a Siemens
MAGNETOM 7 T scanner (Siemens Healthcare, Erlangen, Germany) in 3 subjects (2 female, age = 22–25 years). For RF transmission and re-ception, a 24-channel receive and a circularly polarized single-channel transmit head coil (Nova Medical, Wilmington MA, USA) were used. In a 10-min long fMRI run a visual checkerboard (8Hz) stimulus (30 s rest vs. 30 s stimulation) was used to activate the visual cortex. Data were acquired infive axial slices aligned along the calcarine sulcus with a two-dimensional single-shot gradient-echo EPI readout. Due to small head motion, parts of the two outermost slices were disregarded in the analysis. The imaging parameters were TE/TI/TR = 16/1000/ 1500 ms, nominal voxel size of 2 × 2 × 2 mm3, partial Fourier factor 6/
8 in the phase encoding (PE) direction.
These data were receive-field corrected, and low-frequencyfl uctua-tion maps of the low-frequency power within the frequency band from 0.01 to 0.08 Hz were extracted from VASO data (TR = 1500 ms, 255 vol-umes) acquired at rest (normalized with respect to the mean signal to reflect %CBV changes). The VasA maps were extracted from the resid-uals after applying the GLM from BOLD checkerboard tfMRI data in the same subjects (using the exact procedure described above for the PLORAS/HCP data), and correlation tests were performed between the VasA maps and the CBV maps (n= 3). The voxel-wise correlation be-tween VasA and CBV maps was estimated across all gray matter voxels with a significance thresholdpb0.05.
Experiment 2: CVR.A single subject (female, age 31 years) was scanned
during a 12-min long hypercapnia task consisting of 2/5/5 min of breathing air/5% CO2, 21% O2,and balanced N2/air. The pre-mixed gas
composition was delivered via a non-rebreathing mouthpiece connect-ed to a three-way valve separating the inflow gas from the gas exhaled by the subject. The heart rate and the respiratory gas composition were recorded with a BIOPAC MP150 unit (BIOPAC Systems Inc, Goleta CA, USA). Inhaled and exhaled air samples were continuously taken via a smallflexible tube attached to the participant's mouthpiece and con-nected directly to the gas sensor of the O2and CO2modules of the
BIOPAC system. The BIOPAC system was calibrated before the experi-ment by adjusting the input resistances for both module sensors to the known partial pressures of two gas mixtures. For comparison with neural activity induced signal changes and testing VasA, a 10-minfl ick-ering checkerboard (8 Hz) stimulation experiment (alternating 30 s rest vs. 30 s stimulation) (same as that performed in Experiment 1) was con-ducted right after the hypercapnia experiments.
the adiabatic inversion pulse efficiency to 75% in a B1-independent way
(Huber et al., 2014).
A medical doctor was present in the magnet room at all times during the breathing manipulation and was responsible for adjusting gasflow rates and monitoring heart and breathing cycles. All procedures of the experiments with breathing manipulations were approved by the Ethics Committee of the University of Leipzig, and informed written consent was given by the participant.
The CVR data were motion corrected and CVR maps were calculated voxel by voxel in units of % signal change per mmHg end-tidal CO2
change. fMRI signal and end-tidal CO2changes were averaged over
the period of 3 min. Thefirst 2 min of breathing 5% CO2were excluded
from the analysis to minimize effects of signal transition between steady-state rest steady-state hypercapnia.
The pulse sequence used for the CVR experiment was the same as for experiment 1 but with different imaging parameters: TE/TI/TR = 19/ 765/1500 ms, nominal voxel size of 1.5 × 1.5 × 1.5 mm3, partial Fourier
factor 5/8 in the PE direction. The VasA maps were extracted from the residuals after applying the GLM to the BOLD checkerboard tfMRI data as above. Correlation tests were performed between the VasA map and the CVR map (n= 1). The voxel-wise correlation between VasA and CVR maps was estimated across all gray matter voxels with a signif-icance threshold ofpb0.05.
Results
VasA fMRI increased the functional sensitivity substantially for a range of different experiments and data acquisition schemes (Figs. 1–
4). On average ,the meant-score increase across all activated brain areas was approximately 10% but it reached up to 21% for particular ex-periments (e.g., relational processing experiment inFig. 4). VasA fMRI yielded considerably highert-scores (approximately 130% higher) than the rescaling based on rsfMRI data (Fig. 4).Fig. 1shows an example of a group-level statistical map for 80 subjects for a relational processing task from the HCP study (Barch et al., 2013) analyzed with the standard and two different rescaling approaches.Fig. 2shows another example of activations in 58 volunteers performing a speech-processing task from
the PLORAS study (Price et al., 2010). In general, the rescaling methods, particularly VasA fMRI, increased the spatial extent of activations andt -score values across the entire brain. In some areas, thet-score increases relative to the standard analysis exceeded 30%, such as in the visual cor-tex (Fig. 1c). As can be seen inFigs. 1, 2, and 4similar increases were achieved for different types of data sets, i.e., the increased sensitivity afforded by VasA fMRI was independent of task and data acquisition.
Local sensitivity increases
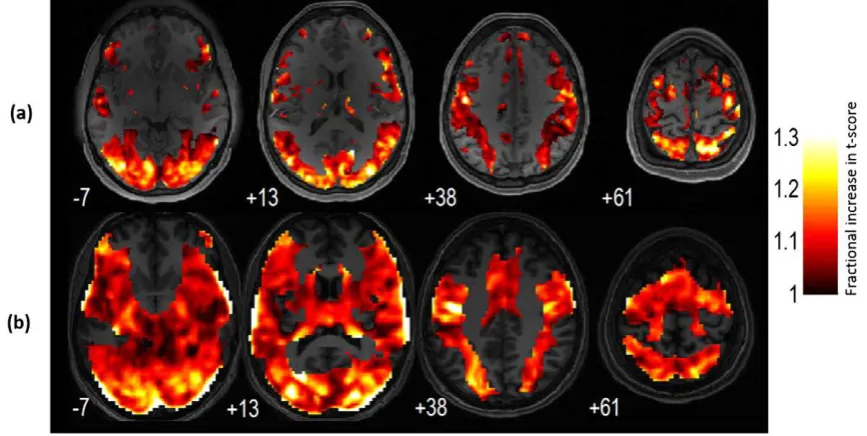
Fig. 3and movie (supplementary material) summarizes the
sensitiv-ity improvements that were achieved in different brain areas using VasA fMRI. It shows the meant-score value increases due to VasA in each voxel derived from all fMRI data from HCP (a) and PLORAS (b) data, i.e., it pools over all tasks.
Spatial correlation between the resting-state ALFF and VasA maps
There was a strong correlation between ALFF and VasA measures (Spearman's rank correlation coefficientr= 0.78 forn= 80 subjects unsmoothed).Figs. 5(a) and (b) show a single subject comparison be-tween ALFF and VasA maps.Fig. 5(c) shows a scatter density plot for a representative subject (unsmoothed maps measured in arbitrary units (a.u.)).Fig. 6shows a group comparison between ALFF (extracted from a resting-state experiment) and VasA (extracted from tfMRI HCP data, working memory task) maps (n= 80 subjects).
Control of false positives
Permutation analysis demonstrated that the rate of false-positive ac-tivations was adequately controlled by VasA fMRI. It was based on adding and testing an extra randomly generated regressor to the origi-nal tfMRI general linear model, which should not significantly explain any time series variance. Simulation testing was repeated forn= 10000 permutations and resulted in false-positive activation rates of less than the targeted 5%, i.e., 2.14% (95% confidence interval: [0.0187, 0.0244]).
[image:6.595.109.480.456.703.2]Optimal frequency band for estimatingfluctuations relevant for rescaling
The maximum sensitivity improvements were achieved by extracting the CO2-driven low-frequencyfluctuations from a frequency
band with a low cutoff at 0.01 Hz and high cutoff at 0.1 Hz. The improve-ments were stable over high cutoff frequencies ranging from 0.06 Hz to 0.1 Hz (average variation in number of activated voxels was 24%) for a randomly selected HCP motor mapping task data set (Fig. 7). When higher frequencies for the high cutoff were used (N0.1 Hz), the im-provement was substantially lower (12%), indicating that the band-passfilter used for VasA (0.01 Hz–0.08 Hz) captured the vascularization differences effectively.
Comparison of VasA maps to CBV VASO and CVR maps
There was a strong positive correlation between the VASO low-fre-quency %CBV maps and the corresponding VasA maps (Fig. 8; all
rN0.76, allpb0.05) in all three subjects. The CVR measures were
significantly correlated with the VasA measures in the single subject
(Fig. 9,r= 0.39,pb0.05).
The higher sensitivity improvement due to VasA fMRI compared to rsfMRI-based calibration was further investigated by quantifying the re-producibility of ALFF maps across different time points. The coefficient of variation (CoV) of ALFF maps was significantly smaller when they were estimated from the same experimental run as done for VasA rather than from separate experiments as in rsfMRI calibration. The CoV of ALFF maps between two different runs (acquired on two consecutive days) was 14 ± 3% and within one run was 11 ± 2%. That is, the CoV of ALFF maps was significantly reduced by 21% when it was estimated from the same experimental run as opposed to when it was estimated from two different runs (Student's pairedt-test,pb0.0001;t=−8.86).
Improved sensitivity in areas with low SNR
[image:7.595.114.498.54.240.2]VasA fMRI also improves functional sensitivity in areas which are known to have very low-functional sensitivity and suffer from signal
Fig. 2.Group-level activation maps (pb0.05, FWE) for a speech-processing task using the standard analysis (a) and VasA fMRI (b). In the speech-processing task, volunteers were instructed to say one word. The contrast reflects the difference between the speech processing (reading) relative to the baseline condition (markerfixation).
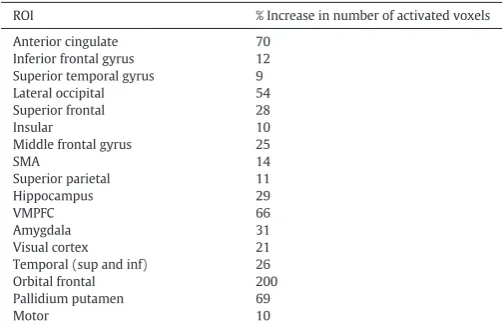
[image:7.595.86.520.492.710.2]dropout (Table 2). For example, the percentage increase in the number of activated voxels relative to the standard approach was 66% in ventral prefrontal cortex, 31% in the amygdala, 29% in hippocampus, and 200% in the orbital frontal cortex.
The improved sensitivity can be leveraged in several ways. The de-tection power of studies may be considerably increased or group sizes may be reduced while retaining the same power. At-score increase of 20% may translate into a reduction of approximately 40% in the group size while achieving the same statistical power, assuming simple Gauss-ian noise.
Discussion
Functional MRI studies aim to infer the neuronal activity from the measured BOLD response. Thus, any non-neuronal contributions or modulations of the signal reduce the sensitivity and introduce bias. We developed a principled rescaling technique, VasA fMRI that reduces inter-individual vascularization variations that modulate the BOLD sig-nal and significantly contribute to the inter-subject variance in fMRI group studies. Compared to standard analysis, VasA fMRI significantly
increases the sensitivity of group studies in terms oft-score values by up to 30% in specific brain areas without increasing the false-positive rate. For reference, a 20% increase is comparable to sensitivity improve-ments due to increasing thefield strength from 1.5 T to 4 T for group studies (Yang et al., 1999).
Relation to BOLD physiology
VasA fMRI estimates a measure of local vascularization directly from the time series data of an fMRI experiment. The residual variance after
fitting the experimental model yields an estimate of the spontaneous low-frequencyfluctuations in the BOLD signal. Thesefluctuations are hypothesized to relate tofluctuations in the arterial CO2level and
sub-ject-specific vascularization differences such as the local bloodfl ow/vol-ume (Wise et al., 2004). A principled derivation (see Theory section) shows the relationship between this vascularization measure and the established vascularization parameter (M) in the Davis model (Davis
et al., 1998), which modulates the BOLD signal multiplicatively. Thus,
[image:8.595.73.514.57.443.2]the simple scaling used in VasA fMRI can address the inter-individual differences.
0 20 40 60 80 100 120 0
20 40 60 80 100 120
ALFF (from rfMRI data), a.u.
Va
s
A
(
fr
o
m
tfM
R
I d
a
ta
),
a
.u
.
10 20 30 40 50 60
ALFF VasA
0 10 20 30 40 50
Maps (a
.u
.)
(b)
(c)
(a)
R
R
L
[image:9.595.139.468.50.485.2]L
Fig. 5.Comparison between ALFF (derived from rsfMRI data, a) and VasA maps (derived from a working memory task, b) for the same single subject; voxel-wise scatter density plot (of the data shown in panels a and b) between unsmoothed ALFF (derived from rsfMRI data) and unsmoothed VasA maps (derived from tfMRI HCP data (working memory), measured in arbitrary units (a.u.)) (c). A gray matter tissue mask was applied.
Maps (a.u.)
L
R
L
R
(a)
(b)
ALFF VasA
50
40
30
20
10
0
[image:9.595.138.466.553.726.2]Comparison with reference scan-based rescaling methods
Compared to rescaling methods using separate reference scans such as the ALFF method based on rsfMRI data (Kannurpatti and Biswal, 2008), the performance of VasA fMRI is higher (i.e., we observed consis-tently highert-score values and more activated voxels for VasA in com-parison to scaling using the rsfMRI-based ALFF measure). One important reason may be that in VasA fMRI, the rescaling is derived from the same time series as the tfMRI. Hence, it may more closely
re-flect the current physiological state during the task than rsfMRI refer-ence scans acquired in another session. We note that VasA relies on the standard time series GLM-based statistical analysis and thus differs from a recent rescaling method by (Kannurpatti and Biswal, 2008), where the noise estimates for the statistics were determined from the variations in percentage signal changes across the brain (but not a time series). The method of (Kannurpatti and Biswal, 2008) may be used for analysis of single scans and subjects, whereas VasA is tailored towards multi-subject group analyses.
Unlike other correction methods, VasA fMRI can be applied retro-spectively to all existing task fMRI experiments because it does not re-quire additional and complicated reference scans. Skipping the reference scans not only saves time but is also more comfortable for the subject. For example, in the established hypercapnia calibration ap-proach, volunteers need to breath CO2enriched air (Davis et al., 1998),
which can induce adverse breathlessness, potential sensory stimulation, and is not practical for many neurological and psychiatric conditions. As
an alternative to breathing CO2enriched air, breath-hold can be used to
induce mild hypercapnia (Kastrup et al., 1999; Thomason et al., 2005;
Handwerker et al., 2007). However, this method also induces stress in
the subject and has poor reproducibility (Chiarelli et al., 2007). More-over, all approaches assume that brain metabolism is not affected
(Kannurpatti and Biswal, 2008; Zappe et al., 2008; Mohtasib et al.,
2012), which is controversial (Mohtasib et al., 2012). Inducing hyperoxia with O2enriched air instead of hypercapnia is considered
more tolerable (Chiarelli et al., 2007) but faces similar concerns regard-ing its validity (Hoge, 2012).
Considerations
[image:10.595.305.549.53.295.2]The improvement in functional sensitivity due to VasA fMRI varies across brain areas (Fig. 3). We hypothesize that this variation may be due to different factors: (1) residual inter-individual anatomical differ-ences may have remained even after spatial normalization and affected different regions to varying degrees; (2) the different tasks tested here induce activations in different brain areas and, thus, inter-individual dif-ferences in task performance may have resulted in higher variation of neuronal and consequent BOLD responses for some areas over others;
Fig. 7.Effect of the choice of the frequency band used for determining the VasA vascular estimate. The upper cutoff of the band-passfilter was systematically varied and the im-provement due to VasA quantified as the increase in the number of activated voxels across the brain. The data were taken from different motor tasks from the HCP data set.
0.2 0.4 0.6 0.8
0 0.5 1 1.5
VAS
O
,
%
∆
V
ASO
10 20 30 40 50 60
0.2 0.4 0.6 0.8
0 0.5 1 1.5
VasA, a.u.
VA
SO
,
%
∆
VAS
O
10 20 30 40 50 60
0.2 0.4 0.6 0.8
0 0.5 1 1.5
VasA, a.u.
VA
SO
,
%
∆
VAS
O
10 20 30 40 50 60 r=0.76
r=0.85 r=0.81
Fig. 8.Correlation between low-frequency %CBVfluctuation maps extracted from the VASO data (normalized with respect to the entire frequency band to reflect CBV changes) at rest and the corresponding maps extracted from the residuals after applying the GLM from BOLD tfMRI data (checker board experiment) in the three subjects at 7 T (r= 0.85/0.81/0.76 for subjects 1–3, respectively)).
0 2 4 6 8 10
x 10-3 0
0.5 1 1.5 2 2.5 3
VasA (a.u.)
C
V
R
(
%
B
O
L
D
/∆
e
tC
O 2
mm
H
g
[image:10.595.46.276.53.237.2])
[image:10.595.70.519.580.711.2](3) task-correlated changes in breathing patterns where in some com-plex tasks, both cognitive and motor subjects may hold their breath or increase their breathing rate during the task; and (4) individuals may vary greatly in their resting CO2level, and in how this changes during
breathing and deliberate manipulations of inspired gases (Prisman et
al., 2008). This may also account for some small differences between
the results for the HCP and PLORAS data (Fig. 3a vs. b). Moreover, VasA does not capture all variance components expressed in the vascu-larization parameterM(Eq.2).
Importantly, the sensitivity improvements were found consistent across very different acquisition protocols (with e.g., repetition time TR = 0.7 s vs TR = 3 s;Fig. 3) andfield strengths. As the VasA principle was derived from fundamental BOLD signal models, it is expected that it can be applied at otherfield strengths as well.
VasA accounts for differences in the calibration parameterM, which depends on baseline blood volume and baseline oxygen extraction frac-tion (Eq.2) and differs between subjects. VasA does not fully account for baseline CBF differences since a CBF dependence remains even after autorescaling, Eq.4. Thus, it may not account for all sources of vascular variance across subjects. The inter-subject variability ofMis much higher (Table 1of (Davis et al., 1998), coefficient of variation (CoV) of
M=0.30) than the inter-subject variability in the ratio of CBF during
hypercapnia to baseline (CB FCO2
CB Frest;which has CoV of 0.06). The CoV ofM
is also much higher than the ratio of CBF during stimulation to baseline (CB Fact
CB Frest;which has CoV of 0.08) (Davis et al., 1998). Thus, we expect VasA
to account for the majority of vascular differences since it removes sen-sitivity to inter-subject variance inM.
VasA fMRI is based on the assumption that variations in CO2have no
effect on the cerebral metabolic rate. Debates concerning this hypothe-sis have been prevalent in thefield for the last 30 years (Siesjo, 1980;
Yablonskiy, 2011); with some reporting increases (Horvath et al.,
1994; Jones et al., 2005), decreases (Zappe et al., 2008; Xu et al., 2011)
and even no changes in CMRO2(McPherson et al., 1991; Hino et al.,
2000; Chen and Pike, 2010). Although this leads many to believe that
this disparity in results arises due to differences in experimental meth-odology, one relationship is clear: the level of the CMRO2changes is
re-lated to the severity of the CO2change. Direct electrophysiological
recordings from rodent brain show clear changes in baseline neuronal activity during severe 10–12% hypercapnia (Jones et al., 2005;
Kennerley et al., 2012) but negligible changes for smallerb5% CO2
var-iations (Jones et al., 2005). VasA calibration relies on minor variations in CO2caused by natural breathing changes that are expected to be
smaller than CO2 variations arising from breathing manipulation.
Therefore, one can reasonably presume variations in CMRO2are
negligi-ble under our experimental conditions.
While VasA is believed to generally well correct for inter-regional and inter-subject variations in vascular reactivity, it cannot account for all sources of physiological variability. Physiological factors that could affect VasA include vasomotion, which is a local phenomenon that re-lates to the oscillation of the vascular diameter (i.e., rhythmic change in diameter) at frequencies in the range from 1 to 20 min-1(Slaaf et
al., 1988; Mayhew et al., 1996; Aalkjaer and Nilsson, 2005). The origin
of vasomotion and its physiological consequences are still not complete-ly understood (Nilsson and Aalkjaer, 2003). Particularly, the links be-tween neural activity and vasomotion are still unclear (Sirotin and
Das, 2009) with some papers reporting that it is not related to
respira-tion, heartbeat, or neuronal input (Schechner and Braverman, 1992;
Porret et al., 1995; Aalkjaer and Nilsson, 2005). The band of frequencies
that are related to vasomotion in small arteries are believed to be be-tween 0.02 and 0.2 Hz (Aalkjaer and Nilsson, 2005) combination of har-monics and slower oscillatory envelopes. As high-passfiltering is a standard preprocessing step in the fMRI data analysis, this will remove any vasomotion-related harmonics above the typical cutoff of 0.1 Hz, significantly reducing any potential impact of vasomotion. VasA will not be able to distinguish between slow oscillations related to vasomotion or CO2fluctuations, which VasA targets. Adding to the
com-plexity, the two effects could be linked and further research is required to untangle the two. Thus, it cannot be excluded that vasomotion effects affect VasA estimates and their interpretation to a certain degree.
Changes in heart rate are another physiological factor that may affect VasA (Shmueli et al., 2007; Chang et al., 2009).Shmueli et al. (2007) re-ported that heart ratefluctuations explain 1% of resting-state BOLD sig-nal variance. This variance was not concentrated entirely around large cerebral blood vessels but also included gray matter. The authors re-ported a complex temporal relationship between heart rate and the BOLD signal; the heart rate was negatively correlated with the BOLD sig-nal amplitude at time lags ranging from 6 to 12 s, and positively corre-lated at time lags of 30–42 s. The heart ratefluctuations may therefore bias VasA estimates.
VasA fMRI relies on an accurate model of the experimental task-in-duced variance; an inaccurate or incomplete model will result in neuronal confounds. In this case, the VasA estimates may be inaccurate and lead to suppression of real activation. If the model is inadequate or incomplete, the vascular estimate may be inaccurate and lead to suppression of real activation. The mis-specification of the model may result from simple ex-perimental issues such as stimulus timing errors but also from neuronal resting-state activity that is not modeled. Potential task-related respirato-ry changes may not be properly captured by the model either. Any mis-specification will increase the residuals of the GLMfit. Since VasA uses the power of the residuals in a specific low-frequency band, it is rather ro-bust against mis-specifications. In the less likely case that the residuals have a significant component in the VasA frequency band, they will al-ways result in a spurious increase of the VasA estimate (but no decrease). It is plausible that for most cases of mis-specifications the error will be similar across subjects (e.g., for a general timing error). In this case, the percent increase in the VasA estimate will be similar across subjects and thus the relative scaling between subjects and brain areas will be pre-served. Thus, VasA is expected to achieve the same relative improvement in sensitivity in this case.
In the less likely case that the mis-specifications are subject depen-dent, reductions in sensitivity are in principle conceivable. However, in these cases, it is likely that the entire experiment and standard analysis approach will be generally affected. If such a case is suspected, the data can additionally be analyzed with the standard approach since VasA is a post-processing method and does not require tailored data acquisition.
Susceptibility artifacts may potentially influence the VasA estima-tion. The magnitude and extent of susceptibility artifacts in basal brain areas will change with respiration (Menon et al., 1993; Deichmann et
[image:11.595.42.294.93.256.2]al., 2002; Weiskopf et al., 2006). These signal changes may be picked
Table 2
Percent increase in the number of activated voxels (pb0.05, FWE) using VasA fMRI
com-pared to the standard approach. Data were from the HCP study and increases were mea-sured across different regions of interest (ROI).
ROI % Increase in number of activated voxels Anterior cingulate 70
Inferior frontal gyrus 12 Superior temporal gyrus 9 Lateral occipital 54 Superior frontal 28
Insular 10
Middle frontal gyrus 25
SMA 14
Superior parietal 11
Hippocampus 29
VMPFC 66
Amygdala 31
Visual cortex 21 Temporal (sup and inf) 26 Orbital frontal 200 Pallidium putamen 69
up by the VasA scaling procedure. Future studies using recordings of pe-ripheral physiology and directly measuring dynamic susceptibility ef-fects will help quantifying this effect (Hutton et al., 2008).
Although VasA may theoretically reduce the sensitivity, our study and results support that this case is highly unlikely. Unlike previous studies
(Kannurpatti and Biswal, 2008; Kalcher et al., 2013), we applied VasA
fMRI to a very wide spectrum of tasks and data sets (Table 1) and the method in every single case outperformed the existing methods (i.e., higher t values and increased number of activated voxels). Although we successfully applied VasA to a wide range of fMRI paradigms and a large number of volunteers, we note that it is not completely clear how well the method will generalize to any arbitrary task or pathophysiological cases. Thus, we cannot fully exclude the possibility that VasA may underperform and reduce functional sensitivity in these particular cases.
Improved sensitivity and reduced bias
VasA fMRI supports the detection of subtle group effects. For several brain areas, the increase in sensitivity is comparable to the increase ob-served for an increase infield strength from 1.5 T to 4.0 T or the use of multi-channel RF head coils instead of single-channel coils (ca. 20%t -score increase (Yang et al., 1999)).
Vascularization may systematically vary between groups, e.g., for different age-groups (Richter and Richter, 2003) or patient versus con-trol groups. Thus, the group analyses might not reflect differences in neural activity but rather difference in vascular responses (Thomason
et al., 2005). For such studies, VasA fMRI may capture some of the
sys-tematic differences. Although this study did not demonstrate it, VasA promises a simple practical way of reducing the probability of misinterpreting spurious vascular group differences as neural in origin to a certain degree (Chugani et al., 1987; Gaillard et al., 2001).
Physiological basis of the VasA maps
The VasA estimates were correlated with CVR and VASO CBV mea-surements, in line with the assertion that VasA adjusts for inter-individ-ual vascular response differences. The VasA maps correlate more strongly with CBV-based VASO signal fluctuations (in units of %ΔVASO) acquired during resting state, suggesting that a large portion of the VasA maps reflects baseline vascularization. The observed corre-lation with CVR maps may be driven by the recorre-lationship to CBV since CVR generally depends on CBV (Ainslie and Duffin, 2009). We note that not all sources of physiological variations could be explained.
The use of VasA maps as a vascular scaling factor is not only supported by our data but also by recent work byTsvetanov et al. (2015), where the authors showed evidence from magnetoencephalographic recordings (MEG) of how scaling by RSFA could be used to separate neuronal from vascular confounds in an ageing study. The authors used mediation models to determine the variability differences between the vascular and the neural mediators for effects of age on RSFA. They reported that 48% of the variance is explained by the vascular mediator in comparison with 7% explained by the neural mediator (Tsvetanov et al., 2015).
To more comprehensively understand and robustly assess the phys-iological underpinnings of VasA, follow-up studies will need to consider the other components influencing the BOLD response such as CBF, CBV, and CMRO2(Blockley et al., 2013).
Conclusion
VasA fMRI significantly increases functional sensitivity in group analyses. It is straightforward to add to current analysis methods and can be applied to any task fMRI data set irrespective of the task or acqui-sition protocol. It does not require additional reference scans or other complicated procedures. In our study, VasA clearly outperformed the standard analysis and a current alternative rescaling approach based on rsfMRI data. VasA fMRI efficiently improves sensitivity. If BOLD
amplitude rescaling is desired, VasA reduces scanning time and stress for patients compared to existing calibration methods. While future studies will be required to further determine the detailed mechanisms behind the VasA approach, the explorative comparisons between VasA and other BOLD parameters, including CVR and CBV, suggest that VasA is generalizable to a broad set of tasks and experimental conditions.
Acknowledgments
The Wellcome Trust Centre for Neuroimaging is supported by core funding from the Wellcome Trust 091593/Z/10/Z. The research leading to these results has received funding from the European Research Coun-cil under the European Union's Seventh Framework Programme (FP7/ 2007-2013)/ERC grant agreement no. 616905. Data were provided by the Human Connectome Project, WU-Minn Consortium (Principal In-vestigators: David Van Essen and Kamil Ugurbil; 1U54MH091657), funded by the 16 NIH Institutes and Centers that support the NIH Blue-print for Neuroscience Research, and by the McDonnell Center for Sys-tems Neuroscience at Washington University. AK was supported by the Medical Research Council (G1002194).
References:
Aalkjaer, C., Nilsson, H., 2005.Vasomotion: cellular background for the oscillator and for the synchronization of smooth muscle cells. Br. J. Pharmacol. 144, 605–616.
Ainslie, P.N., Duffin, J., 2009. Integration of cerebrovascular CO2 reactivity and
chemoreflex control of breathing: mechanisms of regulation, measurement, and in-terpretation. Am. J. Physiol. Regul. Integr. Comp. Physiol. 296, R1473–R1495.
Ashburner, J., Friston, K.J., 2011.Diffeomorphic registration using geodesic shooting and Gauss–Newton optimisation. NeuroImage 55, 954–967.
Bandettini, P.A., Wong, E.C., 1997.A hypercapnia-based normalization method for im-proved spatial localization of human brain activation with fMRI. NMR Biomed. 10, 197–203.
Barch, D.M., Burgess, G.C., Harms, M.P., Petersen, S.E., Schlaggar, B.L., Corbetta, M., Glasser, M.F., Curtiss, S., Dixit, S., Feldt, C., Nolan, D., Bryant, E., Hartley, T., Footer, O., Bjork, J.M., Poldrack, R., Smith, S., Johansen-Berg, H., Snyder, A.Z., Van Essen, D.C., 2013.
Function in the human connectome: task-fMRI and individual differences in behav-ior. NeuroImage 80, 169–189.
Blockley, N.P., Griffeth, V.E., Simon, A.B., Buxton, R.B., 2013.A review of calibrated blood oxygenation level-dependent (BOLD) methods for the measurement of task-induced changes in brain oxygen metabolism. NMR Biomed. 26, 987–1003.
Buxton, R.B., Uludag, K., Dubowitz, D.J., Liu, T.T., 2004.Modeling the hemodynamic re-sponse to brain activation. NeuroImage 23 (Suppl. 1), S220–S233.
Chang, C., Glover, G.H., 2009.Relationship between respiration, end-tidal CO2, and BOLD signals in resting-state fMRI. NeuroImage 47, 1381–1393.
Chang, C., Cunningham, J.P., Glover, G.H., 2009.Influence of heart rate on the BOLD signal: the cardiac response function. NeuroImage 44, 857–869.
Chen, J.J., Pike, G.B., 2010.MRI measurement of the BOLD-specificflow-volume relation-ship during hypercapnia and hypocapnia in humans. NeuroImage 53, 383–391.
Chiarelli, P.A., Bulte, D.P., Wise, R., Gallichan, D., Jezzard, P., 2007.A calibration method for quantitative BOLD fMRI based on hyperoxia. NeuroImage 37, 808–820.
Chugani, H.T., Phelps, M.E., Mazziotta, J.C., 1987.Positron emission tomography study of human brain functional development. Ann. Neurol. 22, 487–497.
Cohen, E.R., Rostrup, E., Sidaros, K., Lund, T.E., Paulson, O.B., Ugurbil, K., Kim, S.G., 2004.
Hypercapnic normalization of BOLD fMRI: comparison acrossfield strengths and pulse sequences. NeuroImage 23, 613–624.
Davis, T.L., Kwong, K.K., Weisskoff, R.M., Rosen, B.R., 1998.Calibrated functional MRI: mapping the dynamics of oxidative metabolism. Proc. Natl. Acad. Sci. U. S. A. 95, 1834–1839.
Deichmann, R., Josephs, O., Hutton, C., Corfield, D.R., Turner, R., 2002.Compensation of susceptibility-induced BOLD sensitivity losses in echo-planar fMRI imaging. NeuroImage 15, 120–135.
D'Esposito, M., Zarahn, E., Aguirre, G.K., Rypma, B., 1999.The effect of normal aging on the coupling of neural activity to the bold hemodynamic response. NeuroImage 10, 6–14.
Di, X., Kannurpatti, S.S., Rypma, B., Biswal, B.B., 2013.Calibrating BOLD fMRI activations with neurovascular and anatomical constraints. Cereb. Cortex 23, 255–263 (New York, NY : 1991).
Donahue, M.J., Dethrage, L.M., Faraco, C.C., Jordan, L.C., Clemmons, P., Singer, R., Mocco, J., Shyr, Y., Desai, A., O'Duffy, A., Riebau, D., Hermann, L., Connors, J., Kirshner, H., Strother, M.K., 2014.Routine clinical evaluation of cerebrovascular reserve capacity using carbogen in patients with intracranial stenosis. Stroke; a j. cereb. circulation 45, 2335–2341.
Fera, F., Yongbi, M.N., van Gelderen, P., Frank, J.A., Mattay, V.S., Duyn, J.H., 2004.EPI-BOLD fMRI of human motor cortex at 1.5 T and 3.0 T: sensitivity dependence on echo time and acquisition bandwidth. J. Magn. Reson. Imaging JMRI 19, 19–26.
Garcia-Eulate, R., Garcia-Garcia, D., Dominguez, P.D., Noguera, J.J., De Luis, E., Rodriguez-Oroz, M.C., Zubieta, J.L., 2011.Functional bold MRI: advantages of the 3 T vs. the 1.5 T. Clin. Imaging 35, 236–241.
Gati, J.S., Menon, R.S., Ugurbil, K., Rutt, B.K., 1997.Experimental determination of the BOLDfield strength dependence in vessels and tissue. Magn. Reson. Med. Off. j. Soc. Magn. Reson. Med. Soc. Magn. Reson. Med. 38, 296–302.
Glasser, M.F., Sotiropoulos, S.N., Wilson, J.A., Coalson, T.S., Fischl, B., Andersson, J.L., Xu, J., Jbabdi, S., Webster, M., Polimeni, J.R., Van Essen, D.C., Jenkinson, M., 2013.The mini-mal preprocessing pipelines for the Human Connectome Project. NeuroImage 80, 105–124.
Grubb Jr., R.L., Raichle, M.E., Eichling, J.O., Ter-Pogossian, M.M., 1974.The effects of chang-es in PaCO2 on cerebral blood volume, bloodflow, and vascular mean transit time. Stroke; a j. cereb. circulation 5, 630–639.
Handwerker, D.A., Gazzaley, A., Inglis, B.A., D'Esposito, M., 2007.Reducing vascular vari-ability of fMRI data across aging populations using a breathholding task. Hum. Brain Mapp. 28, 846–859.
Hino, J.K., Short, B.L., Rais-Bahrami, K., Seale, W.R., 2000.Cerebral bloodflow and metab-olism during and after prolonged hypercapnia in newborn lambs. Crit. Care Med. 28, 3505–3510.
Hoge, R.D., 2012.Calibrated FMRI. NeuroImage 62, 930–937.
Hope, T.M., Prejawa, S., Parker, J., Oberhuber, M., Seghier, M.L., Green, D.W., Price, C.J., 2014.Dissecting the functional anatomy of auditory word repetition. Front. Hum. Neurosci. 8, 246.
Horvath, I., Sandor, N.T., Ruttner, Z., McLaughlin, A.C., 1994.Role of nitric oxide in regulat-ing cerebrocortical oxygen consumption and bloodflow during hypercapnia. J. Cereb. Blood Flow Metab. off. j. Int. Soc. Cereb. Blood Flow Metab 14, 503–509.
Huber, L., Ivanov, D., Krieger, S.N., Streicher, M.N., Mildner, T., Poser, B.A., Moller, H.E., Turner, R., 2014.Slab-selective, BOLD-corrected VASO at 7 Tesla provides measures of cerebral blood volume reactivity with high signal-to-noise ratio. Magn. Reson. Med. off. j. Soc. Magn. Reson. Med. Soc. Magn. Reson. Med. 72, 137–148.
Huettel, S.A., McCarthy, G., 2001.Regional differences in the refractory period of the he-modynamic response: an event-related fMRI study. NeuroImage 14, 967–976.
Hutton, C., Featherstone, E., Weiskopf, N., 2008.Cardio-respiratory effects on the phase in EPI. ISMRM 16, Toronto.
Hutton, C., Josephs, O., Stadler, J., Featherstone, E., Reid, A., Speck, O., Bernarding, J., Weiskopf, N., 2011.The impact of physiological noise correction on fMRI at 7 T. NeuroImage 57, 101–112.
Jones, M., Berwick, J., Hewson-Stoate, N., Gias, C., Mayhew, J., 2005.The effect of hyper-capnia on the neural and hemodynamic responses to somatosensory stimulation. NeuroImage 27, 609–623.
Kalcher, K., Boubela, R.N., Huf, W., Biswal, B.B., Baldinger, P., Sailer, U., Filzmoser, P., Kasper, S., Lamm, C., Lanzenberger, R., Moser, E., Windischberger, C., 2013.RESCALE: voxel-specific task-fMRI scaling using resting state fluctuation amplitude. NeuroImage 70, 80–88.
Kannurpatti, S.S., Biswal, B.B., 2008.Detection and scaling of task-induced fMRI-BOLD re-sponse using resting statefluctuations. NeuroImage 40, 1567–1574.
Kannurpatti, S.S., Biswal, B.B., Hudetz, A.G., 2002.Differential fMRI-BOLD signal response to apnea in humans and anesthetized rats. Magn. reson. med. off. j. Soc. Magn. Reson. Med. Soc. Magn. Reson. Med. 47, 864–870.
Kannurpatti, S.S., Rypma, B., Biswal, B.B., 2012.Prediction of task-related BOLD fMRI with amplitude signatures of resting-state. Front. Syst. Neurosci. 6.
Kastrup, A., Kruger, G., Glover, G.H., Moseley, M.E., 1999.Assessment of cerebral oxidative metabolism with breath holding and fMRI. Mag. reson. med. off. j. Soc. Magn. Reson. Med. Soc. Mag. Reson. Med. 42, 608–611.
Kaza, E., Klose, U., Lotze, M., 2011.Comparison of a 32-channel with a 12-channel head coil: are there relevant improvements for functional imaging? J. Magn. Reson. Imag-ing JMRI 34, 173–183.
Kennerley, A.J., Harris, S., Bruyns-Haylett, M., Boorman, L., Zheng, Y., Jones, M., Berwick, J., 2012.Early and late stimulus-evoked cortical hemodynamic responses provide in-sight into the neurogenic nature of neurovascular coupling. J. cereb. bloodflow metab off. j. Int. Soc. Cereb. Blood Flow Metab 32, 468–480.
Krasnow, B., Tamm, L., Greicius, M.D., Yang, T.T., Glover, G.H., Reiss, A.L., Menon, V., 2003.
Comparison of fMRI activation at 3 and 1.5 T during perceptual, cognitive, and affec-tive processing. NeuroImage 18, 813–826.
Kruger, G., Kastrup, A., Glover, G.H., 2001.Neuroimaging at 1.5 T and 3.0 T: comparison of oxygenation-sensitive magnetic resonance imaging. Magn. Reson. Med. off. j. Soc. Magn. Reson. Med. Soc. Magn. Reson. Med. 45, 595–604.
Larson-Prior, L.J., Oostenveld, R., Della Penna, S., Michalareas, G., Prior, F., Babajani-Feremi, A., Schoffelen, J.M., Marzetti, L., de Pasquale, F., Di Pompeo, F., Stout, J., Woolrich, M., Luo, Q., Bucholz, R., Fries, P., Pizzella, V., Romani, G.L., Corbetta, M., Snyder, A.Z., 2013.Adding dy-namics to the Human Connectome Project with MEG. NeuroImage 80, 190–201.
Lauritzen, M., 2005.Reading vascular changes in brain imaging: is dendritic calcium the key? Nat. Rev. Neurosci. 6, 77–85.
Li, T.Q., Kastrup, A., Takahashi, A.M., Moseley, M.E., 1999.Functional MRI of human brain during breath holding by BOLD and FAIR techniques. NeuroImage 9, 243–249.
Lieberman, M.D., Cunningham, W.A., 2009.Type I and Type II error concerns in fMRI re-search: re-balancing the scale. Soc. Cogn. Affect. Neurosci. 4, 423–428.
Logothetis, N.K., 2008.What we can do and what we cannot do with fMRI. Nature 453, 869–878.
Logothetis, N.K., Wandell, B.A., 2004.Interpreting the BOLD signal. Annu. Rev. Physiol. 66, 735–769.
Mayhew, J.E., Askew, S., Zheng, Y., Porrill, J., Westby, G.W., Redgrave, P., Rector, D.M., Harper, R.M., 1996.Cerebral vasomotion: a 0.1-Hz oscillation in reflected light imag-ing of neural activity. NeuroImage 4, 183–193.
McPherson, R.W., Derrer, S.A., Traystman, R.J., 1991.Changes in cerebral CO2 responsivity over time during isoflurane anesthesia in the dog. J. Neurosurg. Anesthesiol. 3, 12–19.
Menon, R.S., Ogawa, S., Tank, D.W., Ugurbil, K., 1993.Tesla gradient recalled echo charac-teristics of photic stimulation-induced signal changes in the human primary visual cortex. Magn. Reson. Med. off. j. Soc. Magn. Reson. Med. Soc. Magn. Reson. Med 30, 380–386.
Mohtasib, R.S., Lumley, G., Goodwin, J.A., Emsley, H.C., Sluming, V., Parkes, L.M., 2012. Cal-ibrated fMRI during a cognitive Stroop task reveals reduced metabolic response with increasing age. NeuroImage 59, 1143–1151.
Mueller, S., Wang, D., Fox, M.D., Yeo, B.T., Sepulcre, J., Sabuncu, M.R., Shafee, R., Lu, J., Liu, H., 2013.Individual variability in functional connectivity architecture of the human brain. Neuron 77, 586–595.
Murphy, K., Harris, A.D., Wise, R.G., 2011.Robustly measuring vascular reactivity differ-ences with breath-hold: normalising stimulus-evoked and resting state BOLD fMRI data. NeuroImage 54, 369–379.
Nilsson, H., Aalkjaer, C., 2003.Vasomotion: mechanisms and physiological importance. Mol. Interv. 3 (79-89), 51.
Parker Jones, O., Prejawa, S., Hope, T.M., Oberhuber, M., Seghier, M.L., Leff, A.P., Green, D.W., Price, C.J., 2014.Sensory-to-motor integration during auditory repetition: a combined fMRI and lesion study. Front. Hum. Neurosci. 8, 24.
Porret, C.A., Stergiopulos, N., Hayoz, D., Brunner, H.R., Meister, J.J., 1995.Simultaneous ip-silateral and contralateral measurements of vasomotion in conduit arteries of human upper limbs. Am. J. Physiol. 269, H1852–H1858.
Price, C.J., Seghier, M.L., Leff, A.P., 2010.Predicting language outcome and recovery after stroke: the PLORAS system. Nat. Rev. Neurol. 6, 202–210.
Prisman, E., Slessarev, M., Han, J., Poublanc, J., Mardimae, A., Crawley, A., Fisher, J., Mikulis, D., 2008.Comparison of the effects of independently-controlled end-tidal PCO(2) and PO(2) on blood oxygen level-dependent (BOLD) MRI. J. Magn. Reson. Imaging JMRI 27, 185–191.
Richter, W., Richter, M., 2003.The shape of the fMRI BOLD response in children and adults changes systematically with age. NeuroImage 20, 1122–1131.
Schechner, J.S., Braverman, I.M., 1992.Synchronous vasomotion in the human cutaneous microvasculature provides evidence for central modulation. Microvasc. Res. 44, 27–32.
Shmueli, K., van Gelderen, P., de Zwart, J.A., Horovitz, S.G., Fukunaga, M., Jansma, J.M., Duyn, J.H., 2007.Low-frequencyfluctuations in the cardiac rate as a source of vari-ance in the resting-state fMRI BOLD signal. NeuroImage 38, 306–320.
Siesjo, B.K., 1980.Cerebral metabolic rate in hypercarbia—a controversy. Anesthesiology 52, 461–465.
Sirotin, Y.B., Das, A., 2009.Anticipatory haemodynamic signals in sensory cortex not pre-dicted by local neuronal activity. Nature 457, 475–479.
Slaaf, D.W., Vrielink, H.H., Tangelder, G.J., Reneman, R.S., 1988.Effective diameter as a de-terminant of local vascular resistance in presence of vasomotion. Am. J. Physiol. 255, H1240–H1243.
Thomason, M.E., Burrows, B.E., Gabrieli, J.D., Glover, G.H., 2005.Breath holding reveals dif-ferences in fMRI BOLD signal in children and adults. NeuroImage 25, 824–837.
Triantafyllou, C., Hoge, R.D., Krueger, G., Wiggins, C.J., Potthast, A., Wiggins, G.C., Wald, L.L., 2005.Comparison of physiological noise at 1.5 T, 3 T and 7 T and optimization of fMRI acquisition parameters. NeuroImage 26, 243–250.
Tsvetanov, K.A., Henson, R.N., Tyler, L.K., Davis, S.W., Shafto, M.A., Taylor, J.R., Williams, N., Cam, C., Rowe, J.B., 2015. The effect of ageing on fMRI: correction for the confounding effects of vascular reactivity evaluated by joint fMRI and MEG in 335 adults. Hum. Brain Mapp.http://dx.doi.org/10.1002/hbm22768.
Van den Aardweg, J.G., Karemaker, J.M., 2002.Influence of chemoreflexes on respiratory variability in healthy subjects. Am. J. Respir. Crit. Care Med. 165, 1041–1047.
Villringer, A., Dirnagl, U., 1995.Coupling of brain activity and cerebral bloodflow: basis of functional neuroimaging. Cerebrovasc. Brain Metab. Rev. 7, 240–276.
Weiskopf, N., Hutton, C., Josephs, O., Deichmann, R., 2006.Optimal EPI parameters for re-duction of susceptibility-induced BOLD sensitivity losses: a whole-brain analysis at 3 T and 1.5 T. NeuroImage 33, 493–504.
Wiggins, G.C., Triantafyllou, C., Potthast, A., Reykowski, A., Nittka, M., Wald, L.L., 2006. 32-channel 3 Tesla receive-only phased-array head coil with soccer-ball element geom-etry. Magn. Reson. Med. off. j. Soc. Magn. Reson. Med. Soc. Magn. Reson. Med. 56, 216–223.
Wise, R.G., Ide, K., Poulin, M.J., Tracey, I., 2004.Restingfluctuations in arterial carbon diox-ide induce significant low frequency variations in BOLD signal. NeuroImage 21, 1652–1664.
Wise, R.G., Harris, A.D., Stone, A.J., Murphy, K., 2013.Measurement of OEF and absolute CMRO2: MRI-based methods using interleaved and combined hypercapnia and hyperoxia. NeuroImage 83, 135–147.
Xu, F., Uh, J., Brier, M.R., Hart Jr., J., Yezhuvath, U.S., Gu, H., Yang, Y., Lu, H., 2011.The infl u-ence of carbon dioxide on brain activity and metabolism in conscious humans. J. Cereb. Blood Flow Metab. off. j. Int. Soc. Cereb. Blood Flow Metab 31, 58–67.
Yablonskiy, D.A., 2011.Cerebral metabolic rate in hypercapnia: controversy continues. J. Cereb. Blood Flow Metab. off. j. Int. Soc. Cereb. Blood Flow Metab 31, 1502–1503.
Yang, S.P., Krasney, J.A., 1995.Cerebral bloodflow and metabolic responses to sustained hypercapnia in awake sheep. J. Cereb. Blood Flow Metab. off. j. Int. Soc. Cereb. Blood Flow Metab 15, 115–123.
Yang, Y., Wen, H., Mattay, V.S., Balaban, R.S., Frank, J.A., Duyn, J.H., 1999.Comparison of 3D BOLD functional MRI with spiral acquisition at 1.5 and 4.0 T. NeuroImage 9, 446–451.
Yezhuvath, U.S., Lewis-Amezcua, K., Varghese, R., Xiao, G., Lu, H., 2009.On the assessment of cerebrovascular reactivity using hypercapnia BOLD MRI. NMR Biomed. 22, 779–786.
Zang, Y.F., He, Y., Zhu, C.Z., Cao, Q.J., Sui, M.Q., Liang, M., Tian, L.X., Jiang, T.Z., Wang, Y.F., 2007.Altered baseline brain activity in children with ADHD revealed by resting-state functional MRI. Brain Dev. 29, 83–91.